
Aleksin_Aleksandar
@t_Aleksin_Aleksandar

What symbols does the trader recommend buying?
Purchase History
پیام های تریدر
Filter
Aleksin_Aleksandar
SPX500 Weekly Trend Analysis
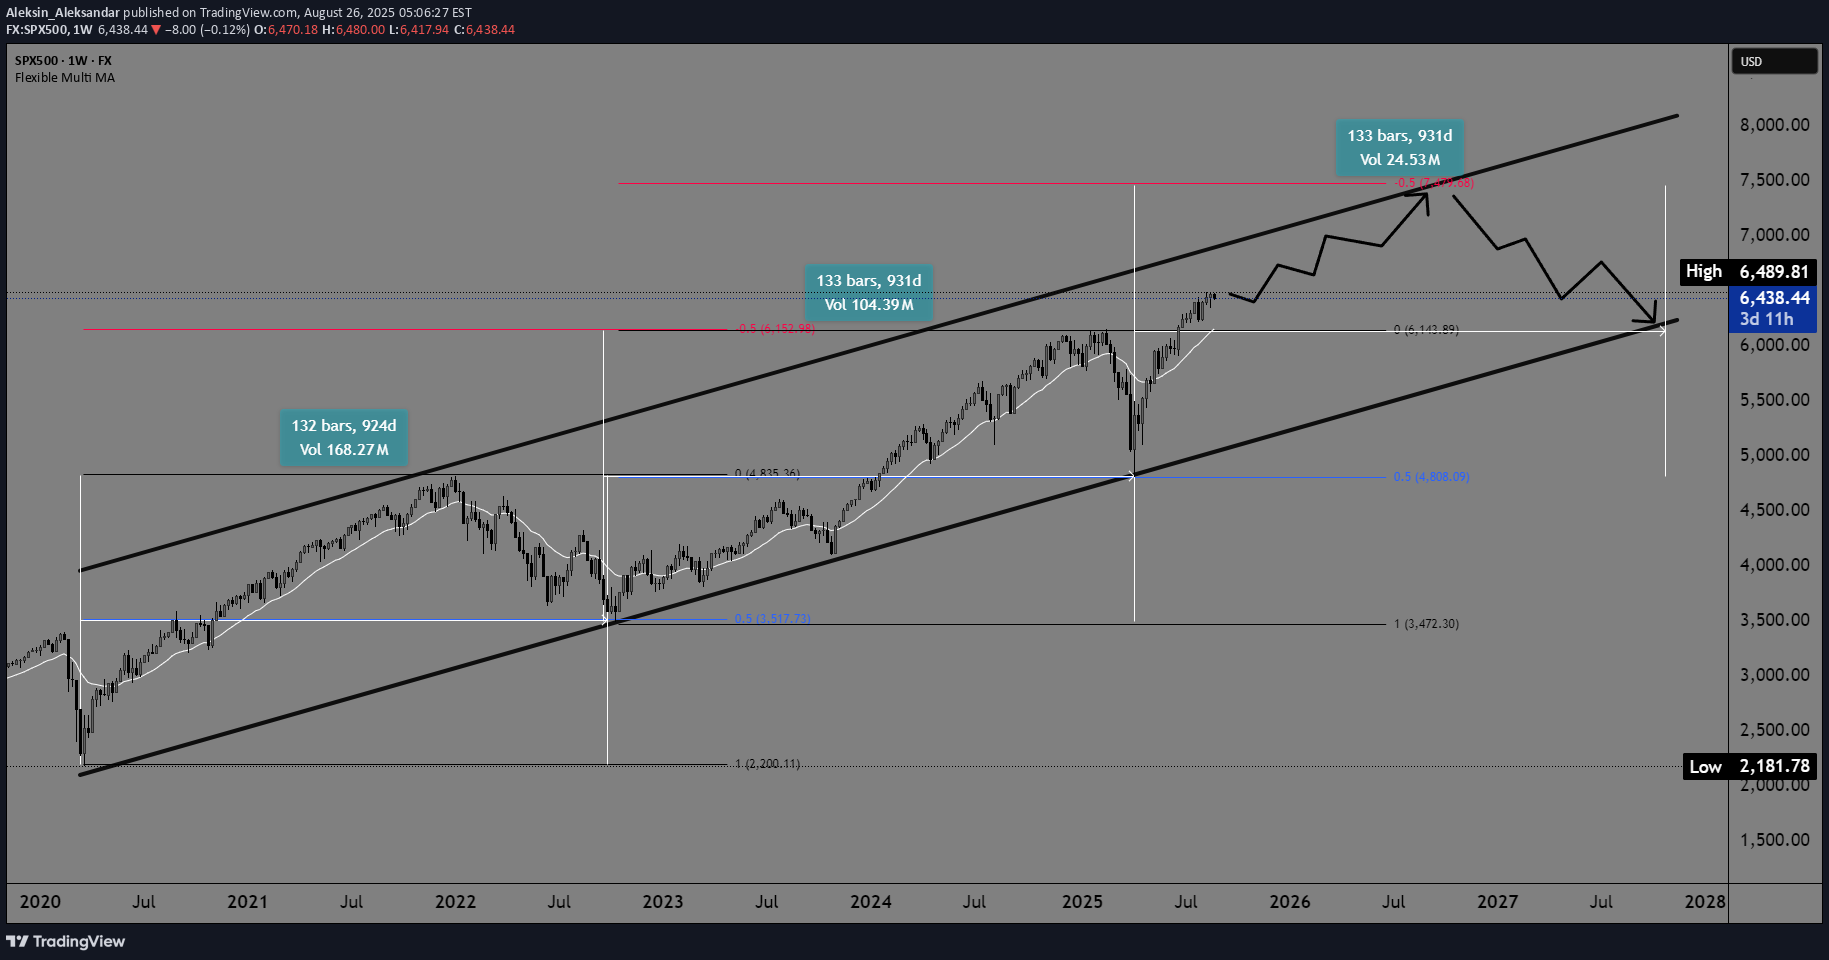
SPX500 Weekly Trend Analysis The SPX500 on a weekly timeframe continues to show an upward trend within a rising channel that has been in place since 2020. The price behavior in relation to the 50.0% Fibonacci retracement levels is particularly interesting—the previous two pullbacks both stopped at this key level, confirming its significant role as support. As a reminder, after forming a low in 2020, the SPX500 entered a long bullish trend that lasted until December 2021, when it recorded its first high at 4500.00. After that, the index pulled back to the 50.0% Fibonacci level and then continued with a new bullish rally. A new higher high was formed around 6000.00, which is again connected to the -50.0% Fibonacci level. The next pullback, similar to the previous one, found support at the 50.0% Fibonacci retracement, suggesting a continuation of the upward trend. Based on this pattern, there is a realistic possibility of a new bullish rally with a potential target of 7500.00 (-50.0% Fibonacci level). Following the previous cycles from low to high and pullback, the average interval is approximately 920–930 days, which provides a rough time projection: Next high: By the end of 2026 Next pullback: First part of 2027 or, at the latest, by October 2027 This pattern confirms the strong long-term growth structure and implies that the SPX500 will likely maintain its positive momentum for several more years, with periodic corrections that rely on key Fibonacci levels.
Aleksin_Aleksandar
Bitcoin and retest at 100k?
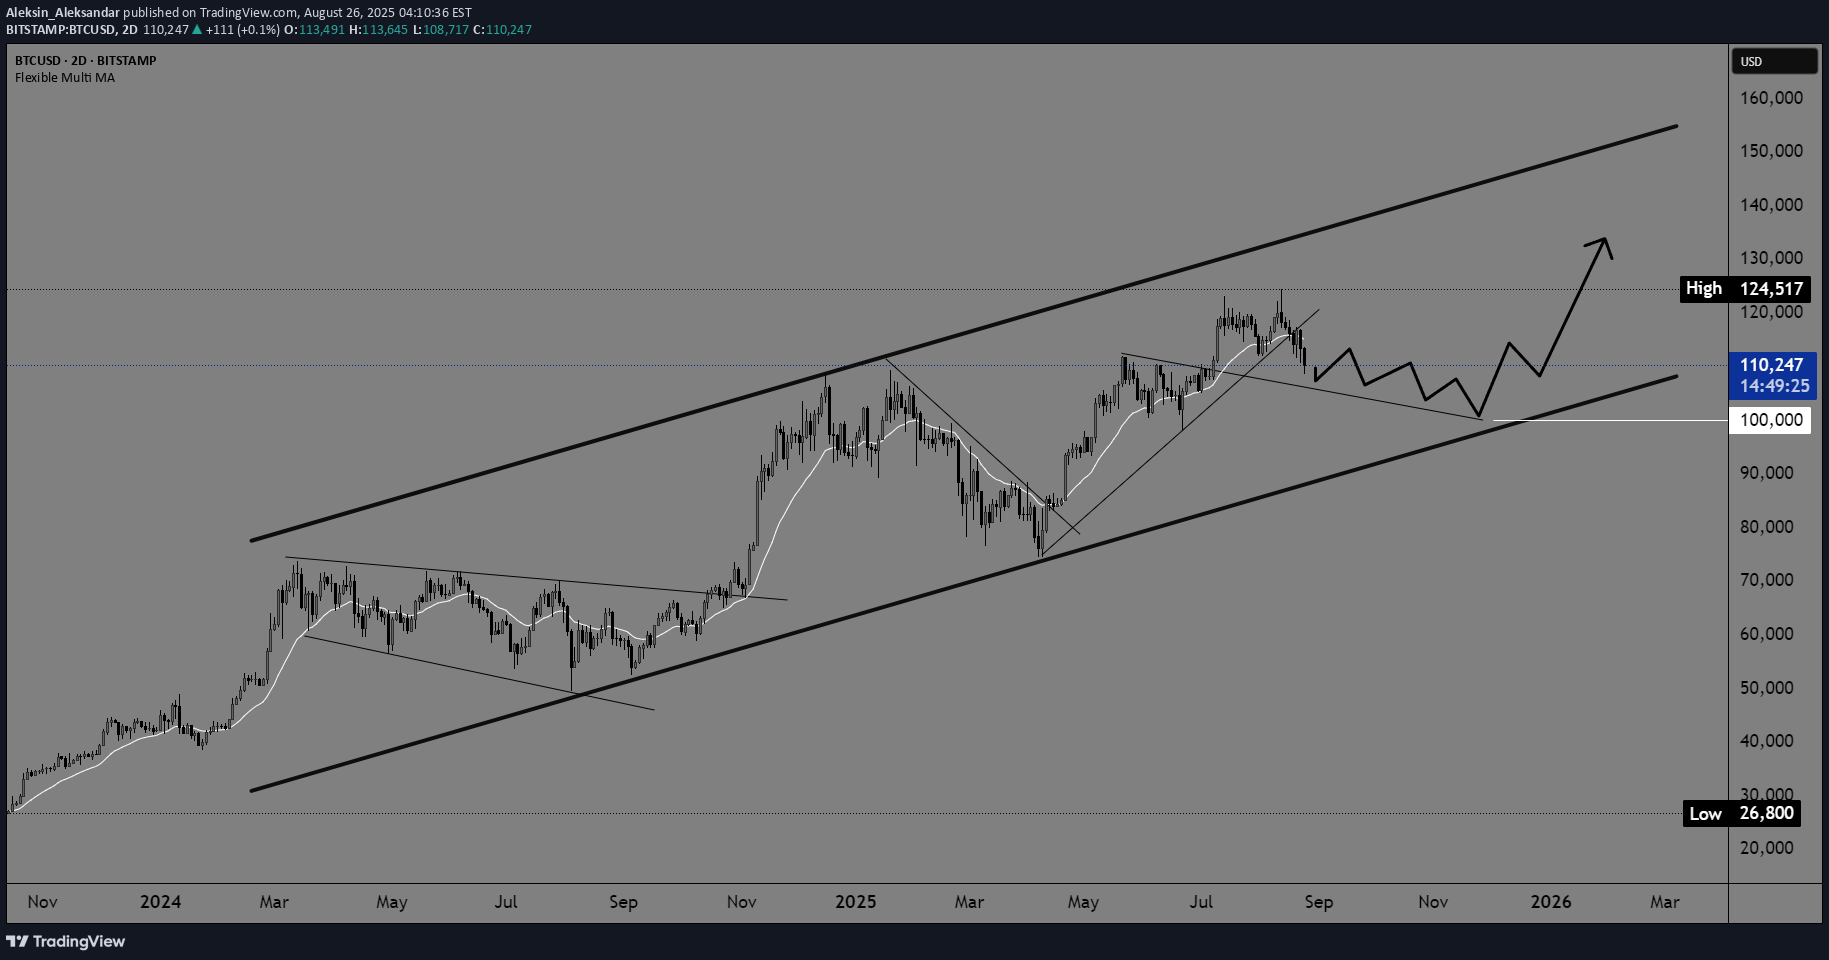
Trend: The main trend is still upward, with the price moving within a wide channel that started at the end of 2023 and extends into 2025/2026. The lower line of the channel (around 100k USD) currently represents the main support, while the upper line (around 150–160k USD) is the potential resistance zone. Short-term movement: The price is currently around 115k USD, and the projection on the chart shows a possible decline toward the lower line of the channel (around 105–110k), where a base for further growth could form. There is a potential “zig-zag” oscillation scenario until the end of 2025, with price staying within the channel. Long-term scenario: If the channel holds, the expected larger impulse is toward 130k+ USD (upper mid-channel), and later potentially toward 150k. The key support level remains around 100k; dropping below that would indicate a break from the channel and a possible trend reversal.
Aleksin_Aleksandar
GOLD again below 3300$
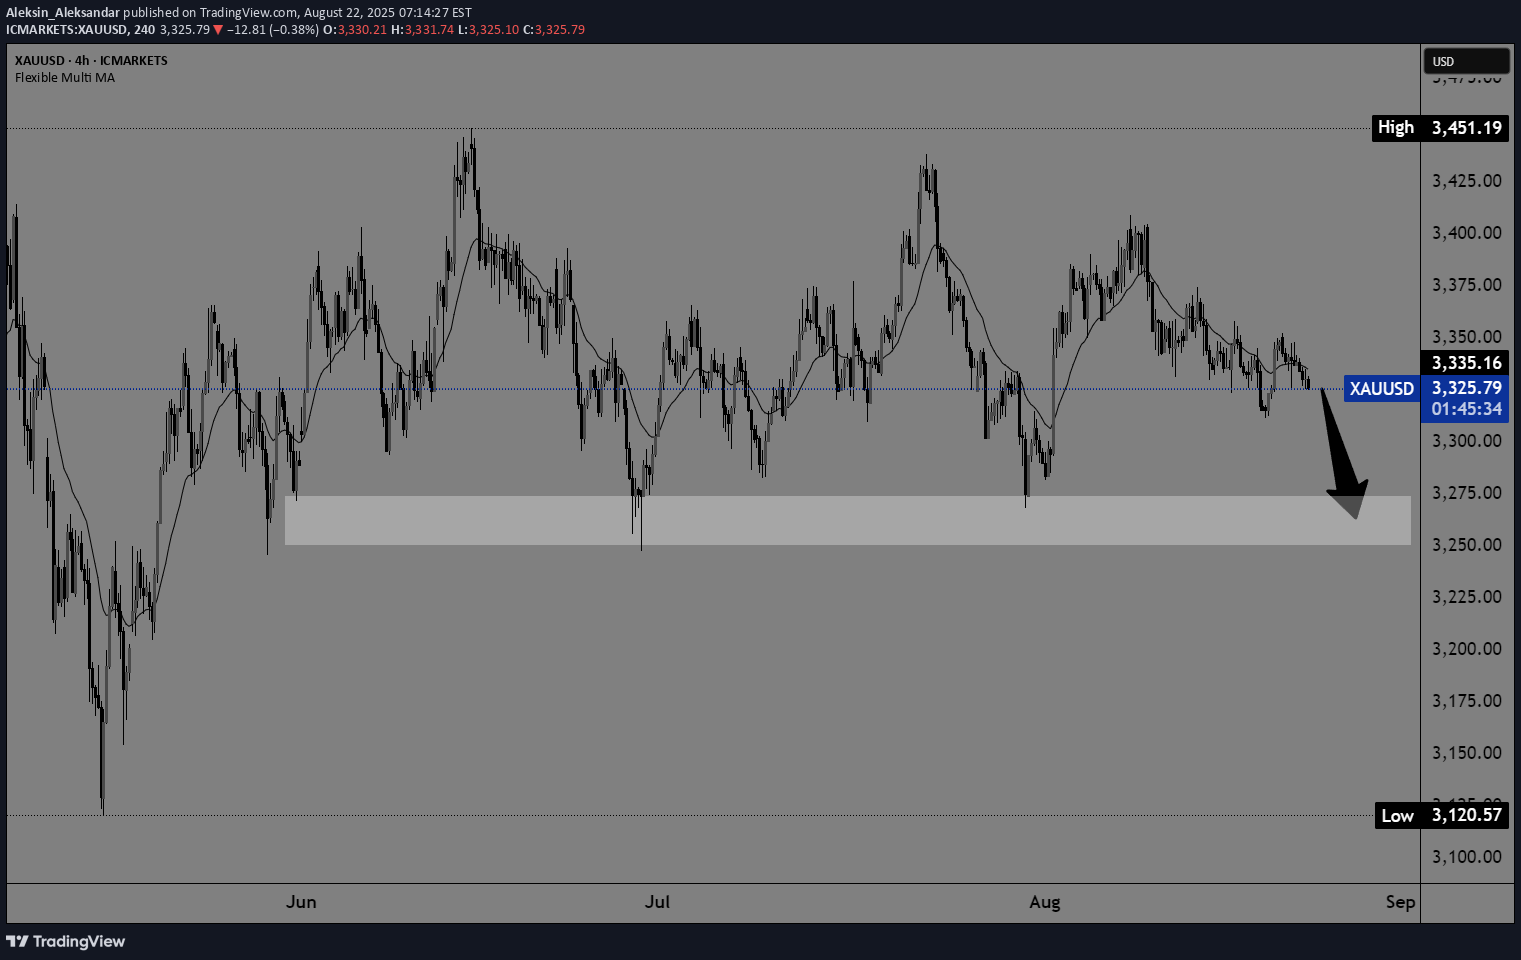
There is a growing chance that gold will drop below $3300 again. A new lower high was formed on Thursday, which is a sign that we should see a continuation on the bearish side.
Aleksin_Aleksandar
Bitcoin possible new LH in zone 86000-88000

$76,600 is a new five-month low for Bitcoin formed this morning. After failing to stabilize above $90,000, the price started a new pullback. An additional failure is that no new high was formed, and a new lower low was formed compared to February 28. Bitcoin is currently recovering and we could see a return to the $86000-$88000 zone.
Aleksin_Aleksandar

Gold is getting closer to the $3000 level, and if the bullish trend continues next week, we can expect a jump to the $2920-2950 range. The price is supported by all moving averages and shows no signs of weakness or slowing of the bullish trend.
Aleksin_Aleksandar
Gold in a dilemma where to go

Where will the price of gold in the week US CPI? A strong CPI could halt the rise in gold prices, hinting that the Fed may delay a rate cut scheduled for next week. A weaker CPI indicates that we are continuing towards the target of 2.00% and this would mean that the Fed continues to cut interest rates and dovish policy. A break below $2900 would push the price to the $2850-$2860 support zone, while a break above $2930 would push the price up to the previous resistance zone of $2955-2960.gold broke the support zone and formed a new low
Aleksin_Aleksandar

An example of how to follow a bullish trend with the help of Fibonacci retracement levels.
Aleksin_Aleksandar
Bitcoin bearish scenario

Bitcoin has fallen below the daily EMA 20 moving average and is moving away from the previous high. $85000 is the next important support zone and if it doesn't hold, we can expect a drop down to $75000.
Aleksin_Aleksandar
Ethereum and support level

Potential new support for Ethereum at $3500. In that zone, we will test the EMA 200 moving average, which was sufficient support for us on previous occasions to continue on the bullish side.
Aleksin_Aleksandar
Gold bullish scenario

The price of gold has a chance to return above the $2600 level this week. During this morning's Asian session, gold managed to break through the previous movement zone and form a new higher high. We are currently testing the EMA 50 and hoping for a continuation to the EMA 200 in the $2620 zone.
Disclaimer
Any content and materials included in Sahmeto's website and official communication channels are a compilation of personal opinions and analyses and are not binding. They do not constitute any recommendation for buying, selling, entering or exiting the stock market and cryptocurrency market. Also, all news and analyses included in the website and channels are merely republished information from official and unofficial domestic and foreign sources, and it is obvious that users of the said content are responsible for following up and ensuring the authenticity and accuracy of the materials. Therefore, while disclaiming responsibility, it is declared that the responsibility for any decision-making, action, and potential profit and loss in the capital market and cryptocurrency market lies with the trader.