Technical analysis by Aleksin_Aleksandar about Symbol SPYX: Buy recommendation (8/26/2025)

Aleksin_Aleksandar
SPX500 Weekly Trend Analysis
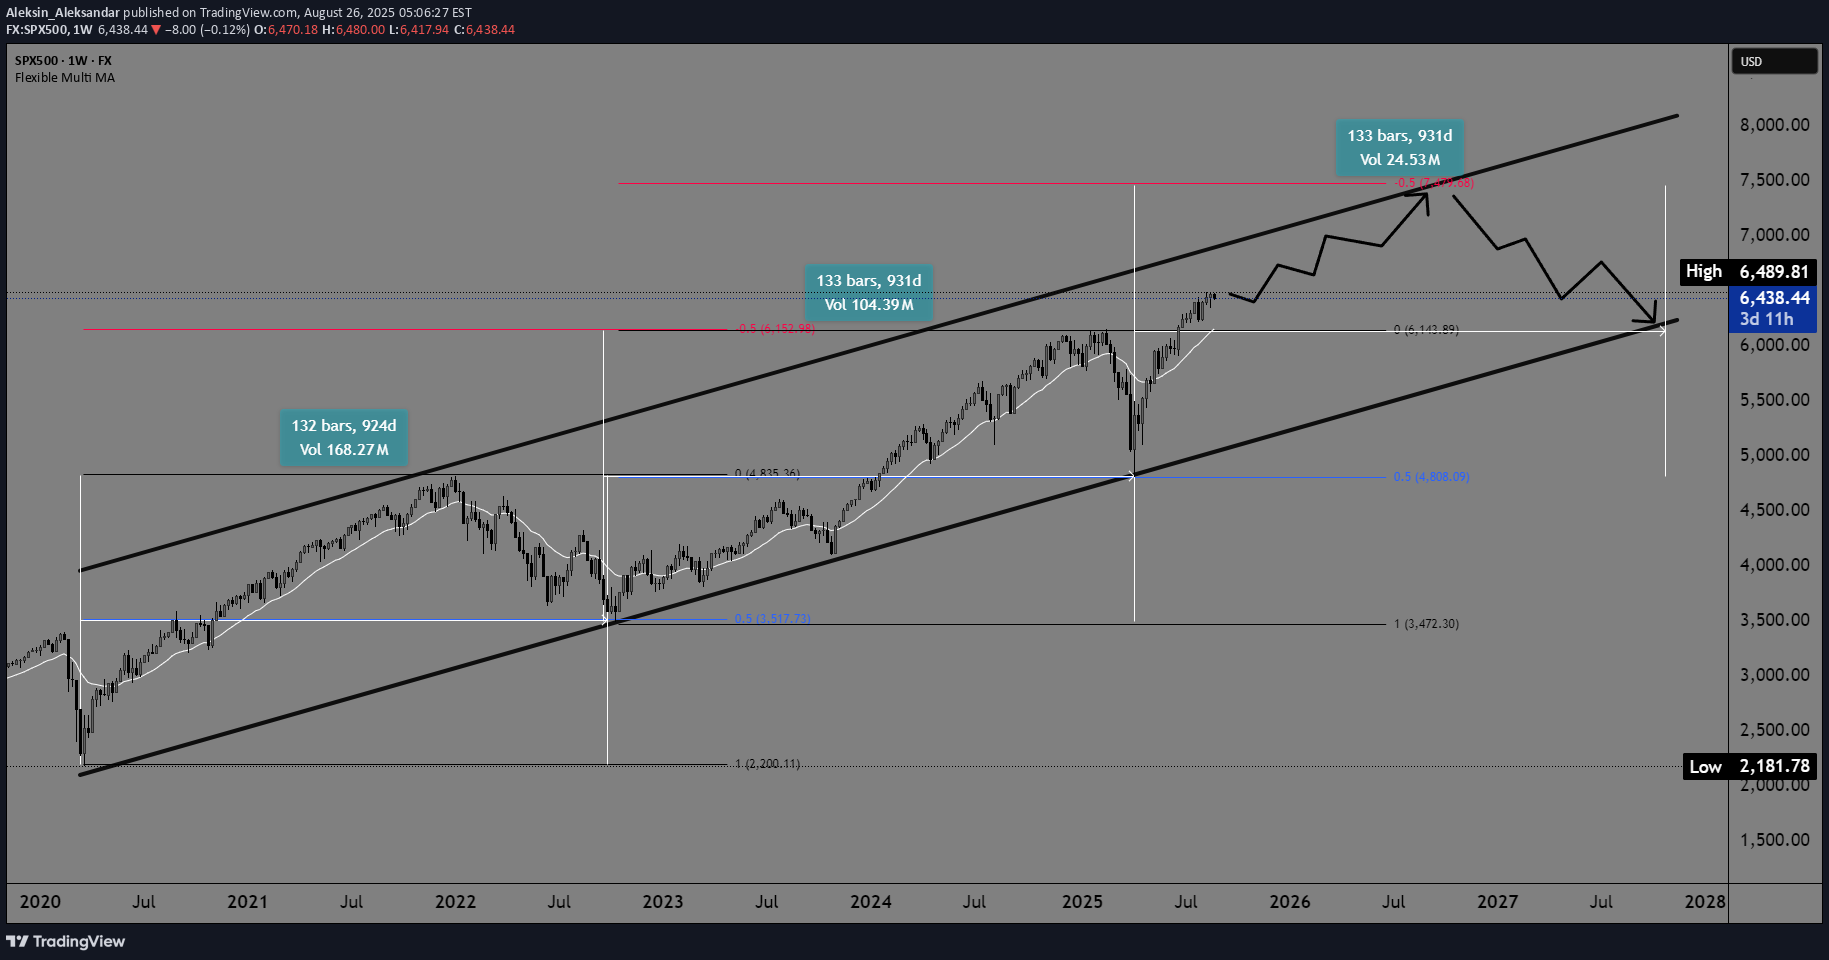
SPX500 Weekly Trend Analysis The SPX500 on a weekly timeframe continues to show an upward trend within a rising channel that has been in place since 2020. The price behavior in relation to the 50.0% Fibonacci retracement levels is particularly interesting—the previous two pullbacks both stopped at this key level, confirming its significant role as support. As a reminder, after forming a low in 2020, the SPX500 entered a long bullish trend that lasted until December 2021, when it recorded its first high at 4500.00. After that, the index pulled back to the 50.0% Fibonacci level and then continued with a new bullish rally. A new higher high was formed around 6000.00, which is again connected to the -50.0% Fibonacci level. The next pullback, similar to the previous one, found support at the 50.0% Fibonacci retracement, suggesting a continuation of the upward trend. Based on this pattern, there is a realistic possibility of a new bullish rally with a potential target of 7500.00 (-50.0% Fibonacci level). Following the previous cycles from low to high and pullback, the average interval is approximately 920–930 days, which provides a rough time projection: Next high: By the end of 2026 Next pullback: First part of 2027 or, at the latest, by October 2027 This pattern confirms the strong long-term growth structure and implies that the SPX500 will likely maintain its positive momentum for several more years, with periodic corrections that rely on key Fibonacci levels.