Alchemy Markets
@t_Alchemy Markets

What symbols does the trader recommend buying?
Purchase History
پیام های تریدر
Filter
Alchemy Markets
شاخص S&P 500 در سراشیبی: فروپاشی کانال صعودی و رسیدن به حمایت ۶۲۰۰ – آیا وحشت در راه است؟
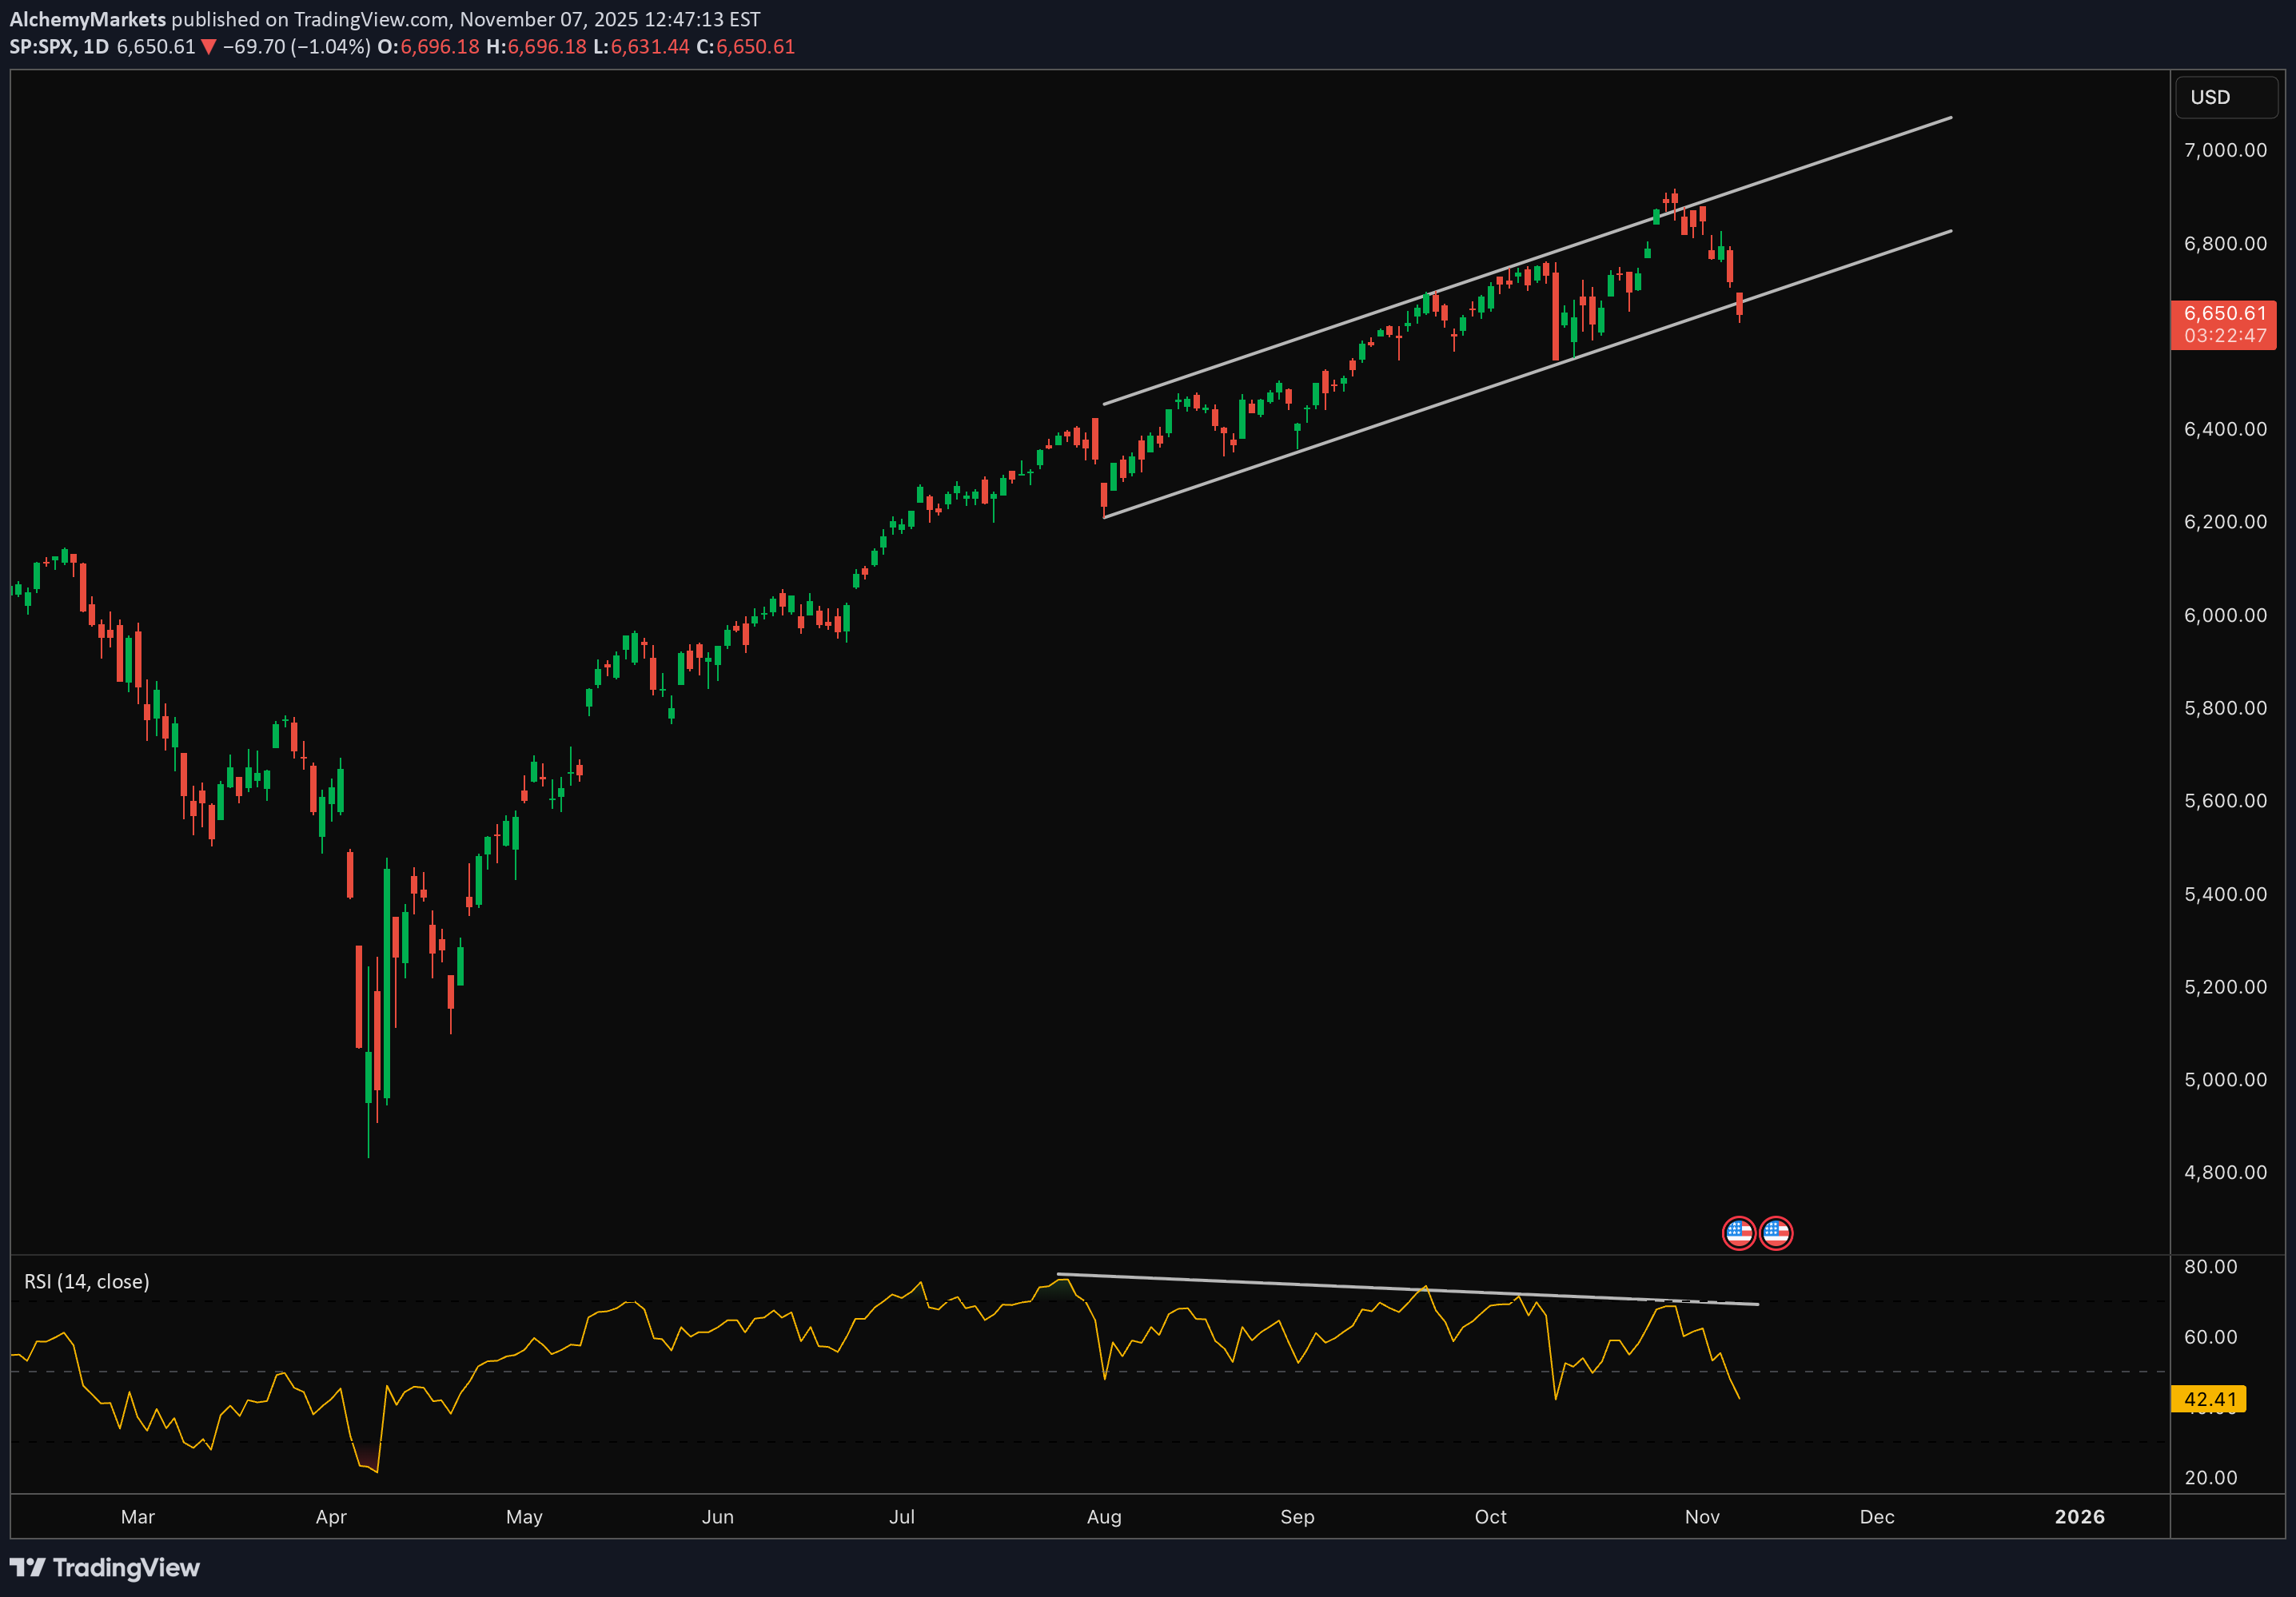
The S&P 500 has now broken decisively below its ascending channel, confirming that selling pressure is broadening out. The VIX has pushed up to the 20-level — reflecting a shift toward risk aversion as investors reassess valuations, Fed uncertainty, and global growth headwinds. Historically, a VIX near 20 signals heightened demand for downside protection but not full-scale panic — often appearing in the early-to-mid phase of a correction. Technical Lens: The index has broken beneath the lower bound of the ascending channel that guided price action for much of 2024–25. RSI is sliding deeper into bearish territory and has already broken the halfway mark (~50), now near 42 — signalling growing downside momentum. Importantly, a bullish RSI divergence is forming: while price makes lower lows, RSI is flattening, hinting that sellers may be losing steam as we approach the next key zone. The next major support sits around 6,200, aligning with previous structure lows and the midpoint retracement of the broader channel. Scenarios: Scenario A (Base case): If SPX continues trading below the broken trendline (~6,650–6,700), the path of least resistance points toward 6,200. Scenario B (Relief setup): If RSI divergence plays out and SPX reclaims the 6,700 region, short-covering could trigger a bounce — but the structure remains bearish while under 6,850. Catalysts: Macro: Uncertainty around the Fed’s December meeting and slowing global growth data. Earnings: Tech and AI names (NVDA, MSFT, GOOGL) remain vulnerable after heavy positioning and valuation fatigue. Volatility: The elevated VIX keeps risk-off bias intact — any sustained rise above 22-23 could accelerate defensive flows. Takeaway: Momentum and volatility both point to deeper correction risk, with 6,200 emerging as the next logical support. Until the index can reclaim 6,850, the bias stays tilted lower — this remains a “watch zone” for potential exhaustion rather than a reversal confirmation.
Alchemy Markets
آمازون (AMZN) در آستانه جهش به ۲۸۵ دلار؟ حمایت کلیدی کجاست؟
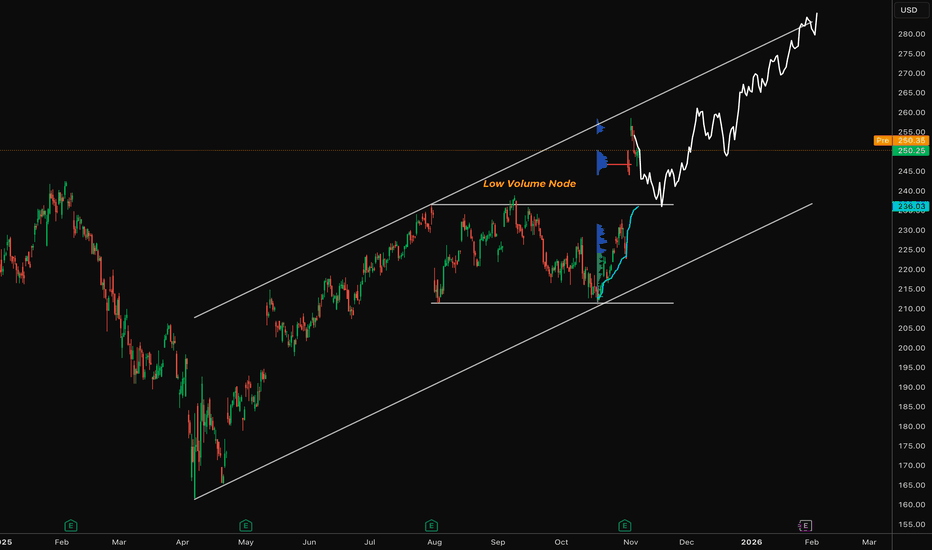
After a strong post-earnings gap higher, AMZN is now pulling back toward a key technical zone — the anchored VWAP and the low-volume node (LVN). In volume profile terms, LVNs often act as springboards for price. Because they represent areas of low trading activity, liquidity is thin — meaning when price revisits these zones, it often rejects quickly as buyers or sellers step in to defend the prior imbalance. Currently, AMZN’s structure shows: Price retesting anchored VWAP support from the October swing low LVN just below acting as potential demand pocket (~$240–$245) Upside channel intact, targeting the $285 zone if this pullback holds A bounce from this region would confirm continuation within the ascending channel — aligning with the broader re-rating theme after solid Q3 earnings momentum. Key Levels: Support: $240–$245 (LVN / anchored VWAP) Resistance: $270, then $285 Bias: Bullish continuation
Alchemy Markets
فروش سنگین در بازار سهام: چرا غولهای فناوری در حال سقوط هستند؟
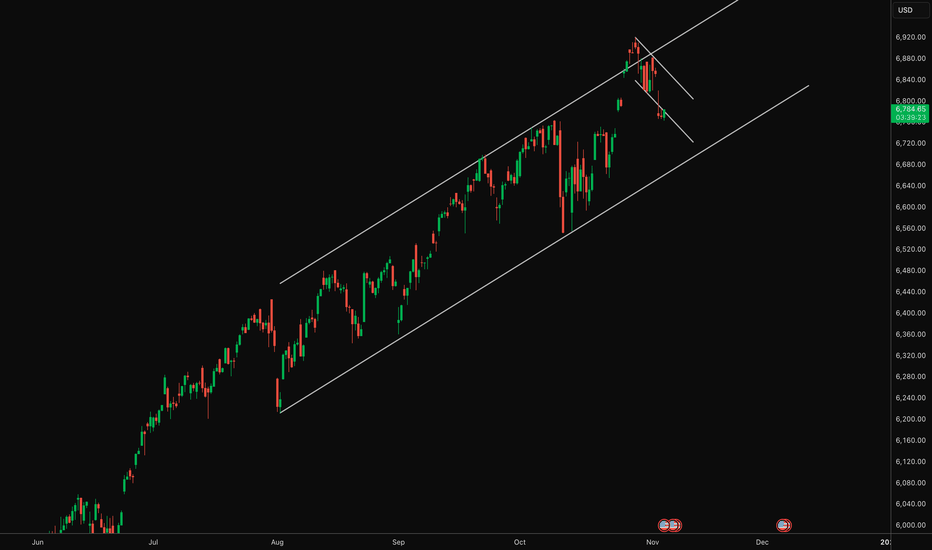
The S&P 500 just broke below its short-term descending channel — confirming selling pressure is building. High-valuation tech and AI names like NVDA , MSFT , GOOGL , MU , and PLTR are leading the pullback as investors rotate out of crowded trades. Macro headwinds — Fed uncertainty, stretched valuations, and global weakness — are weighing on sentiment. Near-term bias stays bearish unless SPX can reclaim 6,850.
Alchemy Markets
سقوط بیت کوین: اصلاح سالم یا آغاز بازار خرسی؟ نکتهای که همه از دست میدهند!
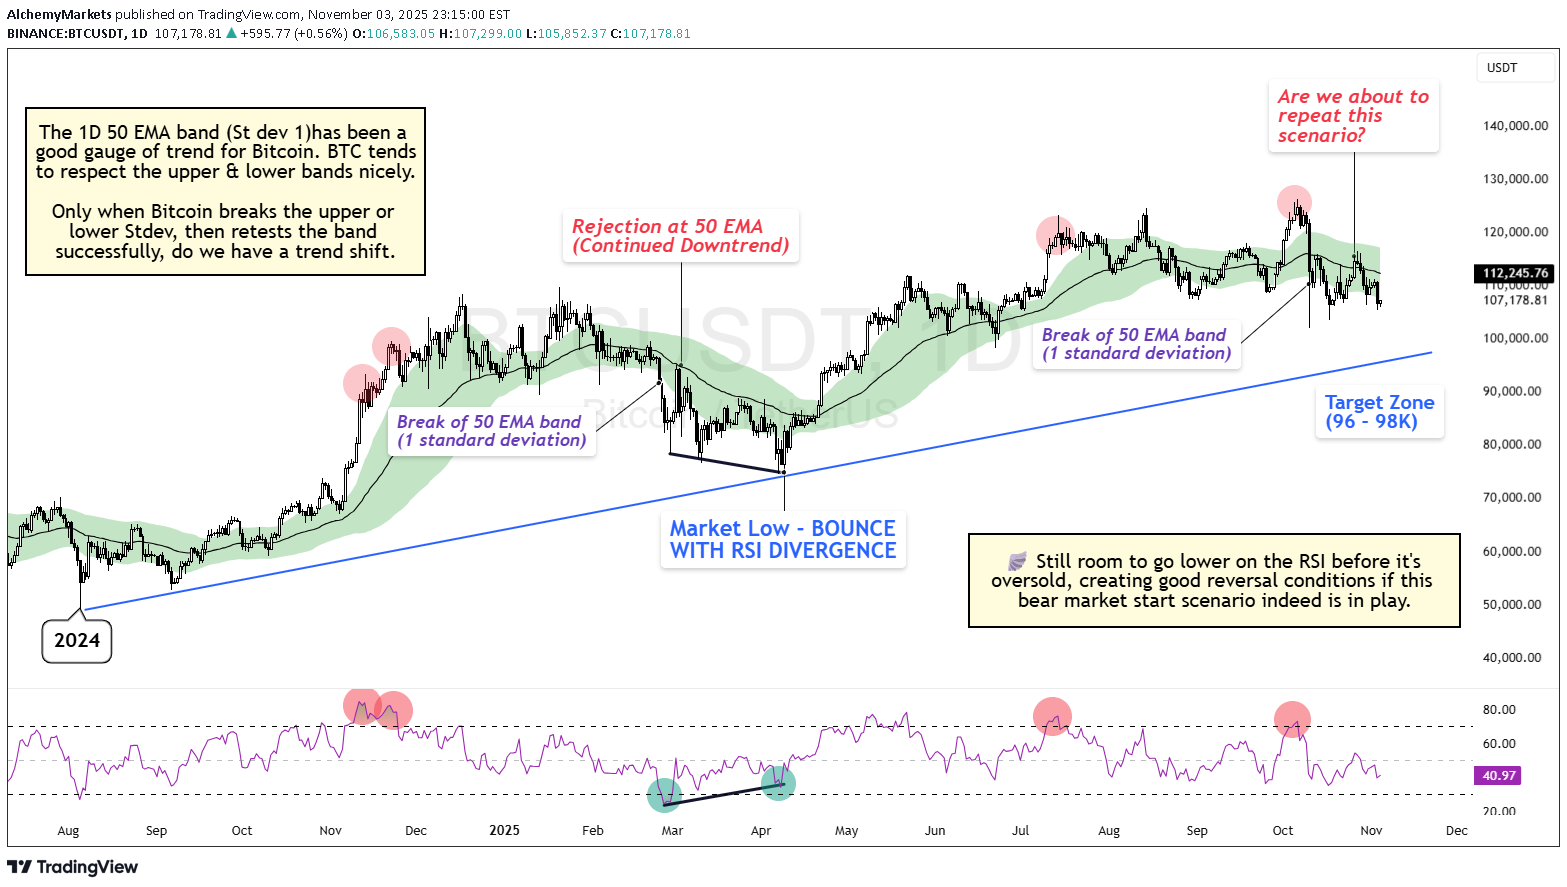
Every time Bitcoin dips, the same old debate comes up: is this the start of a bear market or just a healthy correction? Here's a scenario that MAY play out, and is one that MOST retail traders aren’t watching. This isn’t a prediction, but a rather a keen observation. Right now, the charts are giving mixed signals, and that’s exactly why it deserves a closer look. 🔹 What’s Really Happening After three pushes into the highs, Bitcoin’s daily chart is showing a clear bearish RSI divergence. That usually hints at fading momentum. At the same time, price fell below the 50 EMA band (1 standard deviation) and got rejected right at the EMA line. This setup looks almost identical to what happened in May, and back then it led to a solid mid-teens pullback before the trend recovered. So far, this move from $115K down to the $96K–$98K zone is roughly a 15–17% correction. That’s painful, but still normal inside a bullish cycle. To call it a bear market, BTC would need to break below that 2024 trendline and print lower lows. That has not happened. 🧭 Why It Matters This is where traders often get it wrong. Corrections like this are meant to reset sentiment, clear leverage, and test conviction. They are not always trend reversals. Sometimes, they are the fuel for the next move up. If BTC reaches that 2024 trendline with RSI oversold and a bullish divergence forming, that could mark the next major long setup to watch. 📊 Key Zones Resistance: 50 EMA band (~$115K) Support: $96K–$98K Trigger to watch: RSI divergence + trendline retest Until Bitcoin reclaims the 50 EMA zone, the near-term bias stays cautious. But this still looks like a healthy flush, not a bear turn. 🪽 Stay sharp, trade smart, and let the charts guide you, not your emotions.
Alchemy Markets
پیشبینی سقوط کوتاهمدت آمازون (AMZN) قبل از جهش بزرگ بعدی!
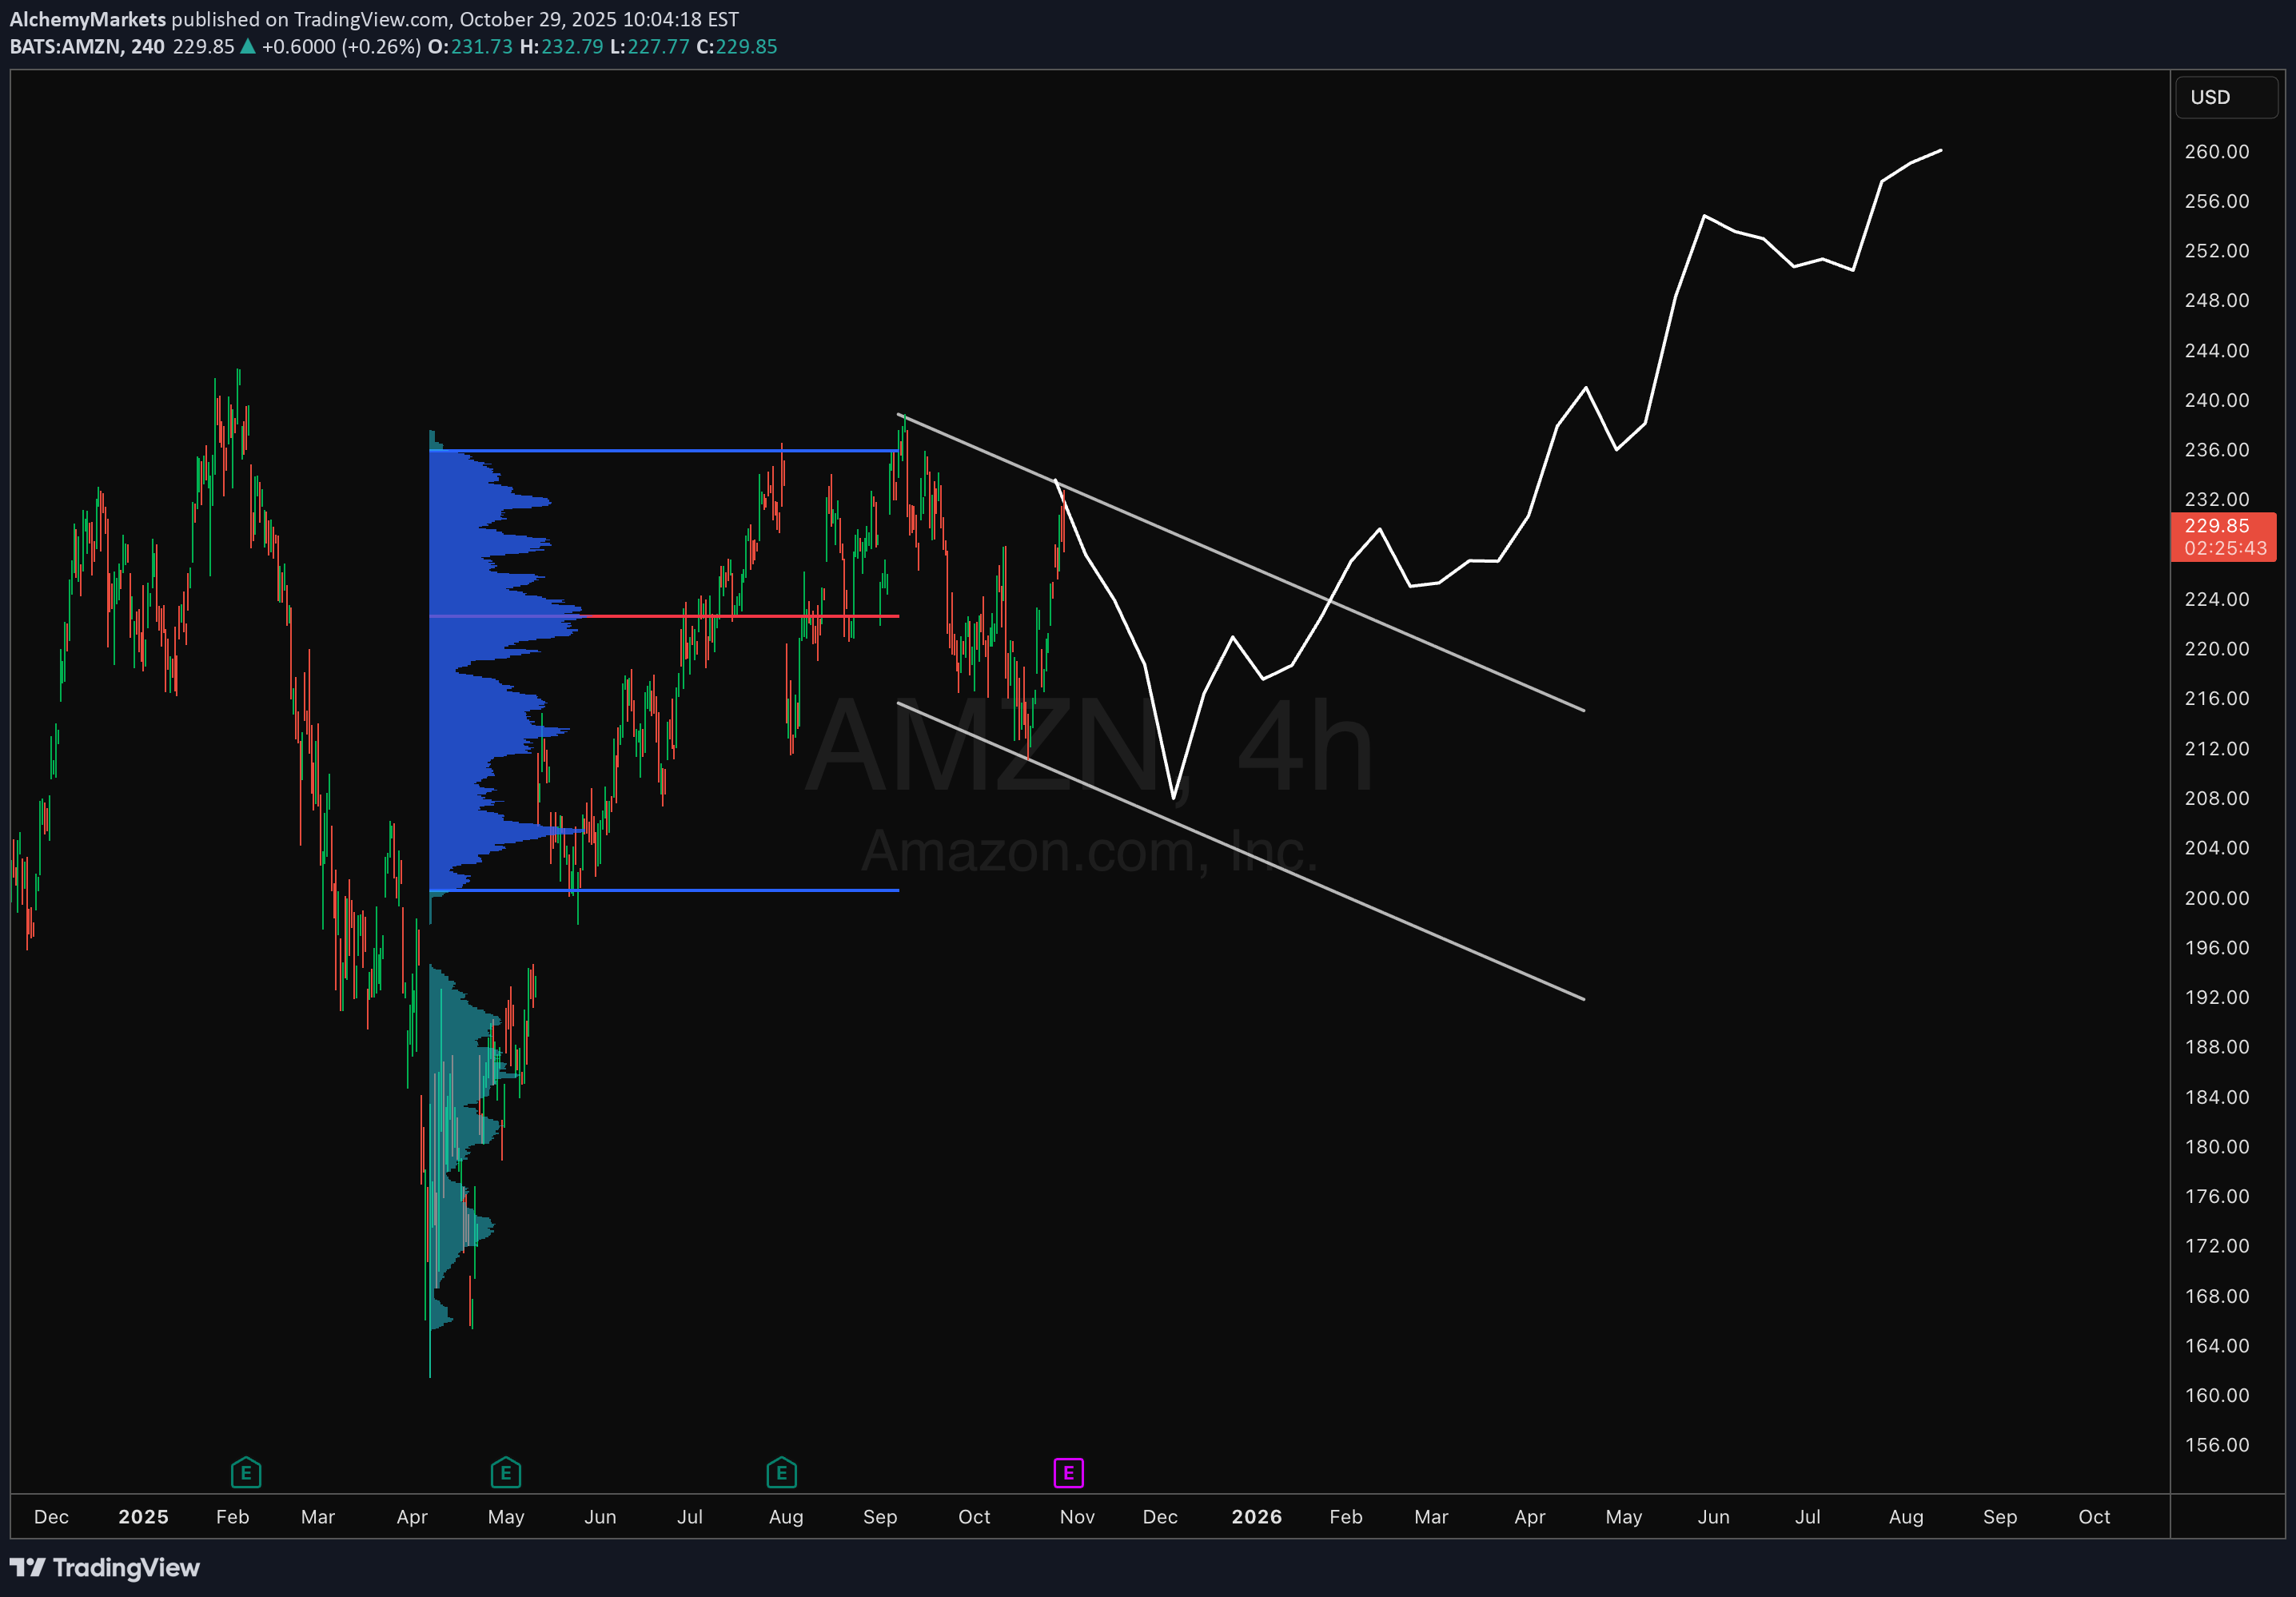
Amazon reports earnings tomorrow, and expectations look well-balanced. Fundamentally, the base case suggests in-line results near guidance — roughly $177–$178B revenue and ~$18B operating income. AWS growth likely holds steady around 17–18% YoY, and Ads should remain strong but may decelerate slightly. Technically, AMZN appears to be trading within a descending channel after forming a major value area between $210–$245. A pullback toward the lower bound ($205–$210) or the point of control from the previous leg could offer a solid re-entry zone before continuation toward the $260+ region later in Q4–Q1 2026. If earnings are solid but not spectacular, this measured correction fits the current market structure—absorbing supply before the next expansion phase. Watch for volume confirmation at support to validate the next swing higher. Key Levels: Support: $205–$210 (POC / lower channel) Resistance: $240–$245 Target: $260+ Bias: Neutral-to-bullish | Base Case Scenario
Alchemy Markets
آینده بیت کوین در گرو چند روز آینده: خیزش یا سقوط؟ سطوح کلیدی قبل از حرکت بزرگ بعدی
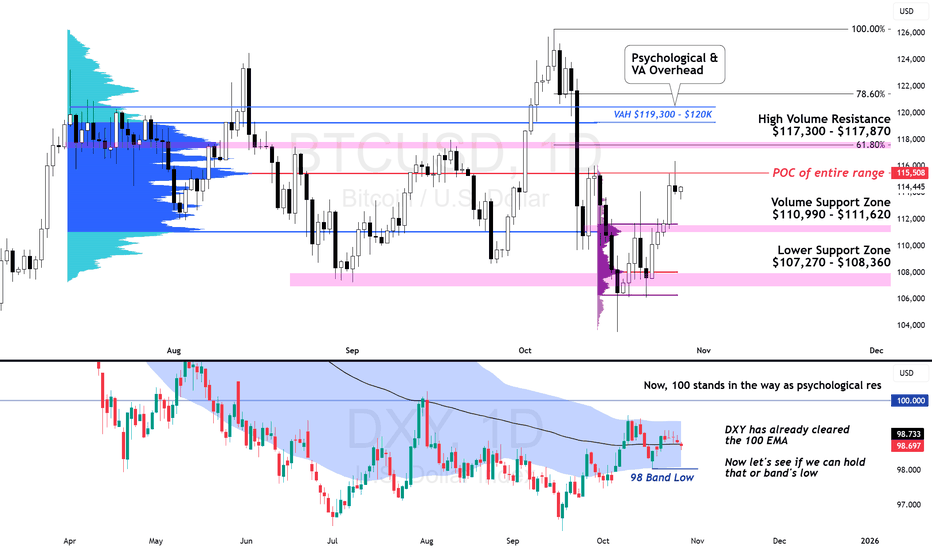
After dropping to $103K, Bitcoin has made a wonderful recovery to $115.5K; but we now have a large shooting star candle on the daily timeframe. So, is a retracement in play, or was this rally just a dead cat bounce? 👀 It's important to realise that Bitcoin has actually been rejected by a key level - the Point of Control (~$115.5K), the heaviest volume area of the entire range since tagging $120K. A close above this could invite another test into $117K–$120K , but that zone remains packed with high-volume resistance (at 61.8 fib) and the Value Area High overhead. On the other hand, the Dollar Index (DXY) has cleared its 100-day EMA and is now testing the psychological 100 level. If the dollar holds that breakout, BTC may struggle to sustain above the POC. But if DXY fades back under 98.7, it could give crypto some breathing room toward the $120K zone. Key Levels: BTC Resistance: $117.3K–$120K BTC Support: $111K / $108K DXY Resistance: 100.00 DXY Support: 98.7 🎯 Bias: Neutral-to-bearish until BTC breaks and holds above $120K or DXY confirms rejection from 100.
Alchemy Markets
اصلاحات طلا: موج 4 در راه است! آیا این اصلاح است یا آغاز سقوط؟
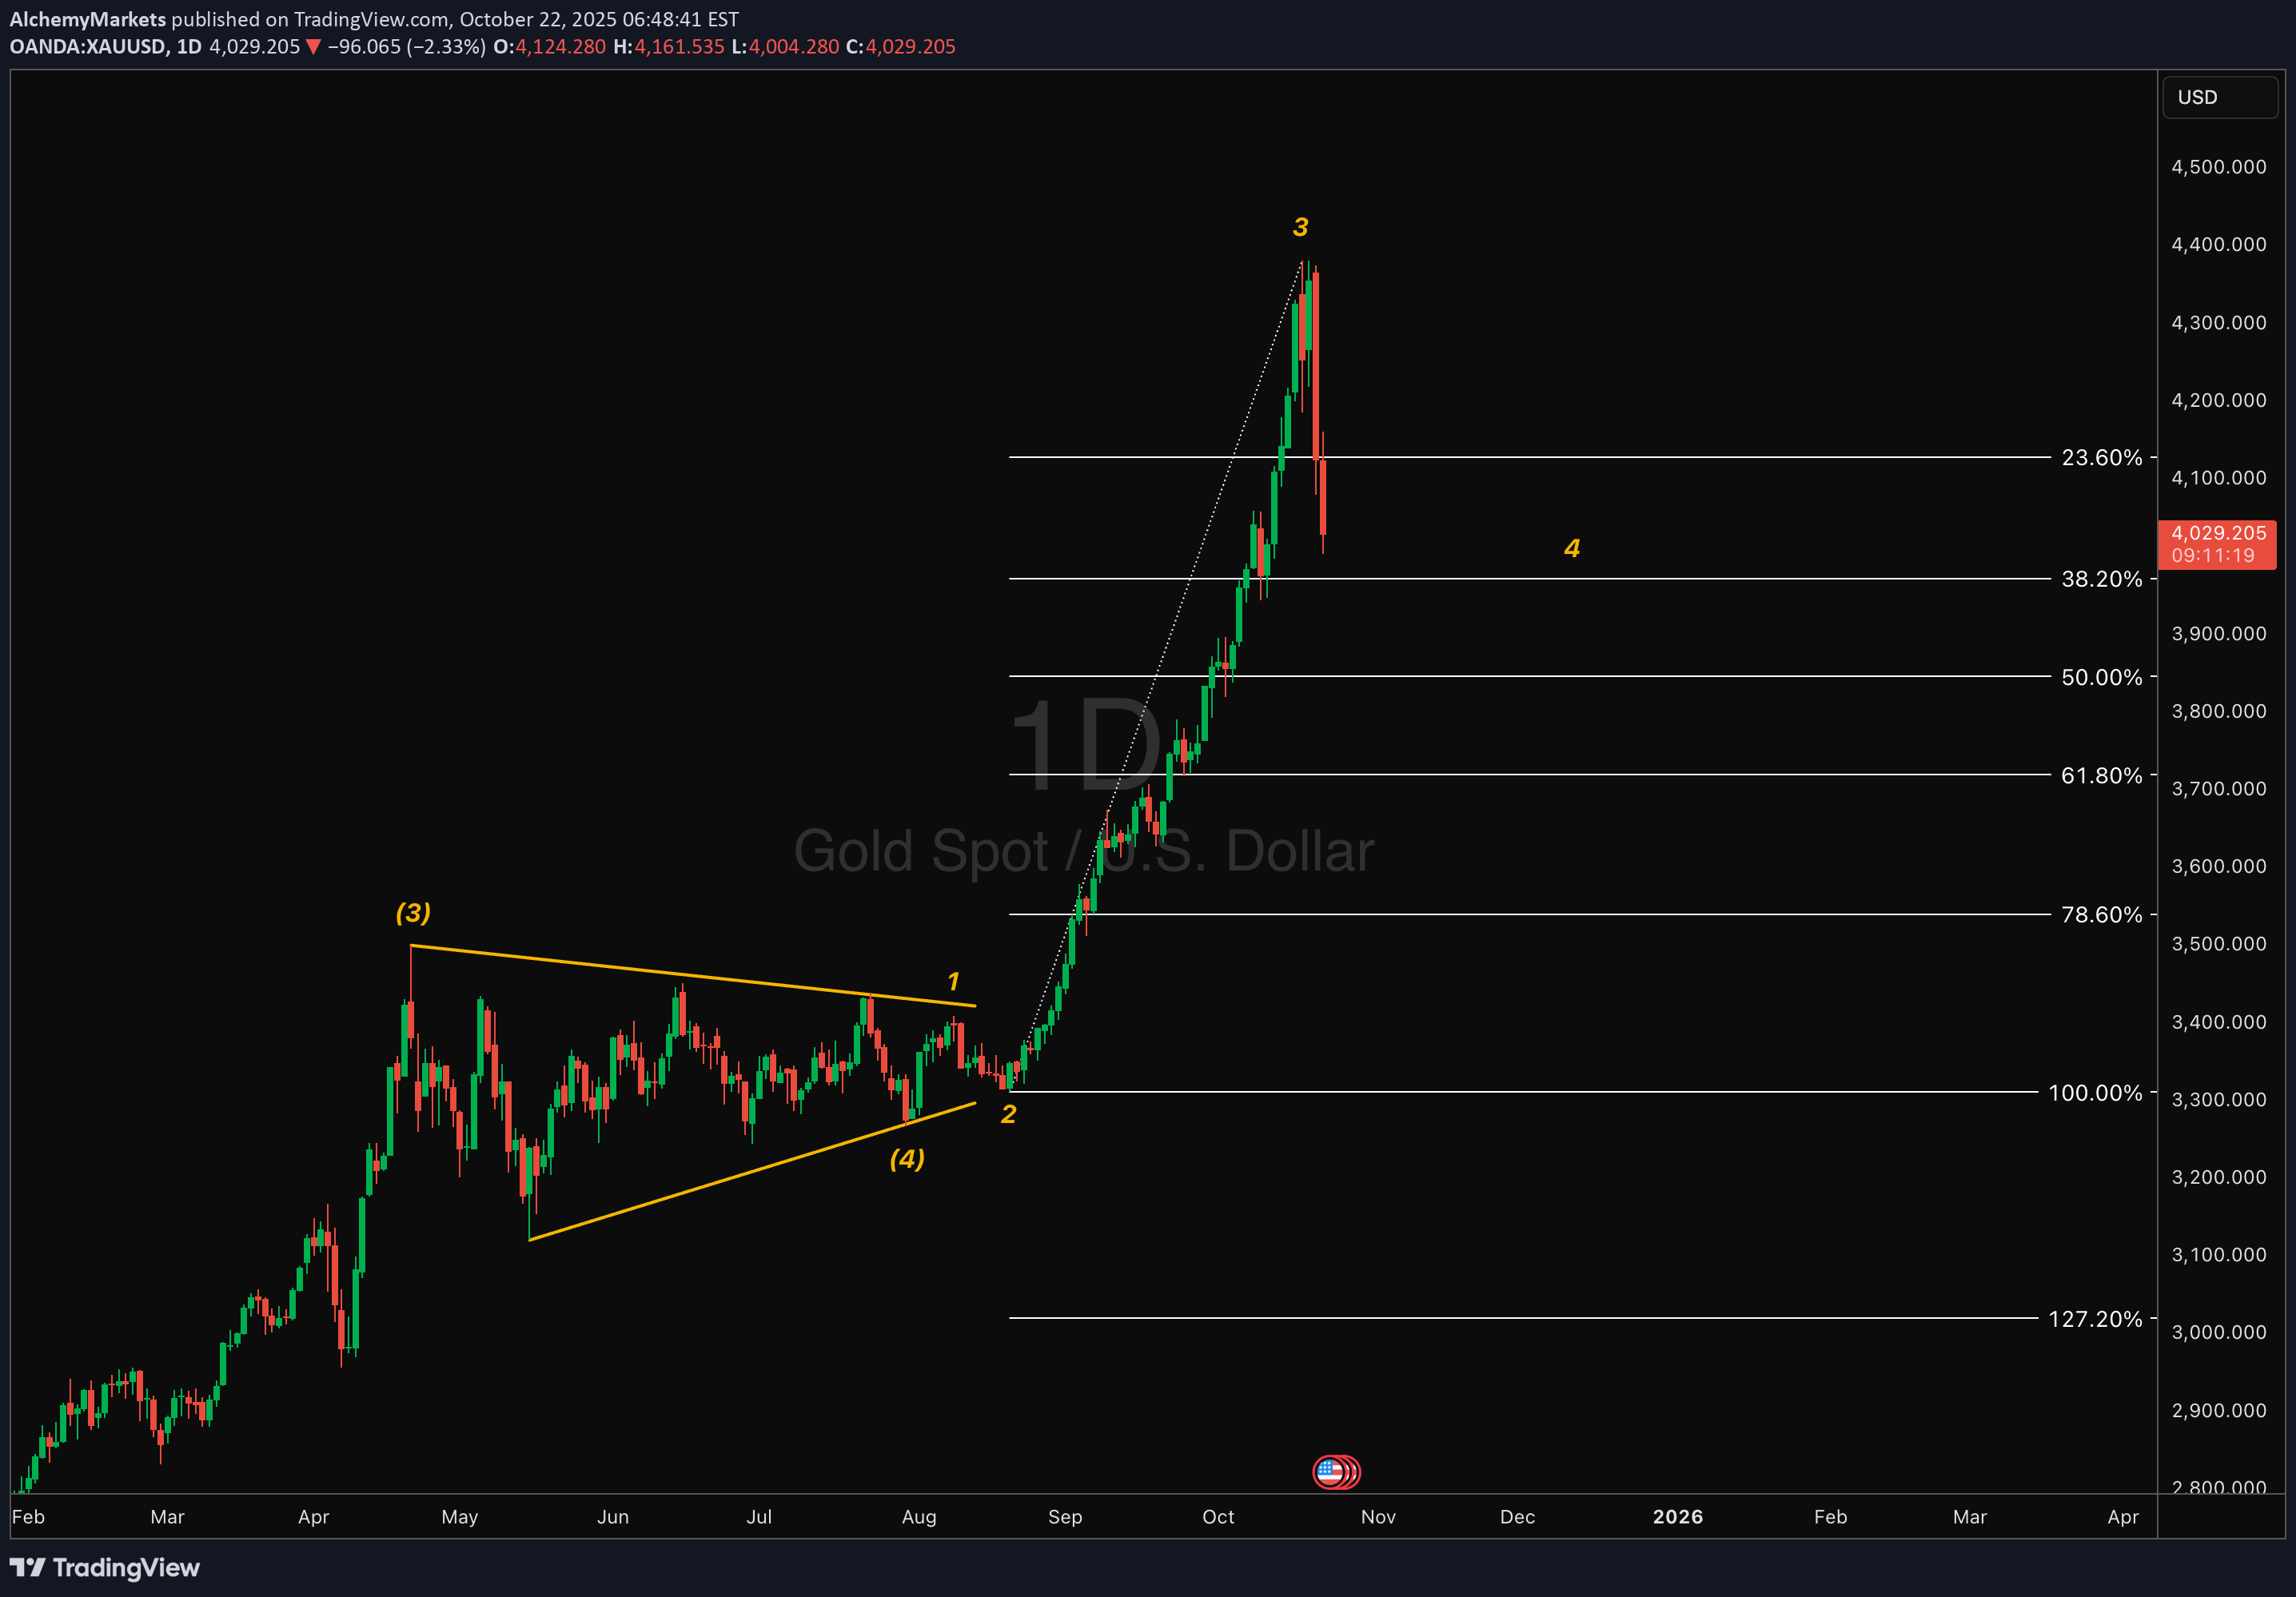
Gold’s surge to fresh highs is now unwinding into what looks like a textbook wave 4 correction. The move has traders panicking over desks — but beneath the noise, this is a repricing of real yields, not necessarily a structural top. Technical Lens: After a vertical wave 3 extension, spot gold has now pulled back toward the 23.6–38.2% retracement zone, a typical digestion phase before trend resumption. Structurally, the broader sequence still tracks as a 5-wave advance from the August breakout, implying this phase could be consolidation rather than reversal. Scenarios: If inflation undershoots expectations and real yields rise, gold could remain capped within this corrective band as investors rotate toward yield-bearing assets. If inflation proves sticky or the pace of disinflation slows, real yields compress again — an environment that continues to justify gold being “at these levels” or even pushing higher as the market re-prices duration risk. Catalysts: Upcoming US CPI inflation data, Treasury auctions, and real yield spreads (TIPS vs. nominal) will shape the next leg. Takeaway: This looks like wave 4 digestion — not capitulation. Unless inflation truly undershoots, gold’s macro foundation remains intact.
Alchemy Markets
گزارش مالی تسلا امشب: آیا دوران رشد ایلان ماسک زیر فشار است؟
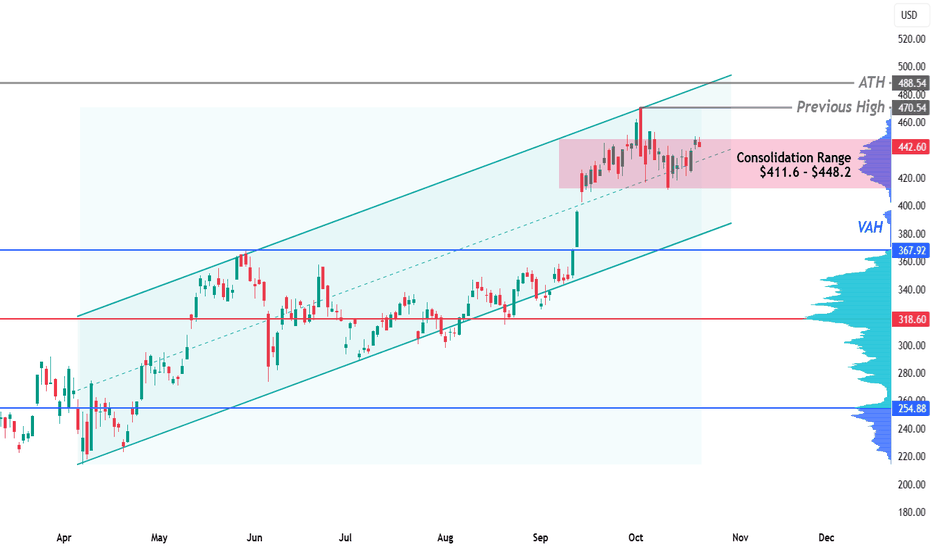
TSLA reports Q3 2025 earnings after the bell. Estimates: $0.55 EPS (+37.5% QoQ) and $26.46 B revenue (+18%). Strong on paper — but the real story will come from forward guidance. What’s beneath the surface: Inventory is rising as production outpaces sales since Q4 2024. Annual revenue growth turned negative in Q2 2025. EBT has declined roughly 11% per quarter since Q3 2024. China’s rare-earth export limits tighten Tesla’s margins and favour BYD & NIO. Technical Outlook: TSLA remains range-bound between $411.6 – $448.2 (heavy volume zone). If price moves higher, watch $470.5 (previous high) and $488.5 (ATH). If it dips, $367.9 (Value Area High) is the support to watch. Volatility is tightening — tonight’s tone on guidance could decide whether Tesla stays range-bound or starts a new phase.
Alchemy Markets
شاخص SPX زیر مقاومت کلیدی؛ آیا سقوط به کف کانال نزولی آغاز میشود؟
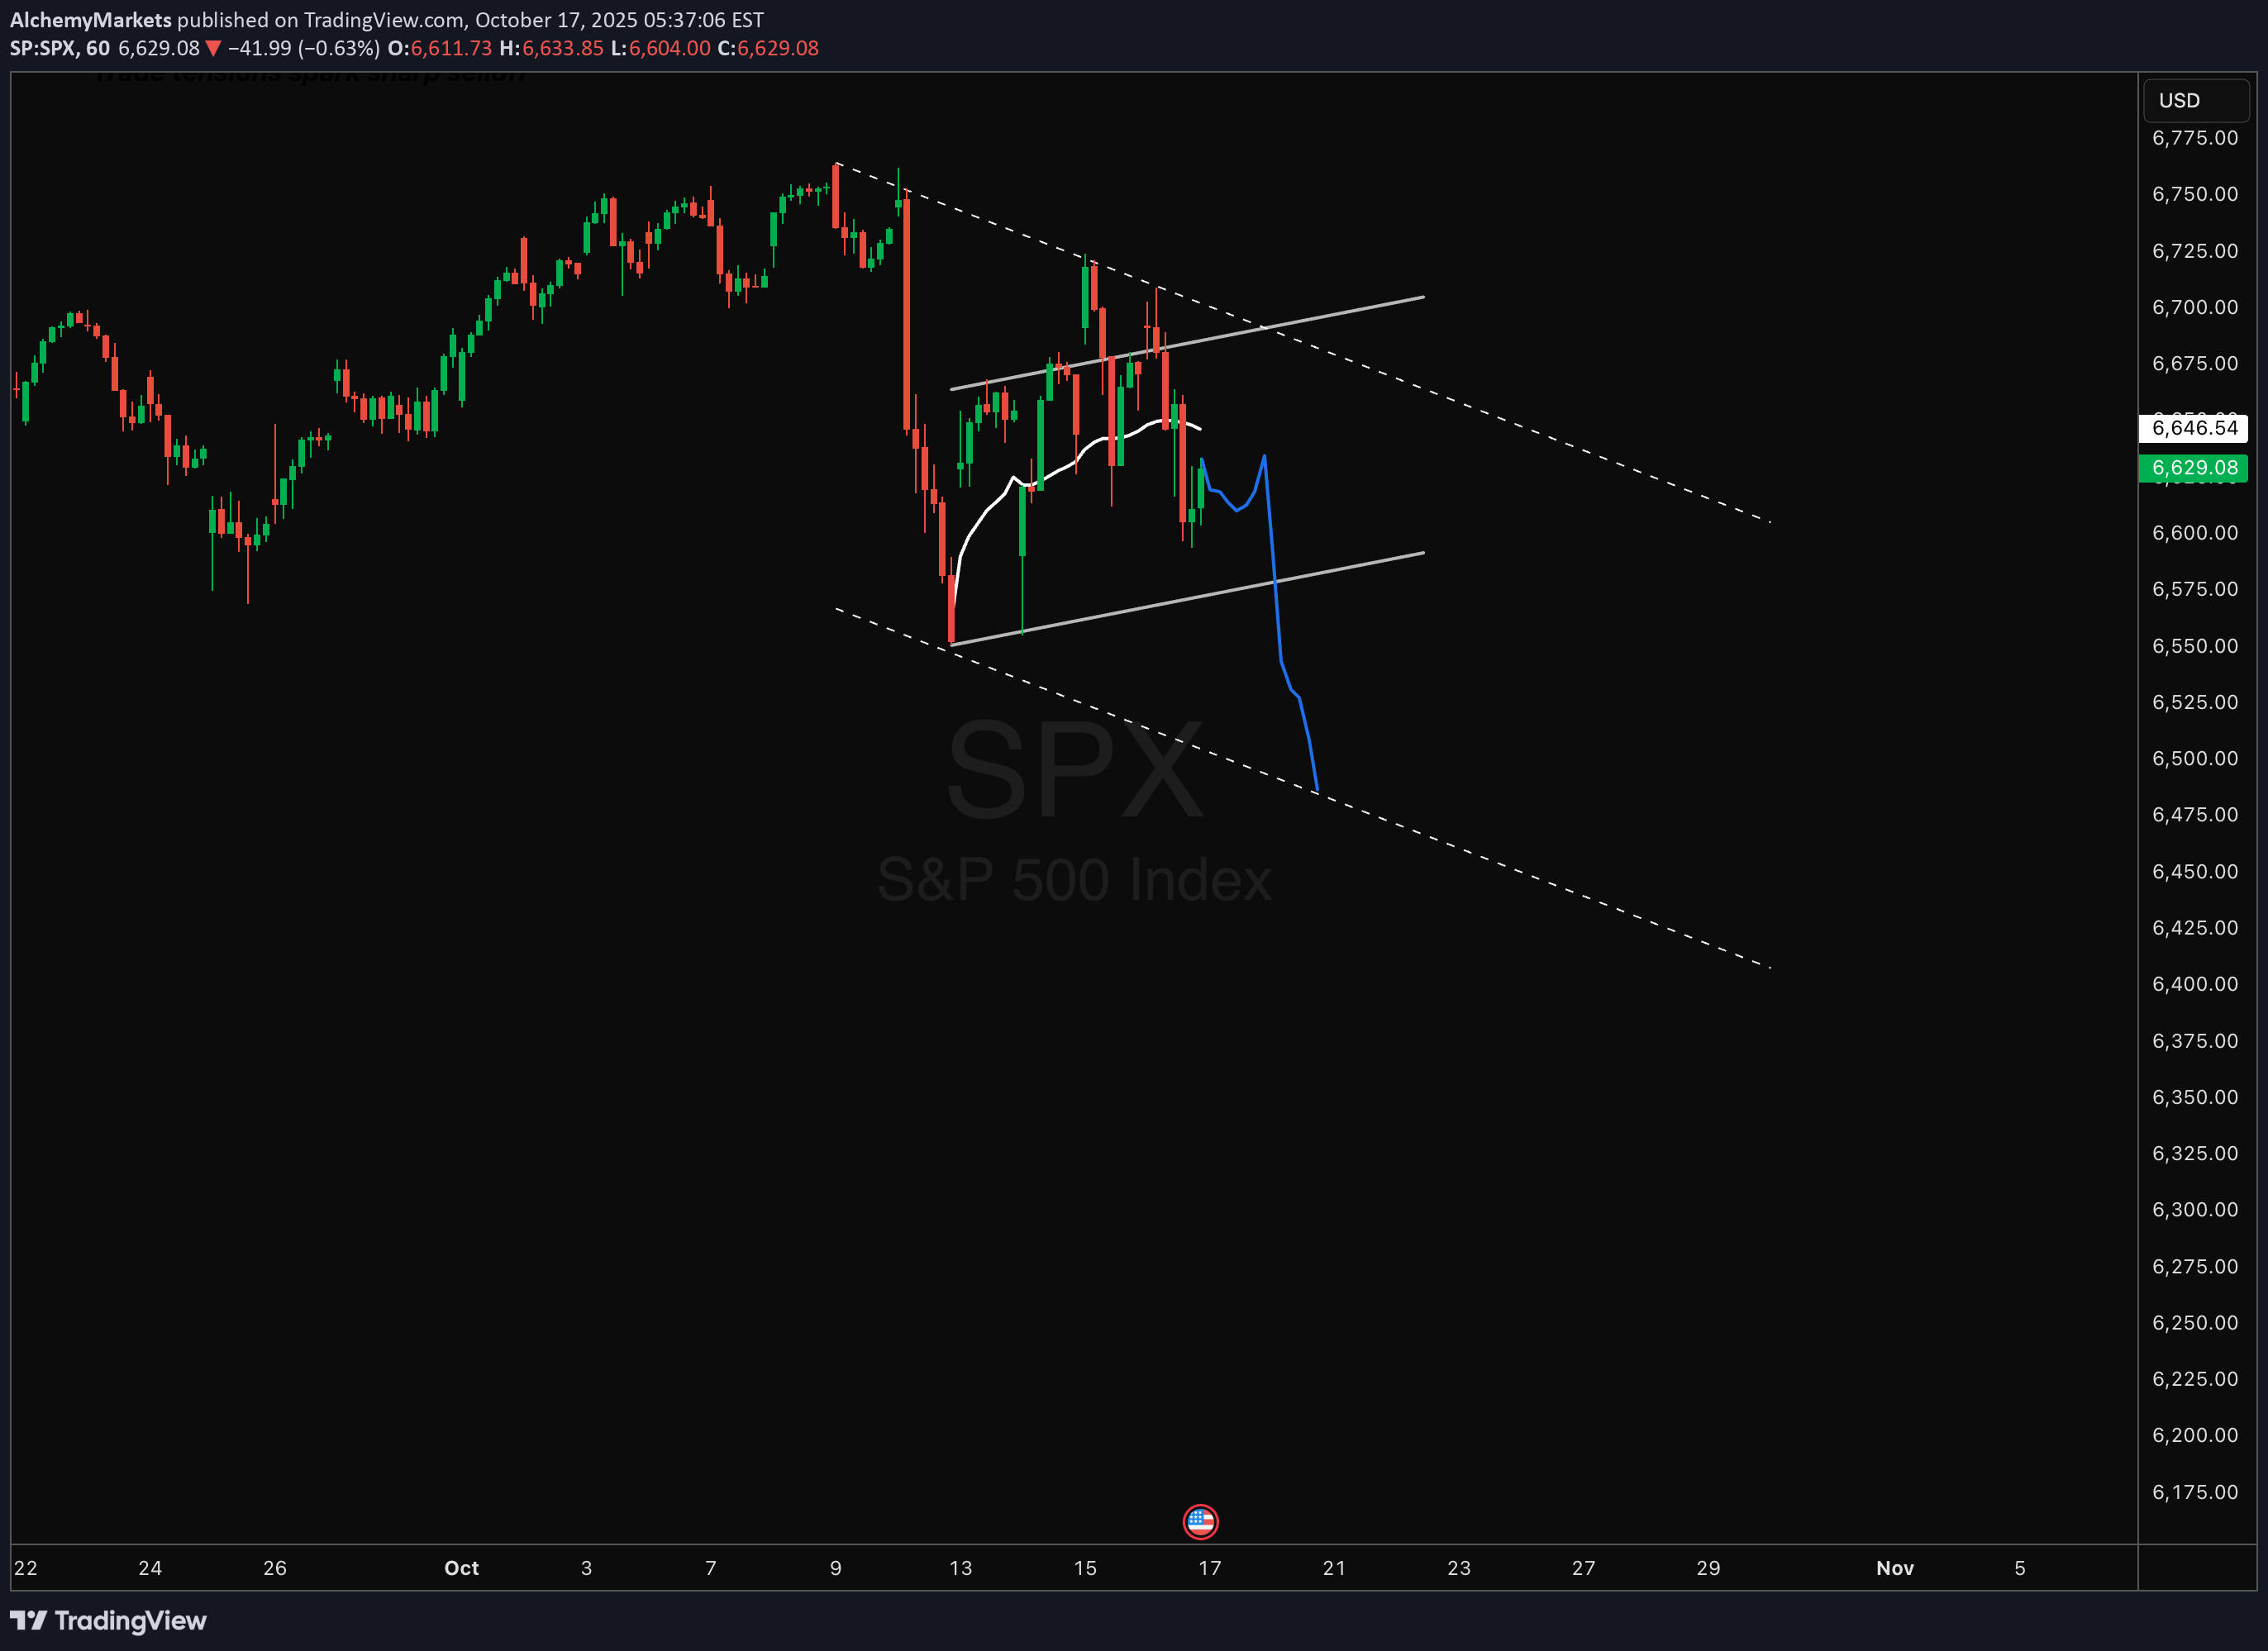
SPX remains capped below the anchored VWAP — sellers still dictating flow. If price can’t reclaim above, a move toward the lower bound of this descending channel remains in play. Watching for a reaction near channel support. Macro Backdrop: Sticky yields: 10Y holding near cycle highs keeps pressure on equity multiples. Fed tone: “Higher for longer” stance limits risk appetite and valuation expansion. Slowing growth: Softening ISM and consumer data hint at cooling demand. Earnings compression: Margin pressures building as labor and input costs stay elevated. Geopolitical overhangs: Middle East tensions and trade friction adding to risk-off tone.
Alchemy Markets
تله گاوی یا شروع جهش؟ خط حیاتی ۵۹۳ دلار برای QQQ کجاست؟
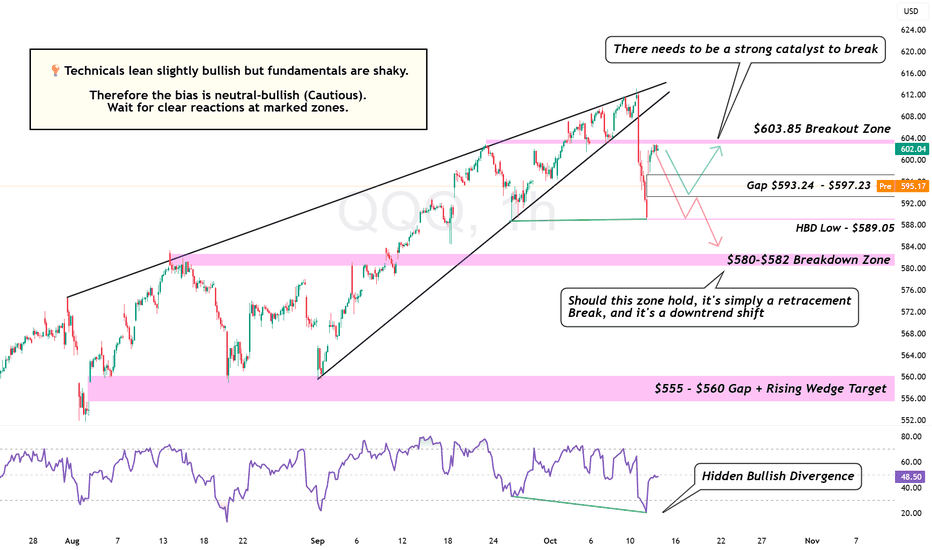
QQQ is gapping down right into a massive technical test: the $593 Gap Support. This is not a regular drop. Our chart is showing a rare conflict: Bullish Setup: A Hidden Bullish Divergence (HBD) is screaming for a bounce. Bearish Risk: A loss of the low could trigger a rapid descent to the $580 Zone. The bias right now is neutral-bullish — cautious optimism. If bulls hold the gap, expect a short-term rebound toward $603–$605 where sellers will likely re-emerge. But if $593 gives way, this turns into a full-on correction targeting $582 → $560, completing the wedge breakdown target. This is the moment of truth. Bulls need to defend $593 or risk a complete sentiment shift. Key Levels: $603.85 — Breakout Zone $593.24–$597.23 — Gap Support $589.05 — Structural Floor $580–$582 — Breakdown Zone $555–$560 — Rising Wedge Target Bias: 🟡 Neutral-Bullish (Cautious) Timeframe: 1H Indicators: RSI Hidden Bullish Divergence, Rising Wedge Breakdown
Disclaimer
Any content and materials included in Sahmeto's website and official communication channels are a compilation of personal opinions and analyses and are not binding. They do not constitute any recommendation for buying, selling, entering or exiting the stock market and cryptocurrency market. Also, all news and analyses included in the website and channels are merely republished information from official and unofficial domestic and foreign sources, and it is obvious that users of the said content are responsible for following up and ensuring the authenticity and accuracy of the materials. Therefore, while disclaiming responsibility, it is declared that the responsibility for any decision-making, action, and potential profit and loss in the capital market and cryptocurrency market lies with the trader.