Technical analysis by Alchemy Markets about Symbol BTC: Sell recommendation (11/4/2025)
Alchemy Markets
سقوط بیت کوین: اصلاح سالم یا آغاز بازار خرسی؟ نکتهای که همه از دست میدهند!
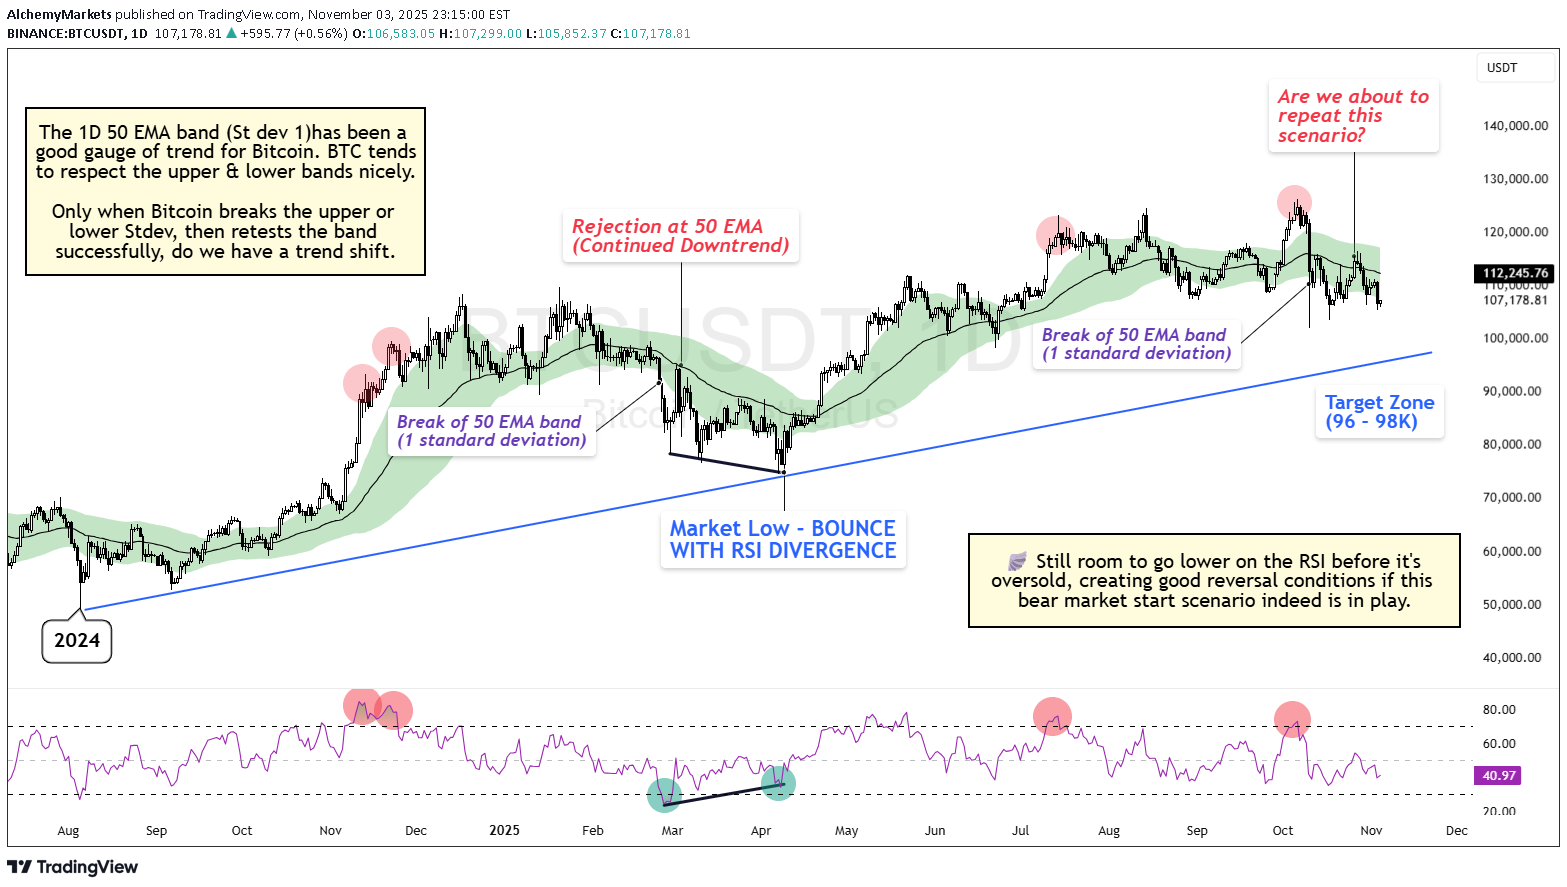
Every time Bitcoin dips, the same old debate comes up: is this the start of a bear market or just a healthy correction? Here's a scenario that MAY play out, and is one that MOST retail traders aren’t watching. This isn’t a prediction, but a rather a keen observation. Right now, the charts are giving mixed signals, and that’s exactly why it deserves a closer look. 🔹 What’s Really Happening After three pushes into the highs, Bitcoin’s daily chart is showing a clear bearish RSI divergence. That usually hints at fading momentum. At the same time, price fell below the 50 EMA band (1 standard deviation) and got rejected right at the EMA line. This setup looks almost identical to what happened in May, and back then it led to a solid mid-teens pullback before the trend recovered. So far, this move from $115K down to the $96K–$98K zone is roughly a 15–17% correction. That’s painful, but still normal inside a bullish cycle. To call it a bear market, BTC would need to break below that 2024 trendline and print lower lows. That has not happened. 🧭 Why It Matters This is where traders often get it wrong. Corrections like this are meant to reset sentiment, clear leverage, and test conviction. They are not always trend reversals. Sometimes, they are the fuel for the next move up. If BTC reaches that 2024 trendline with RSI oversold and a bullish divergence forming, that could mark the next major long setup to watch. 📊 Key Zones Resistance: 50 EMA band (~$115K) Support: $96K–$98K Trigger to watch: RSI divergence + trendline retest Until Bitcoin reclaims the 50 EMA zone, the near-term bias stays cautious. But this still looks like a healthy flush, not a bear turn. 🪽 Stay sharp, trade smart, and let the charts guide you, not your emotions.