
Actualjustice
@t_Actualjustice

What symbols does the trader recommend buying?
Purchase History
پیام های تریدر
Filter
Actualjustice
Bitcoin Market Outlook (BUY BITCOIN 21 DECEMBER 2025)
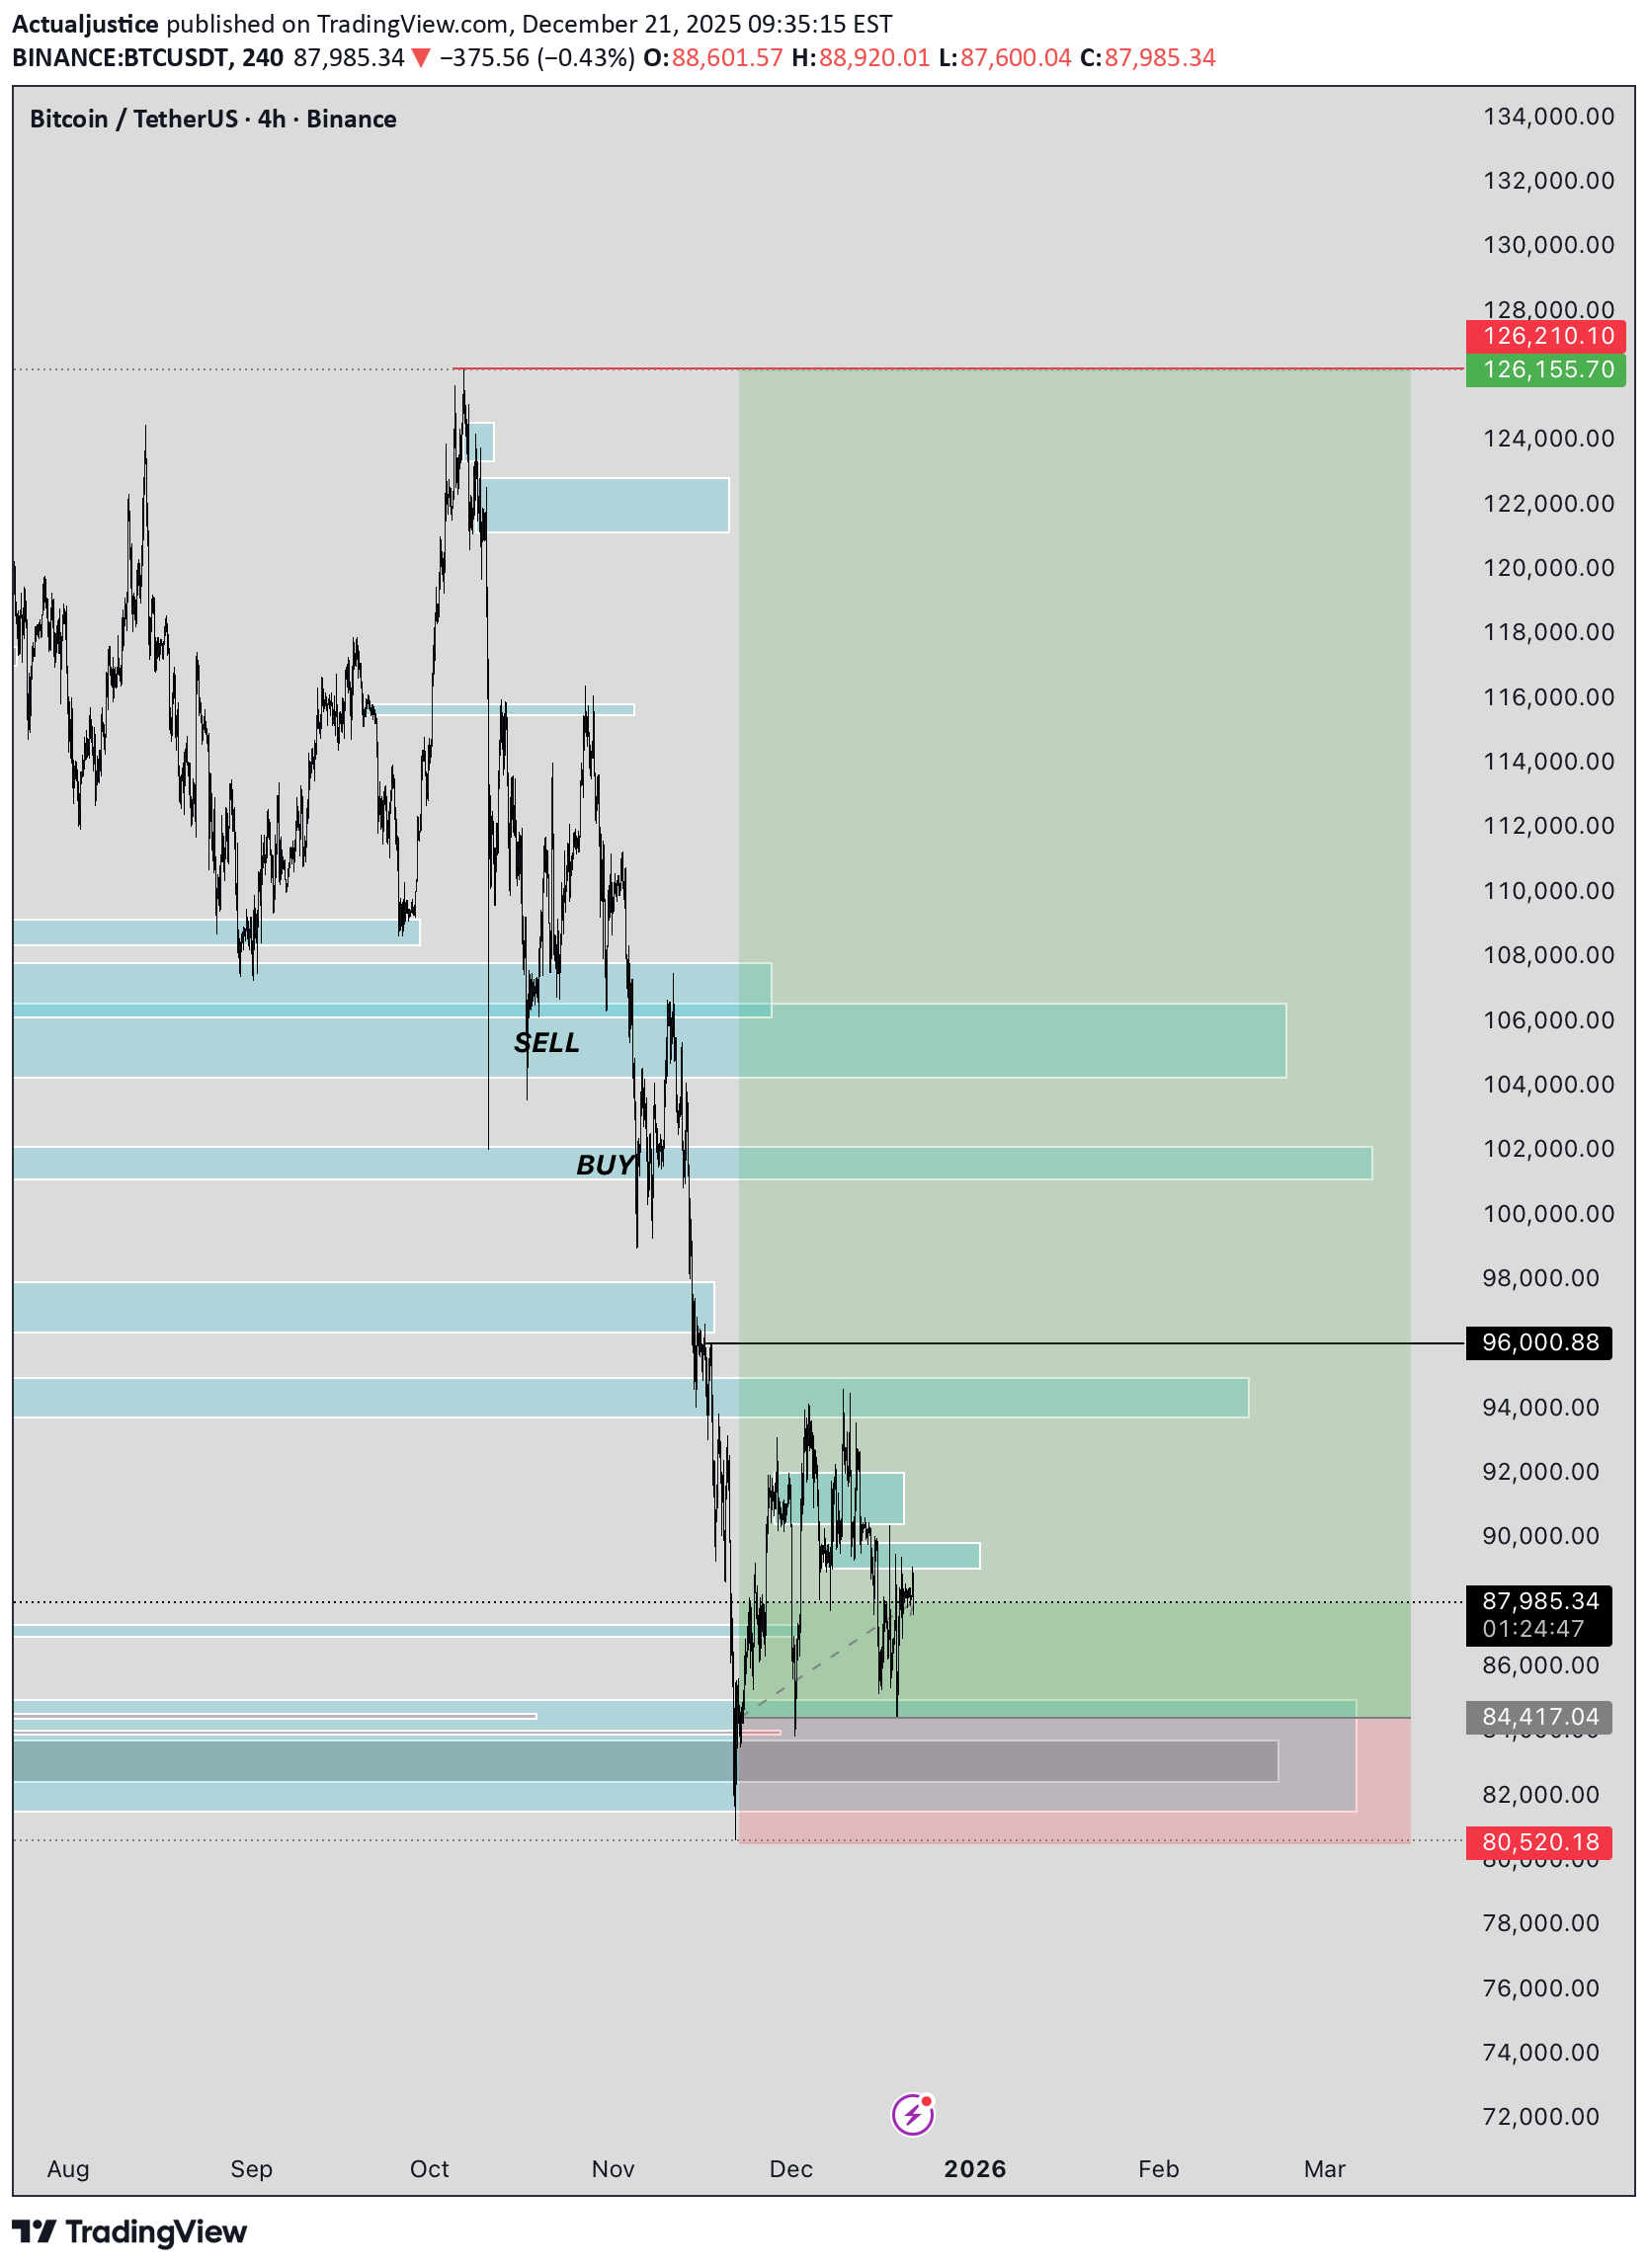
Bitcoin continues to show strong bullish intent as price holds above key higher-timeframe support and maintains a clear structure of higher highs and higher lows. Recent consolidation appears to be healthy, suggesting accumulation rather than distribution, with sellers failing to push price below critical demand zones. As long as BTC remains above support, the bias stays firmly bullish. A sustained hold and expansion from this range increases the probability of continuation toward the next liquidity pool and previous highs. Momentum favors the upside, and any shallow pullbacks into support are viewed as potential opportunities for continuation rather than signs of weakness. Invalidation is clear: a decisive break and close below major support would weaken the bullish case and shift focus toward deeper retracements. Until then, the trend remains intact, and Bitcoin looks positioned for another leg higher.
Actualjustice
BTCUSDT – Long Bias (Coming Week)
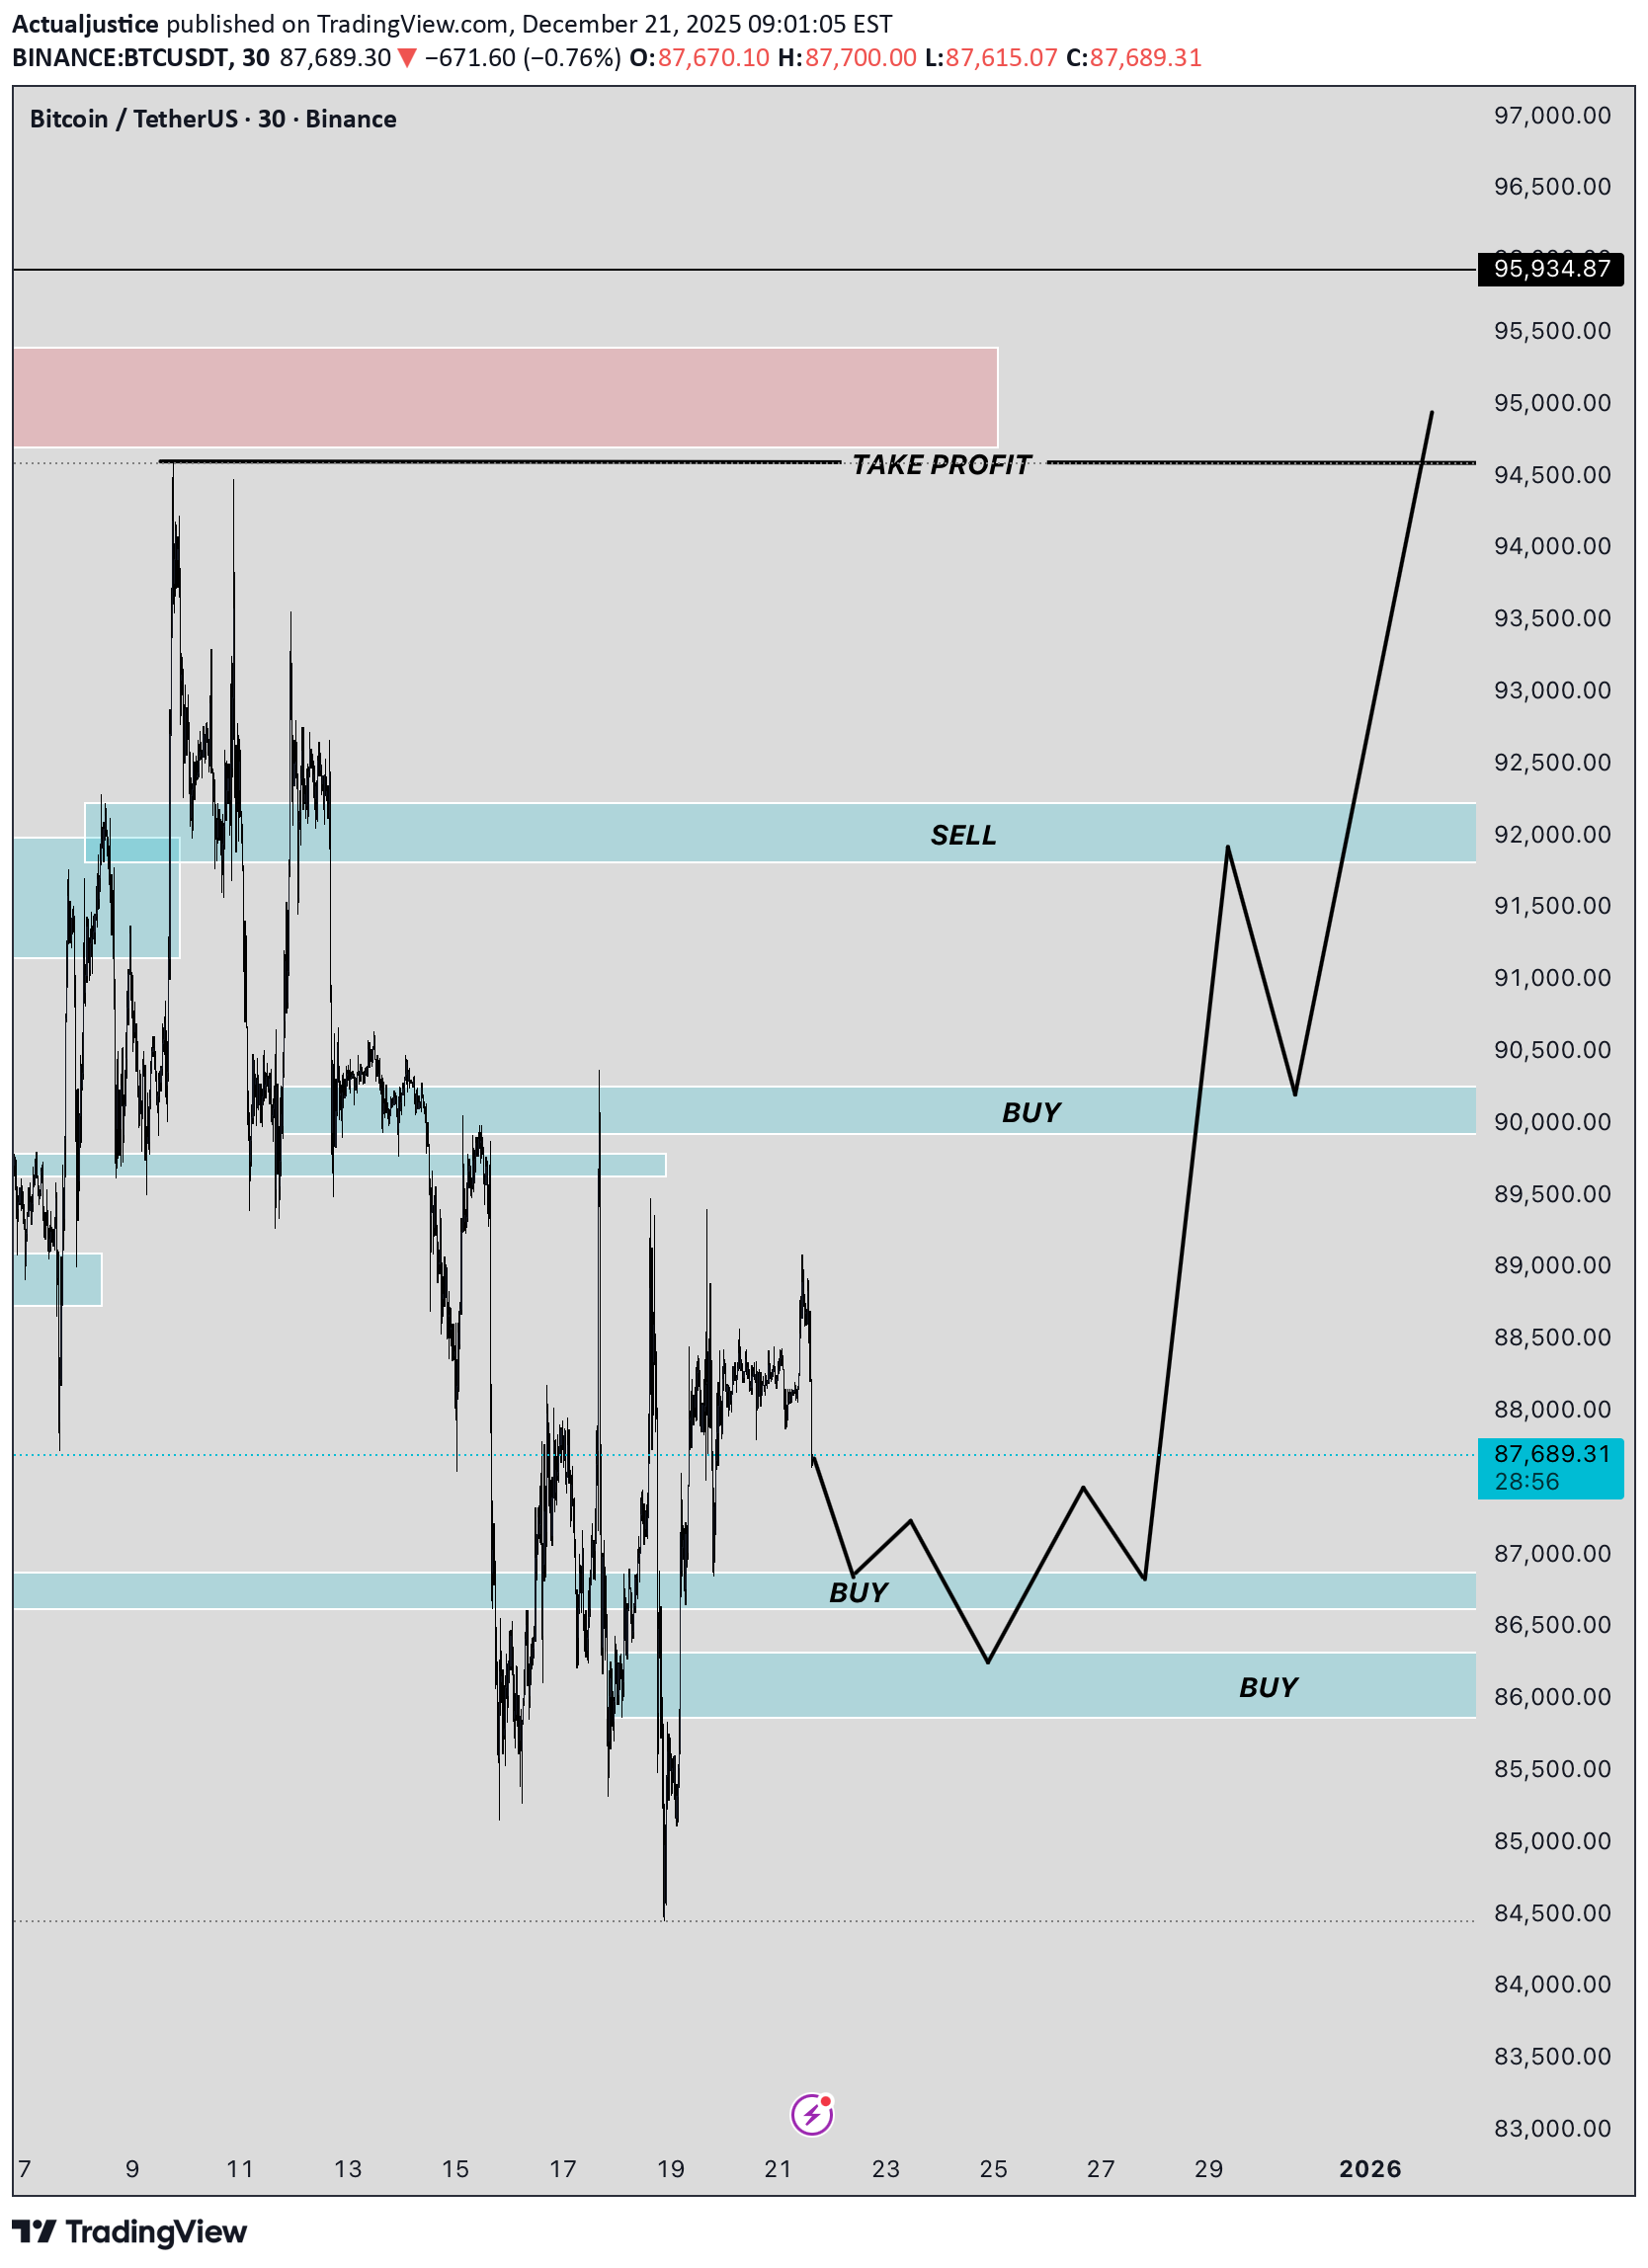
Bitcoin is currently trading within a discounted range following a corrective move, with price reacting around prior demand zones. I’m looking for long opportunities from the lower buy areas highlighted, where liquidity has been taken and market structure suggests a potential reversal. The expectation is for price to form a base and expand higher into the mid-range, with an initial move toward the sell zone and possible continuation into the upper liquidity and take-profit area. Trade Plan •Bias: Long •Entry Zone: Lower buy zones as marked •Stop Loss 1: 84,500 •Stop Loss 2: H4 swing low •Targets: Mid-range sell zone, then higher resistance / liquidity area Execution is preferred with lower-timeframe confirmation. A clean break and close below the H4 low would invalidate the long idea.
Actualjustice
XAUUSD | 1H | Market Structure Update
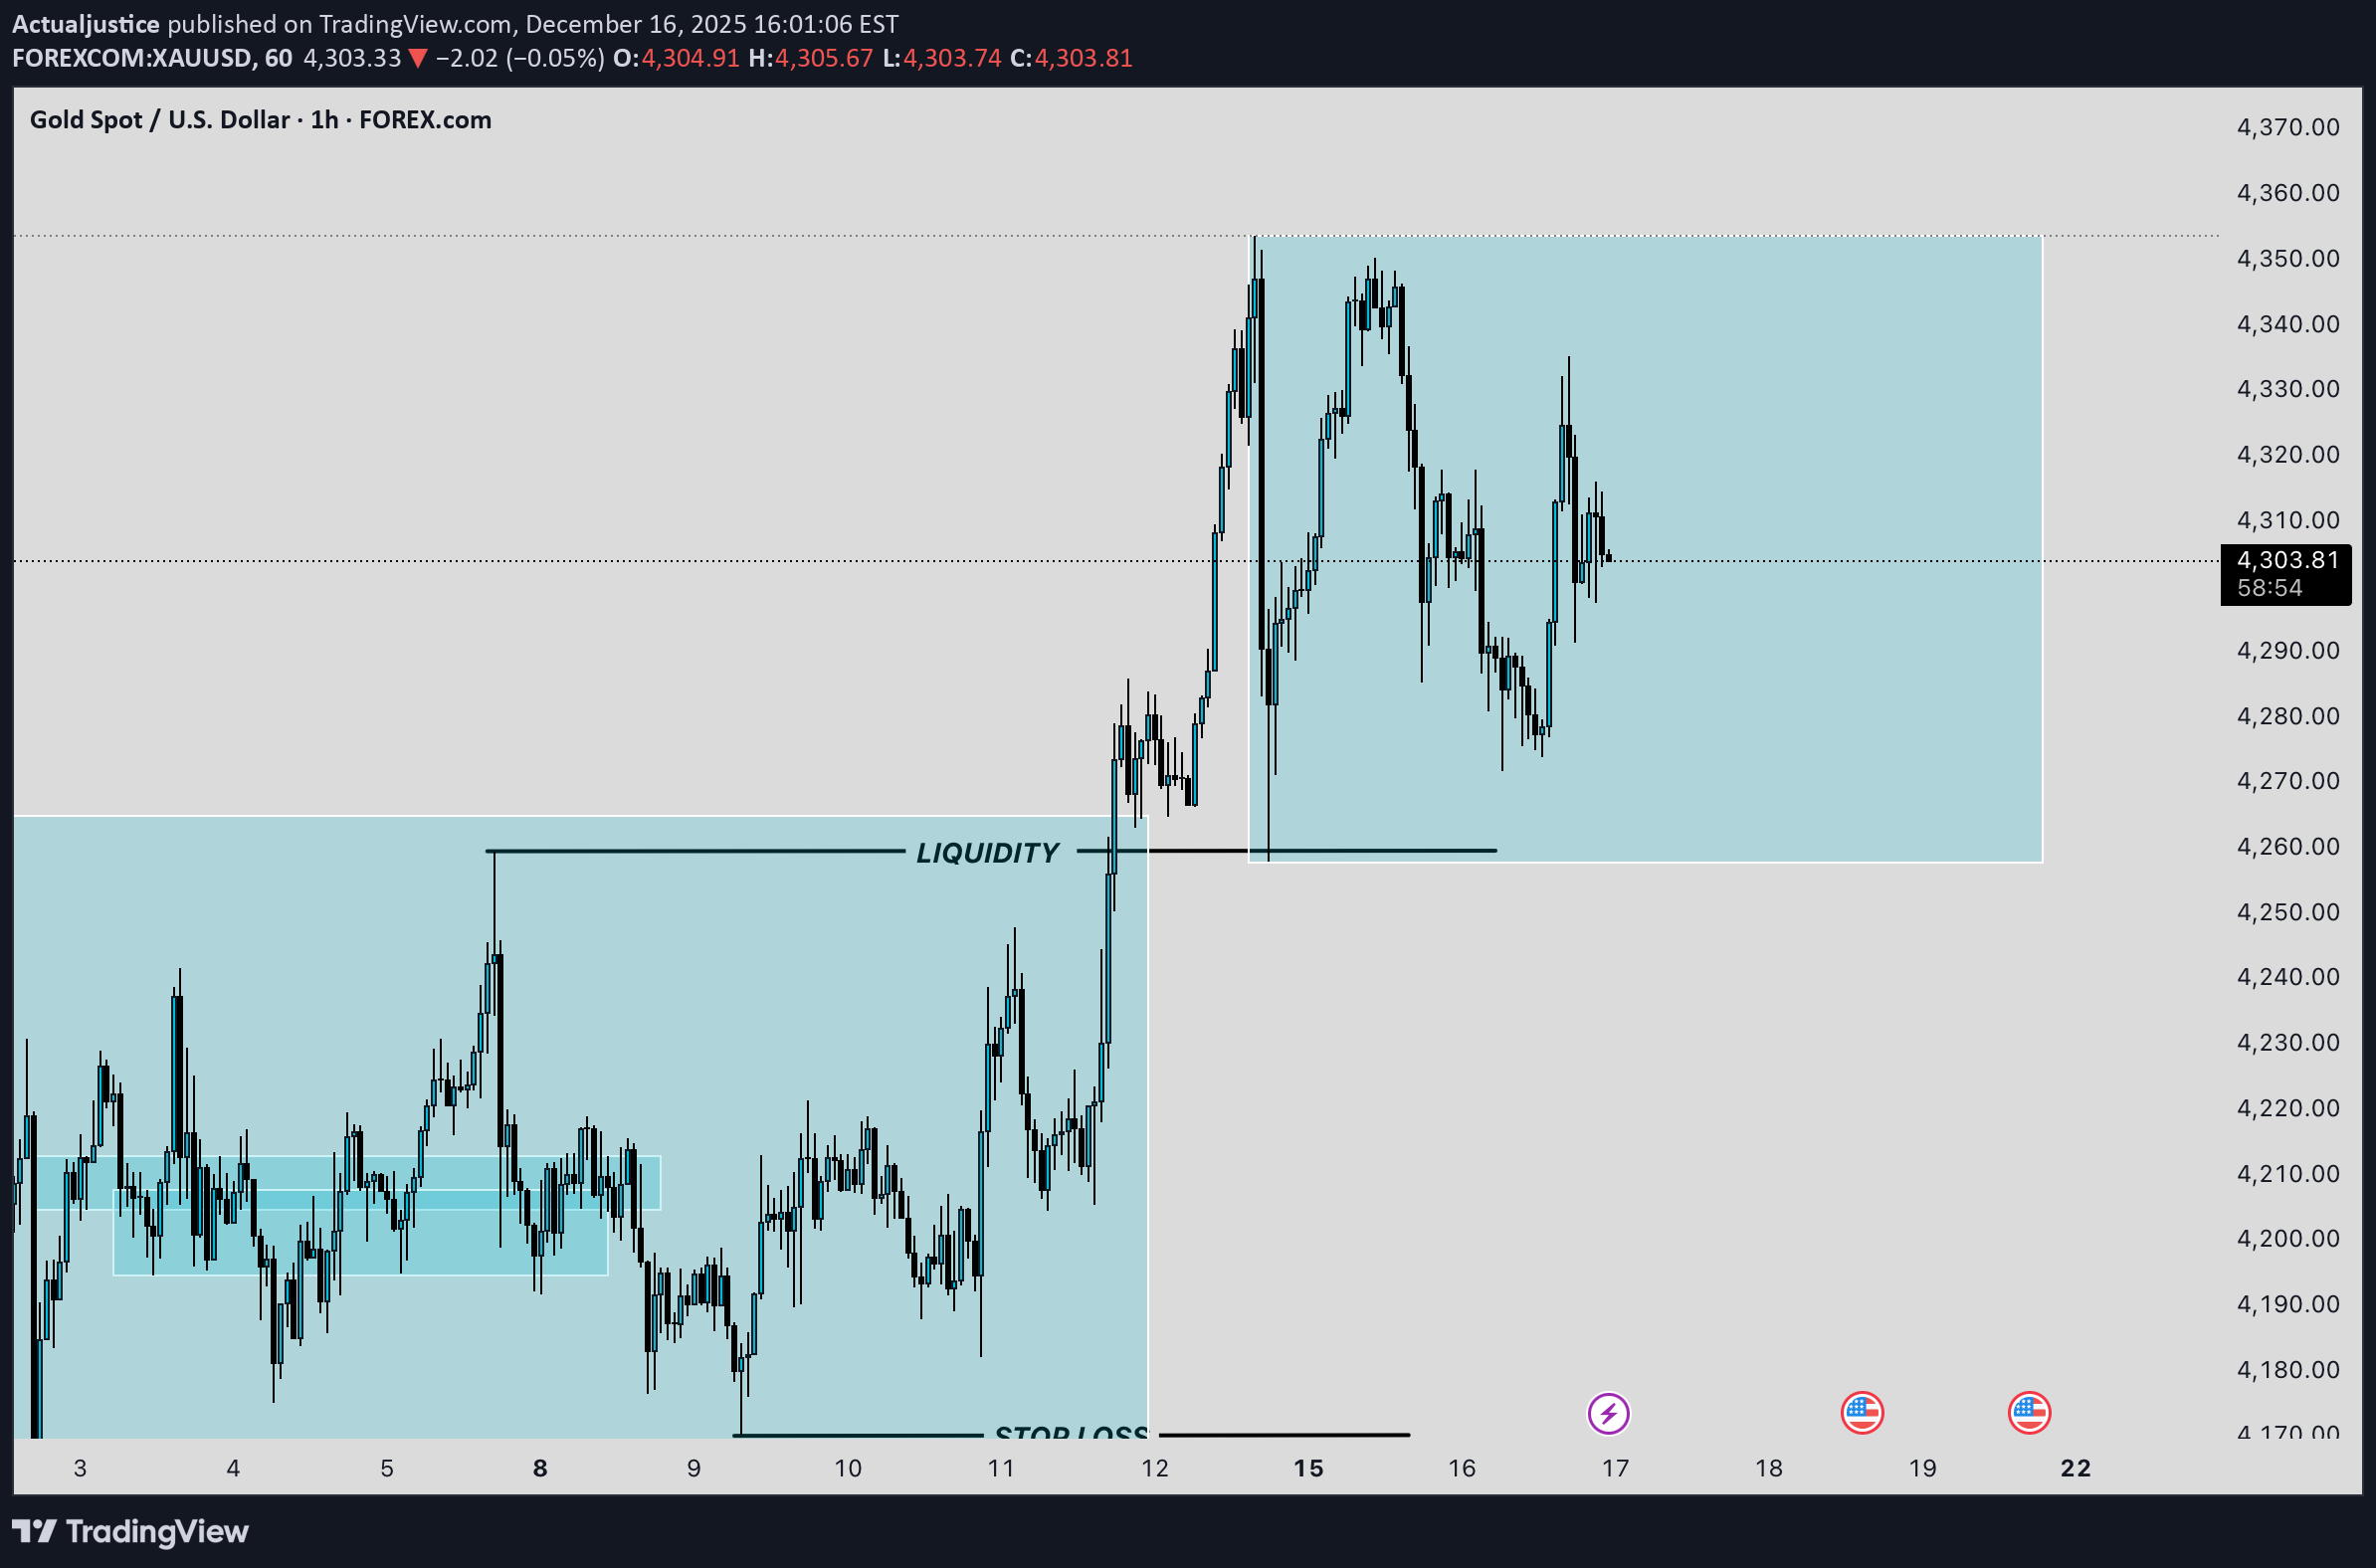
Gold remains in a high-timeframe bullish structure, but price is currently pausing within a key consolidation range after the impulsive move higher. This consolidation is forming just below the all-time high (ATH), suggesting the market is building orders rather than reversing. Price has already swept prior sell-side liquidity, and the current range appears to be a re-accumulation phase. As long as price holds above the previous breakout base, bullish continuation remains the higher-probability scenario. A clean breakout and close above the consolidation high is required to confirm strength and open the path toward a ATH expansion. Without that confirmation, price may continue ranging or perform a deeper retracement into demand before the next leg higher. Bias: Bullish continuation Confirmation: Strong close above consolidation resistance Target: All-Time High and potential price discovery Invalidation: Sustained acceptance below the consolidation support Patience is key here — let the market show its hand before committing.
Actualjustice
سقوط ناگهانی بیت کوین: آیا خریداران تسلیم شدند؟
Price has broken a major low signaling weak strength for buyers
Actualjustice
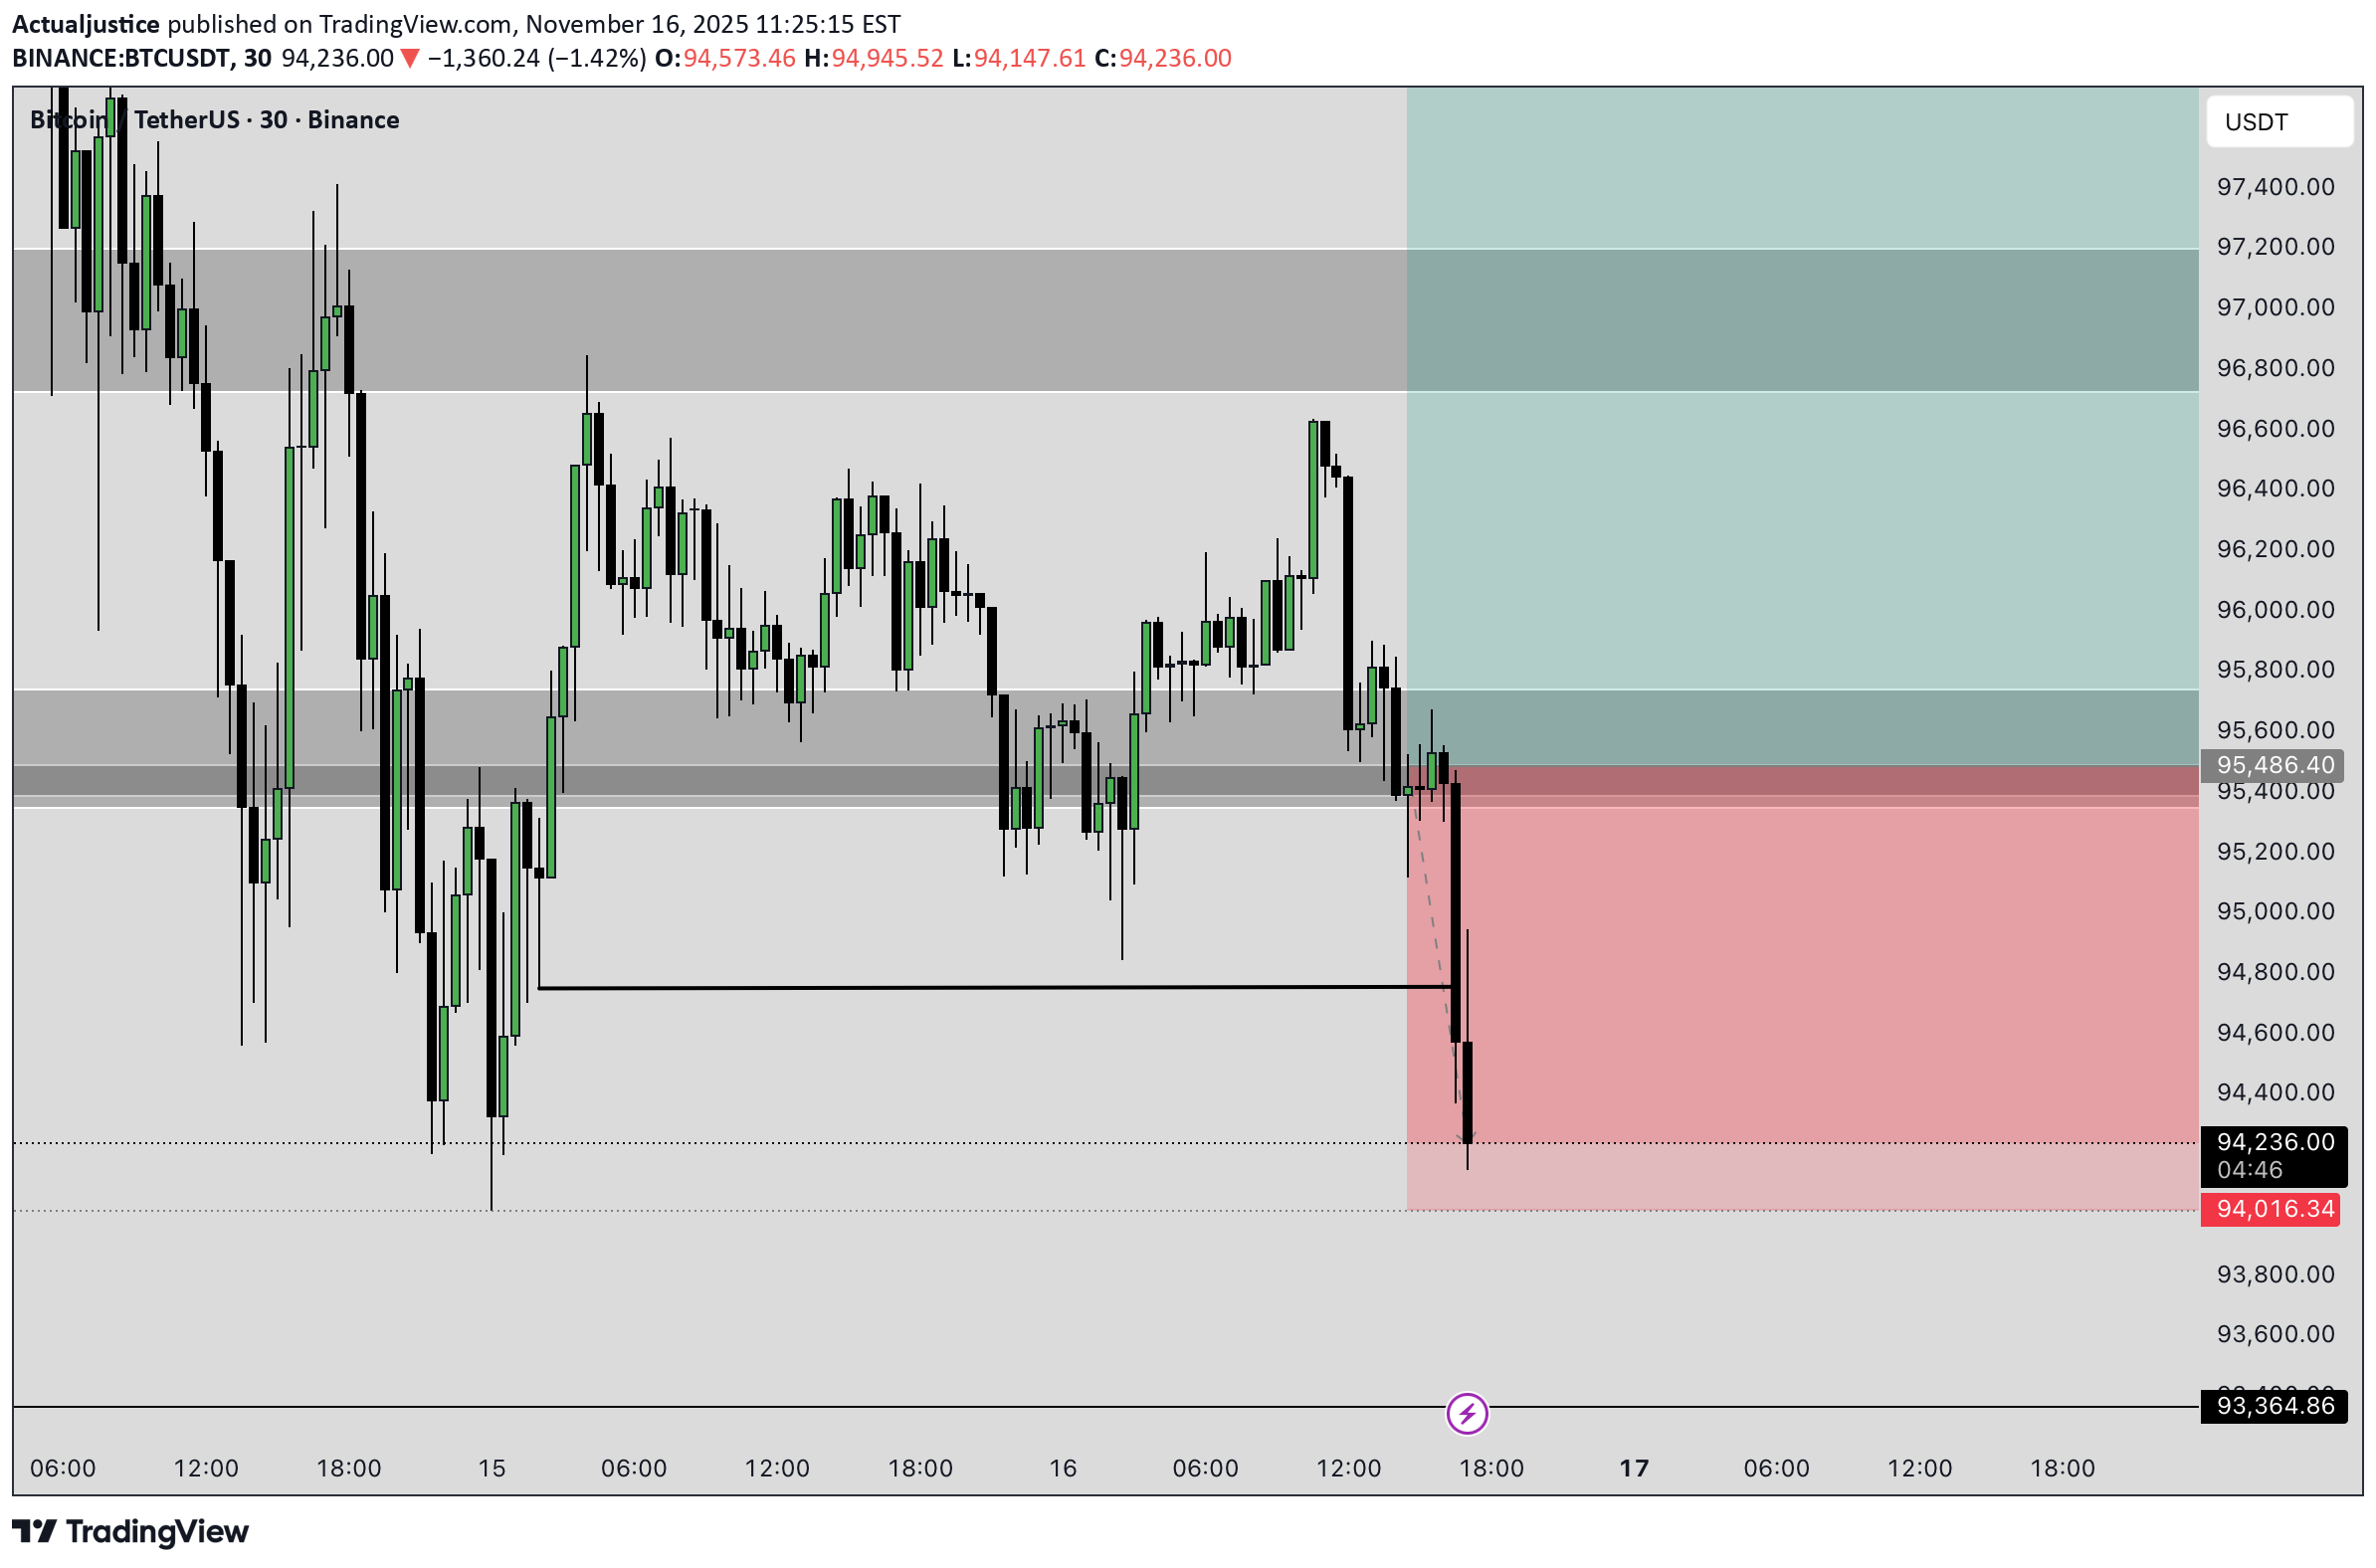
تحلیل بیت کوین: آیا BTC به سقف ۱۰۷ هزار دلار میرسد؟ (سیگنال خرید قوی)
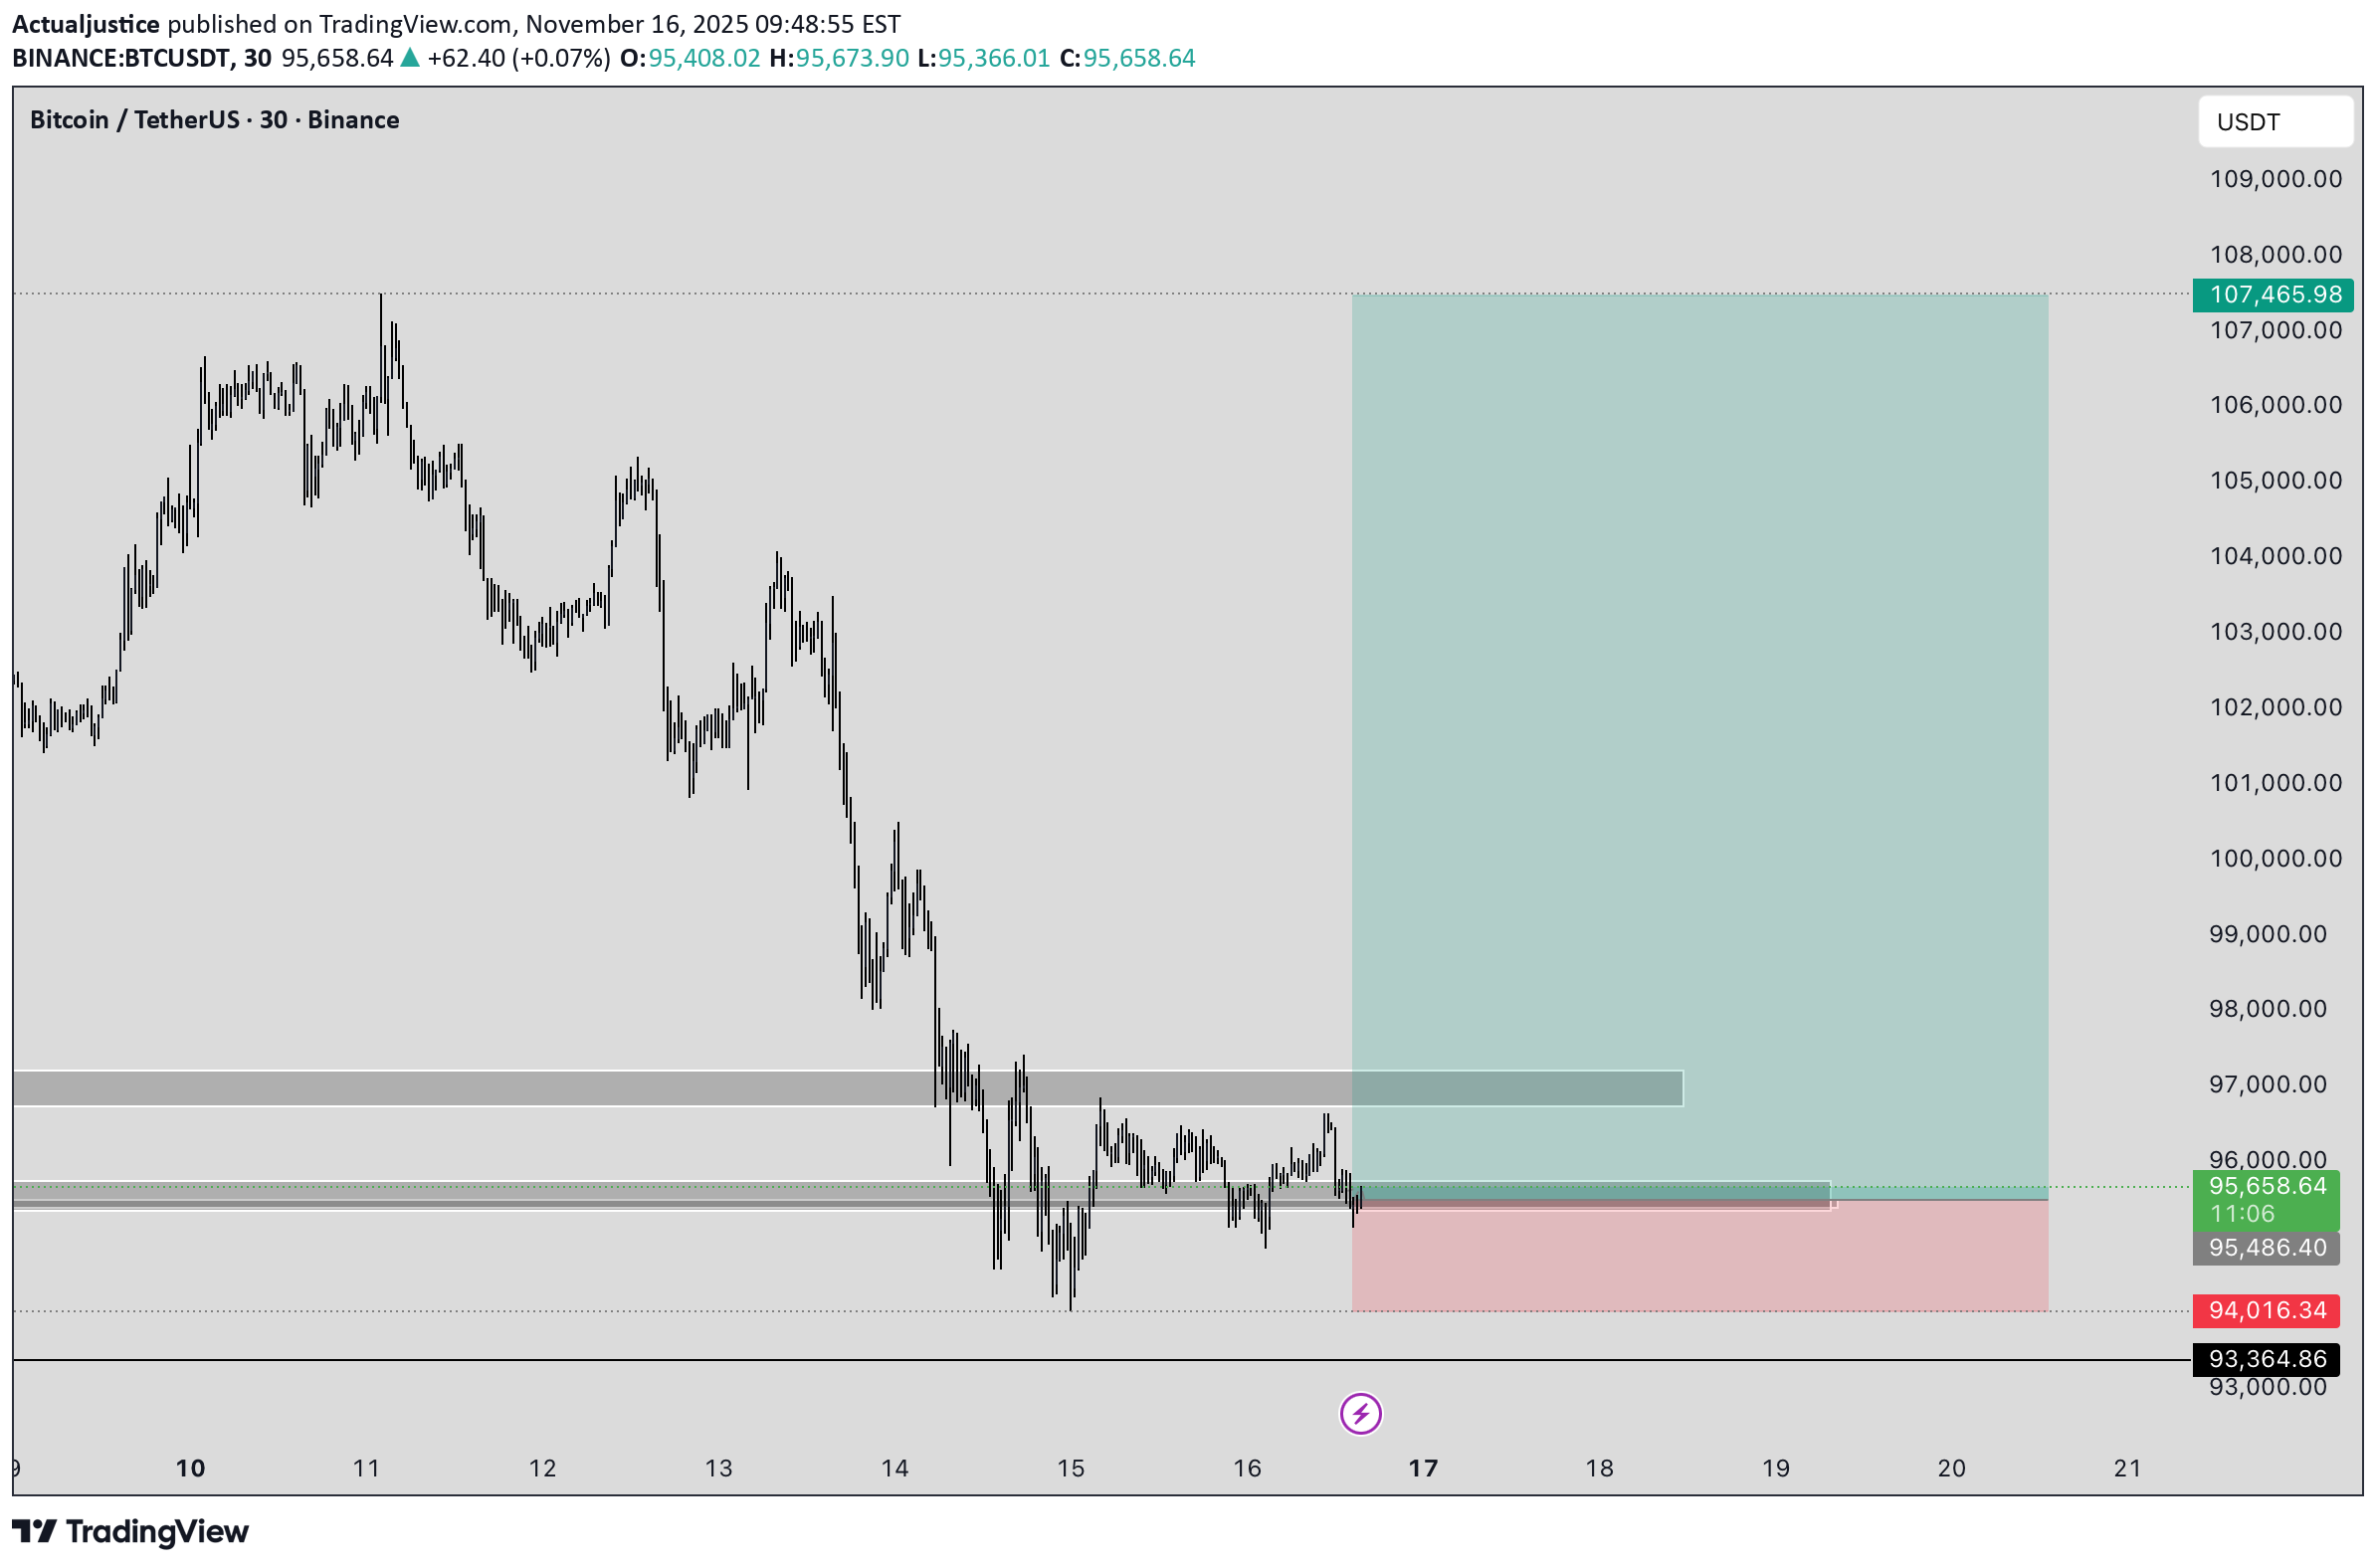
Price is currently trading inside a key demand zone where buyers previously showed strong interest. After the recent sell-off, BTC has stabilized around this support area and is now showing signs of accumulation, suggesting a potential reversal to the upside. From my current entry zone, I expect Bitcoin to push higher and target the previous major high around 107,465.98, which aligns with the bullish zone highlighted on the chart. This area represents the next significant liquidity pocket where price may look to tap before any deeper correction. My stop loss is set at 94,016.34, positioned safely below the support zone to protect the trade in case of unexpected downside continuation. As long as price holds above this level and maintains structure, the bullish outlook remains valid. Overall, I’m looking for BTC to build momentum from this zone and drive upward toward the high, in line with the broader market structure shown on the chart.
Actualjustice
پیشبینی طلا (XAU/USD): آیا قیمت از محدوده 4058 دلار به سمت قلههای جدید صعود میکند؟
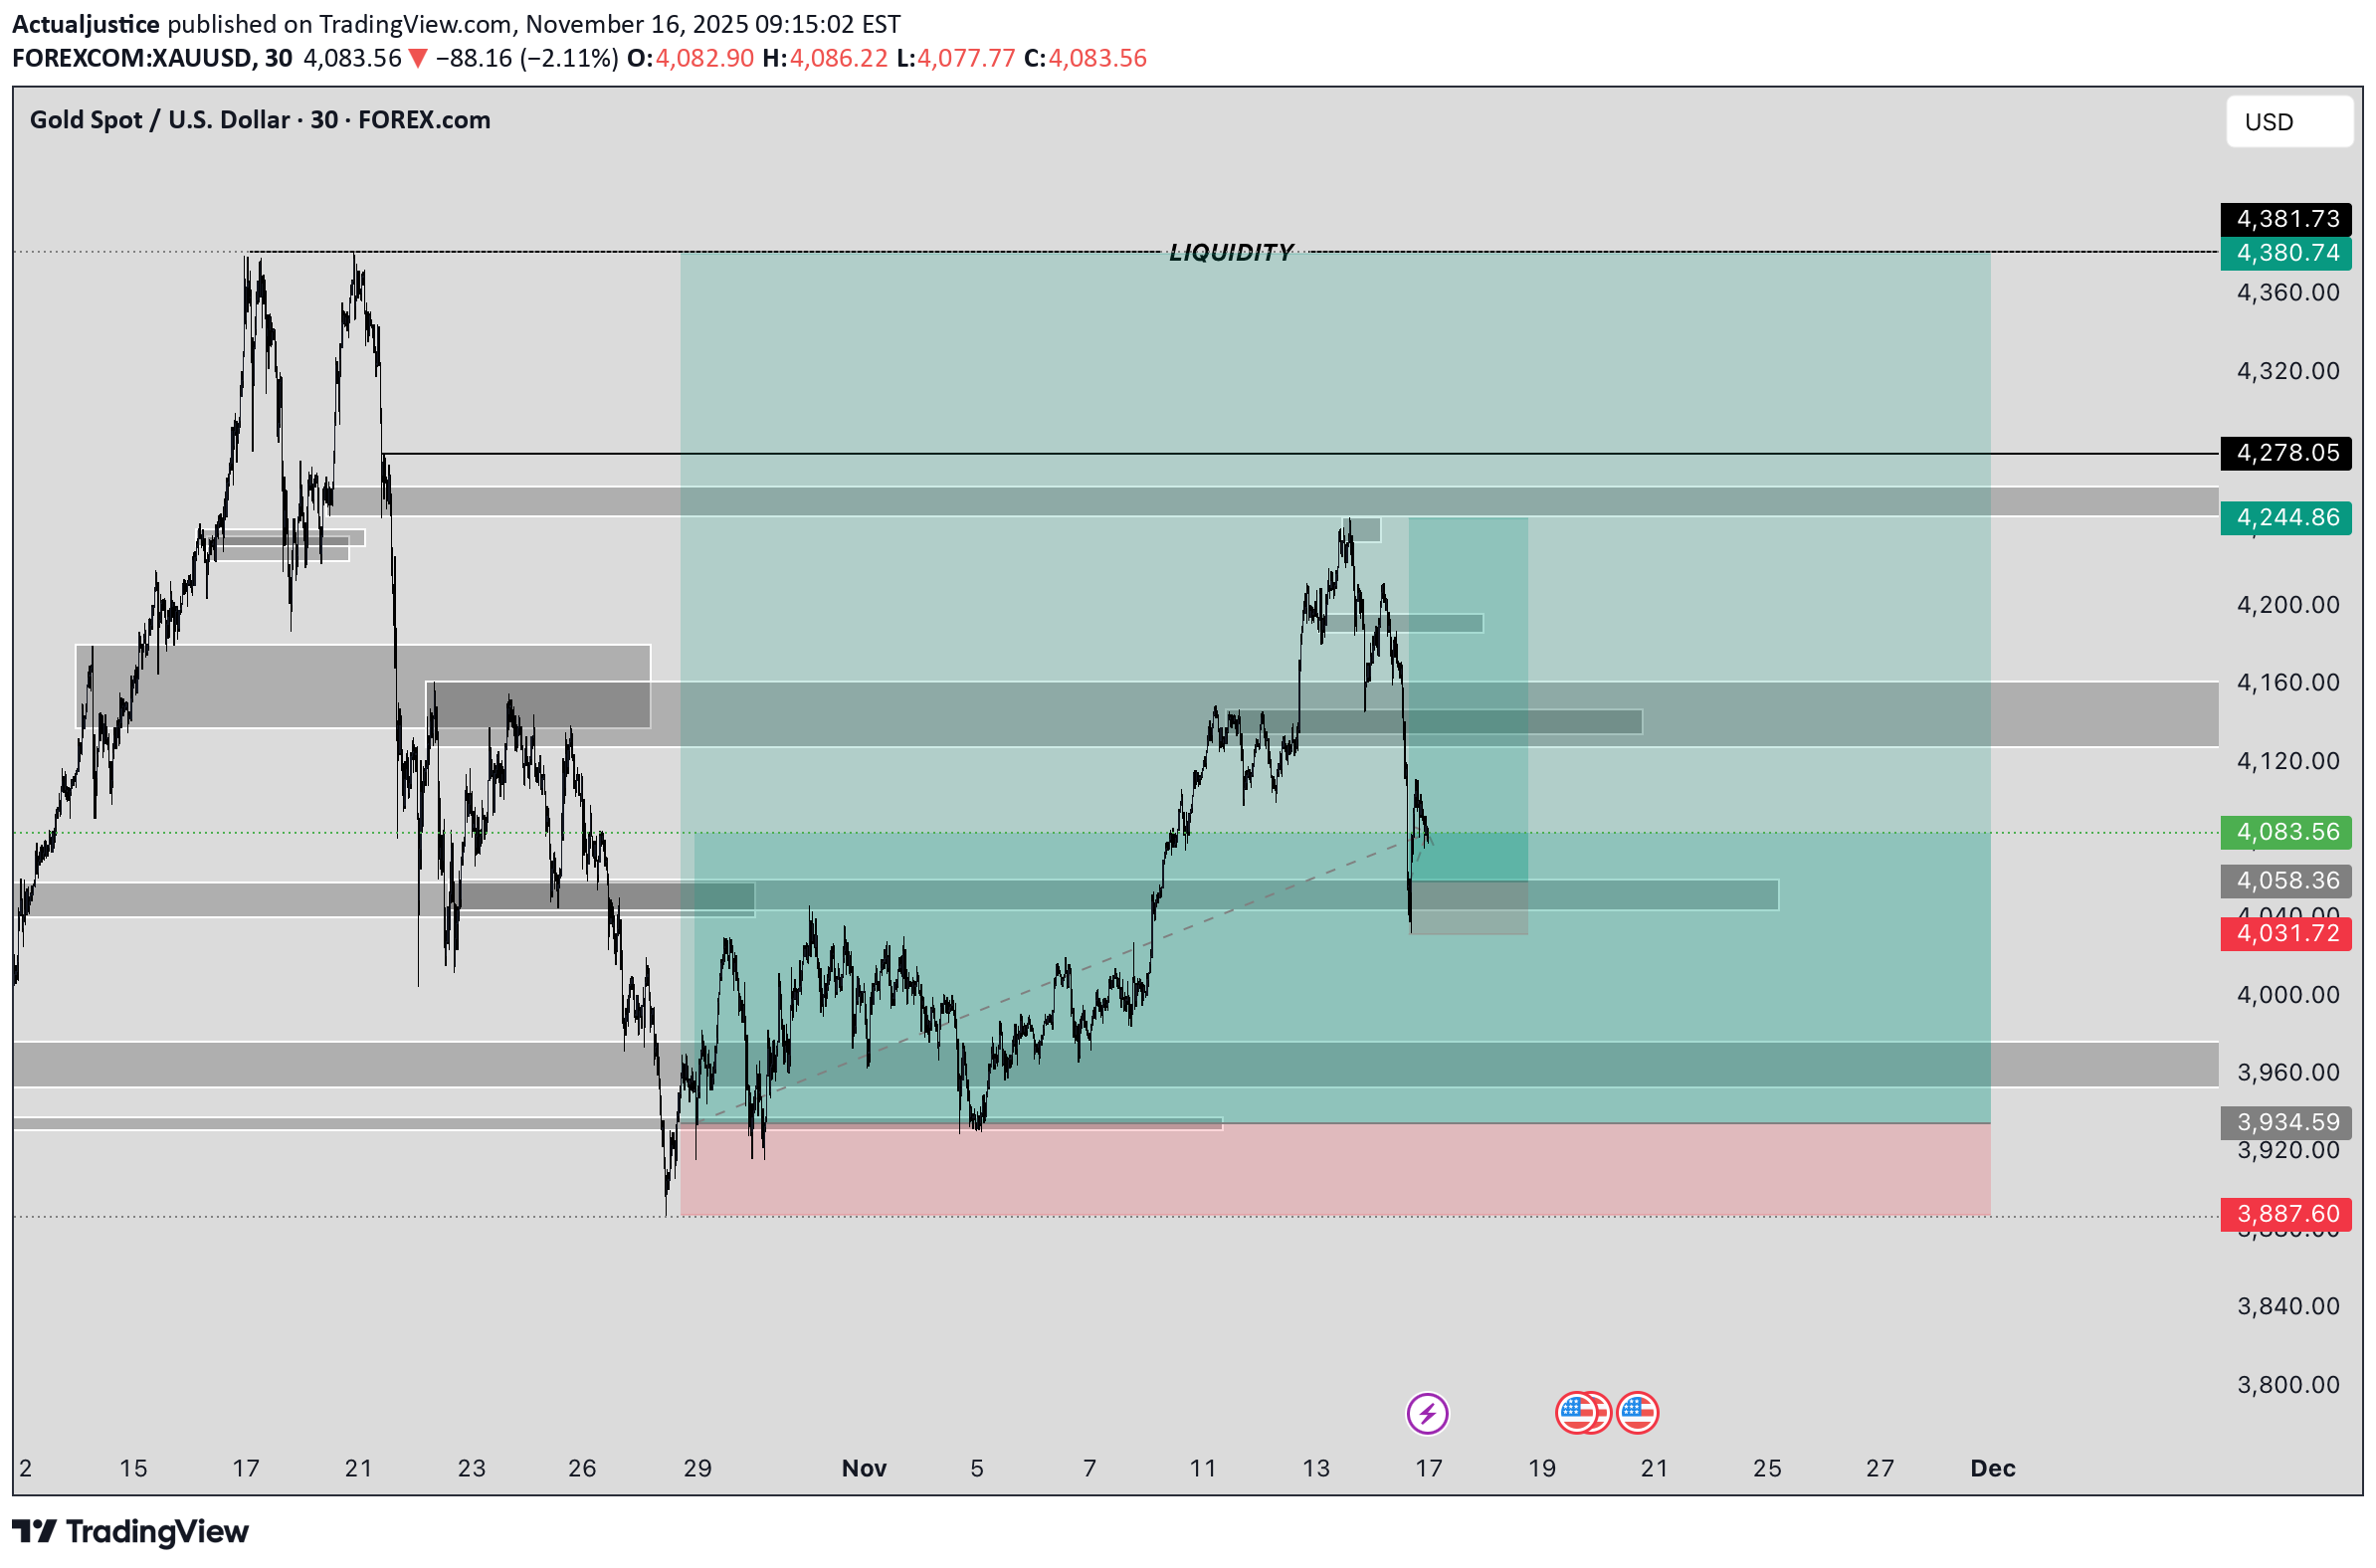
Gold has retraced into a major demand zone around 4,058.36, where price has shown the first signs of bullish reaction after clearing liquidity below previous lows. This zone aligns with a prior accumulation block and serves as the origin of the last major bullish swing. As long as price holds above this level, I expect a bullish continuation toward the upper liquidity region, with targets around 4,244.86, and ultimately the major high at 4,381.73. My stop loss is positioned at 3,887.60, below the deeper demand zone and previous structural low, ensuring safety from intraday volatility while maintaining the bullish structure.
Actualjustice
پیشبینی طلا (XAU/USD): مسیر صعودی کوتاهمدت تا هدف 4360 دلار
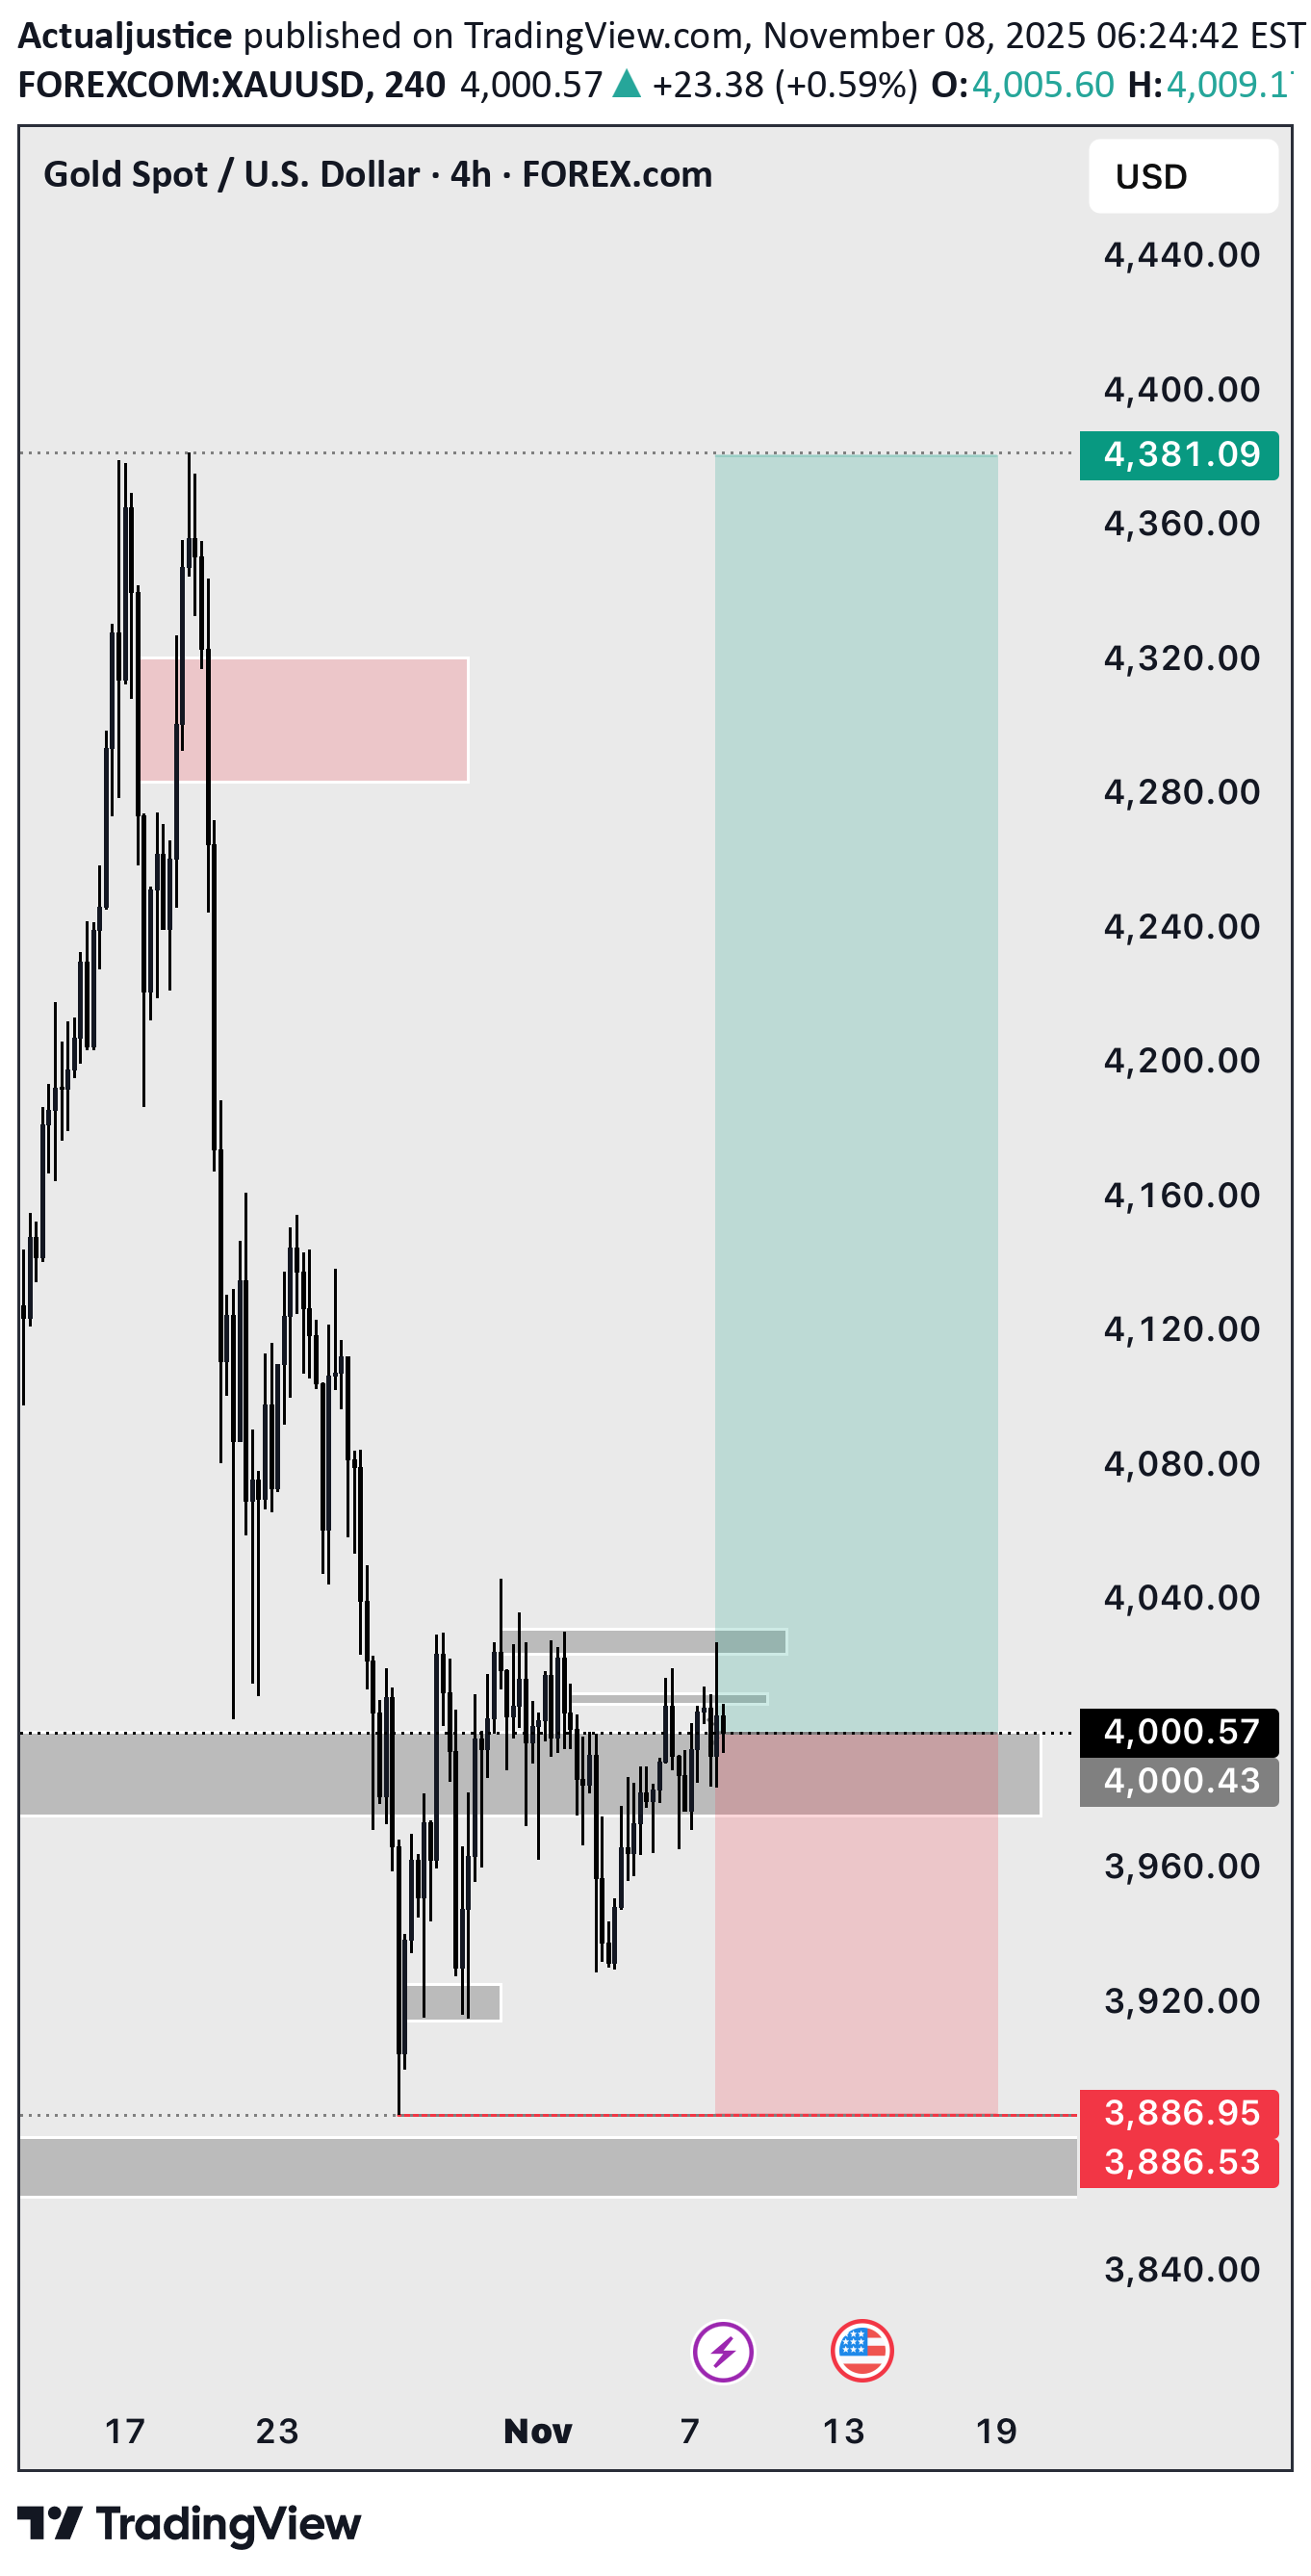
XAUUSD Bias: Short-term bullish retracement toward prior high Price is currently reacting from a well-defined support zone around the 4,000 region, where buyers have shown repeated willingness to step in. The market has consolidated within this zone, forming a series of higher lows, which signals accumulation and potential exhaustion of the previous bearish leg. My entry aligns with the structural demand. The rejection wick at the base of the zone suggests failure to break lower, strengthening the case for a bullish move. As long as price holds above the marked support, the market maintains a realistic path toward the previous swing high above 4,360, which is the projected target. The bullish target area also aligns with the broad imbalance / inefficiency zone created during the earlier sell-off. Markets commonly retrace to rebalance these areas before deciding on the next major directional move. Your stop-loss placement below 3,886, under the structural low and beneath the liquidity sweep, is logical. If price violates this level, it would invalidate the bullish thesis and confirm continuation to the downside. In summary: • Market is respecting a valid demand zone. • Accumulation structure favors a bullish corrective leg. • First major liquidity pool sits above 4,360 (your target area). • Stop-loss below 3,886 protects the trade idea while honoring market structure. ⸻ Devil’s Advocate — What Could Break This Plan? To strengthen your thinking, here are the strongest counter-arguments: 1. The “demand zone” may actually be redistribution. If this is a bearish continuation, the sideways movement could simply be sellers reloading before pushing price to new lows. 2. Liquidity above 4,360 might NOT get hit yet. Price could rally halfway into the inefficiency and reject aggressively without filling the entire imbalance. ⸻ Three Clarifying Questions you should ask(to tighten your analysis) 1. What confirms for you that this is accumulation and not redistribution? 2. If price only retraces to the midpoint of the imbalance (around 4,260), do you still hold full TP at 4,360? 3. What invalidation level—besides the SL—would signal loss of bullish momentum?
Actualjustice
تحلیل بیت کوین (BTC/USDT) در تایم فریم 4 ساعته: آیا قیمت به سقف قبلی بازمیگردد؟
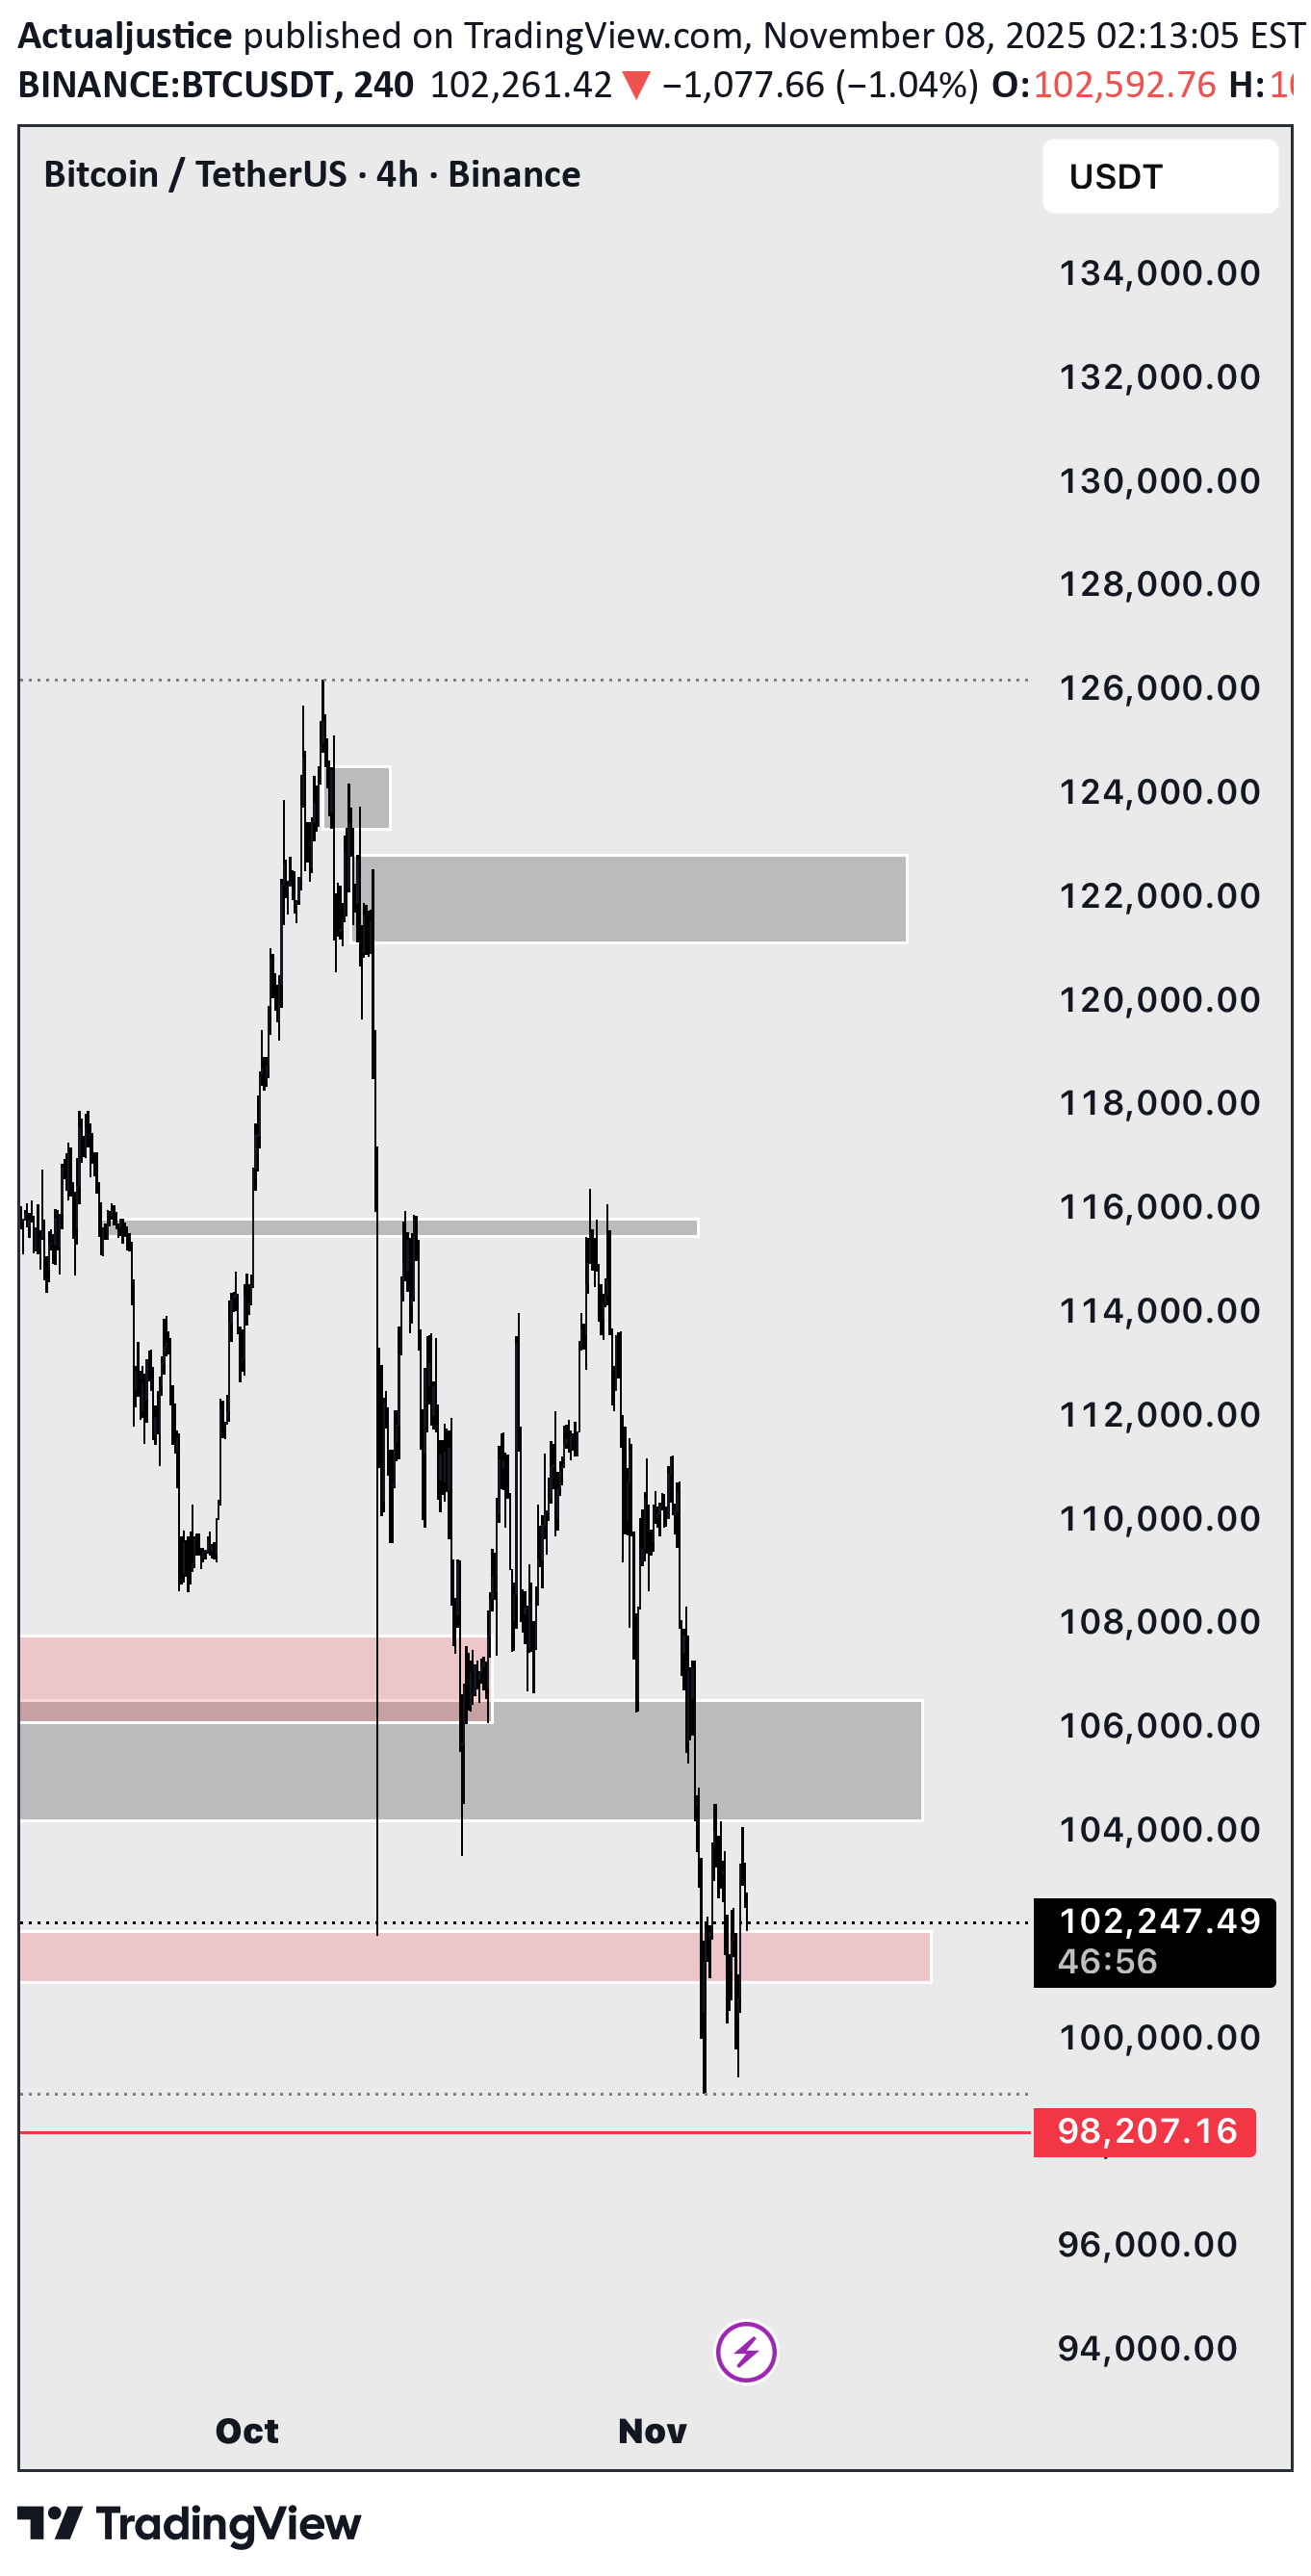
BTCUSD Bitcoin is currently trading around the 102,000 zone, sitting directly inside a well-defined demand region that has previously acted as an accumulation area. The market has aggressively sold off from the 116,000–118,000 rejection range and has now tapped into the deeper liquidity pocket highlighted on the chart. Price action within this zone shows repeated wicks into the demand block, signaling that sell-side pressure is slowing down while buyers are beginning to react. Structurally, the market has swept liquidity below the previous lows and is now consolidating above the 100,000 psychological value area. This behavior typically precedes a corrective move or a full bullish reversal. Based on the current reaction and the broader market context, my expectation is for Bitcoin to push upward from this demand zone and target the previous major high. The imbalance left on the move down and the inefficiency between 112,000 and 116,000 create a natural upside magnet for price once bullish momentum resumes. My invalidation level remains firm: the stop loss sits on the red line around 98,200. A clean break below this level would signal that the demand zone has failed and that further downside becomes highly probable. For now, as long as Bitcoin holds above the current demand structure, the bullish projection toward the previous high remains the primary scenario.
Disclaimer
Any content and materials included in Sahmeto's website and official communication channels are a compilation of personal opinions and analyses and are not binding. They do not constitute any recommendation for buying, selling, entering or exiting the stock market and cryptocurrency market. Also, all news and analyses included in the website and channels are merely republished information from official and unofficial domestic and foreign sources, and it is obvious that users of the said content are responsible for following up and ensuring the authenticity and accuracy of the materials. Therefore, while disclaiming responsibility, it is declared that the responsibility for any decision-making, action, and potential profit and loss in the capital market and cryptocurrency market lies with the trader.