
AboodAhmed
@t_AboodAhmed

What symbols does the trader recommend buying?
Purchase History
پیام های تریدر
Filter
Signal Type
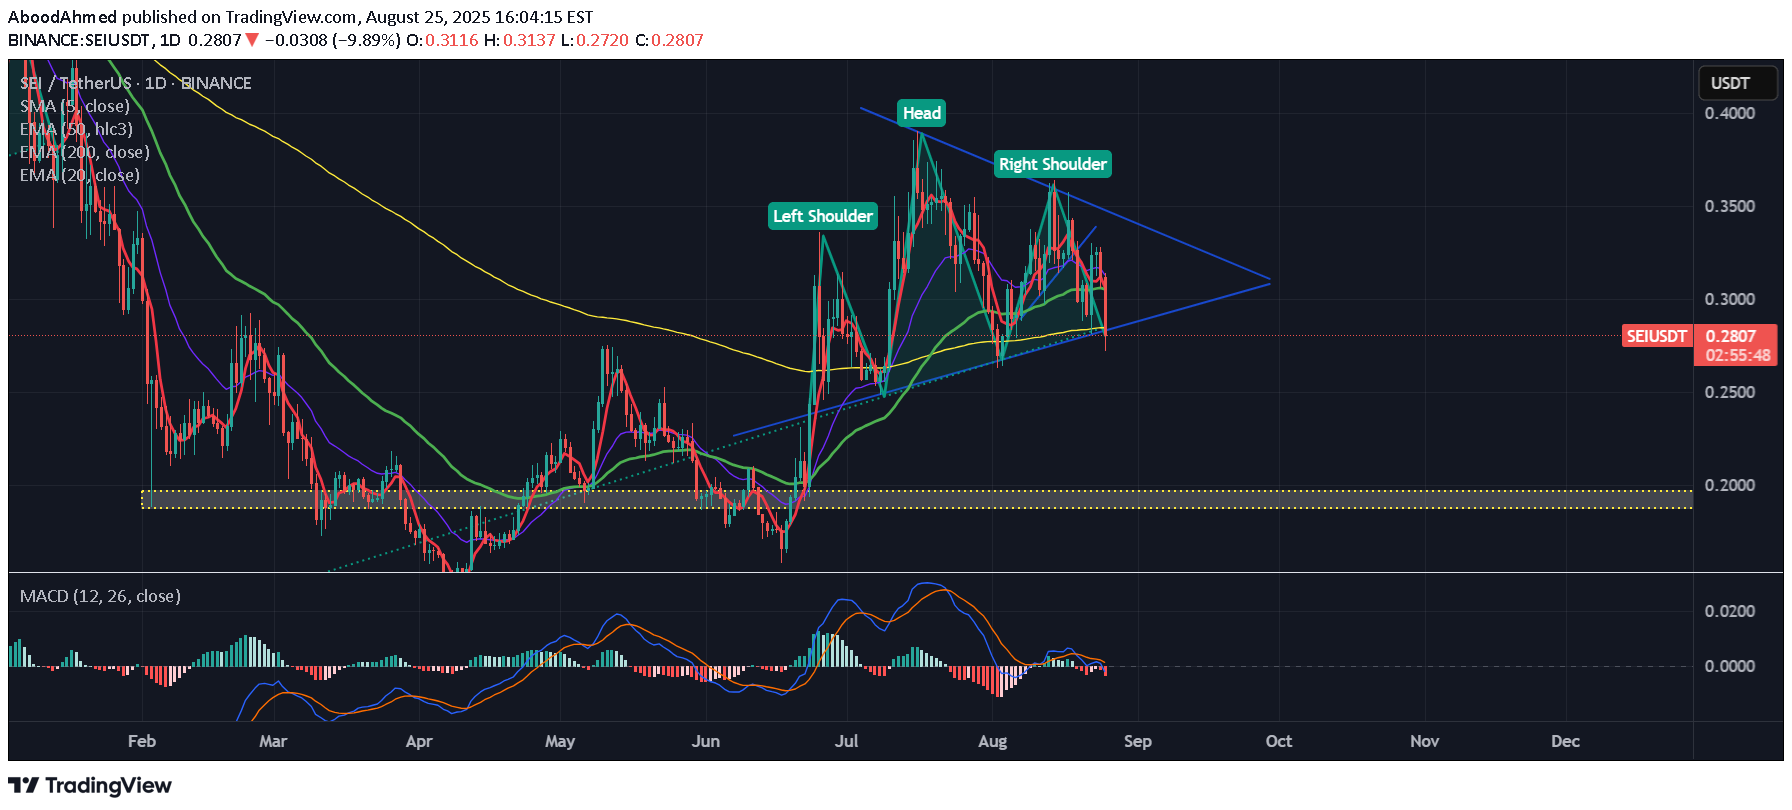
🧠 SEI/USDT Technical Analysis – Daily Chart ✅ Pattern Formation A clear Head & Shoulders pattern has formed on the daily chart: Left Shoulder: around $0.32 – $0.33 Head: peak near ~$0.37 – $0.38 Right Shoulder: around $0.32 – $0.33 Neckline: positioned at ~$0.28 – $0.29 (current price zone). This setup is a bearish reversal pattern if the neckline is broken with a daily close. 🎯 Target Projections Distance from Head to Neckline ≈ $0.09 – $0.10 Breakdown target = ~$0.19 – $0.20 (aligned with previous demand zone). Support Levels to Watch: $0.25 – $0.24 (intermediate support) $0.20 (major target from H&S) If broken, potential extension toward $0.18 📈 Alternative Bullish Scenario If SEI rebounds quickly, holding the ascending trendline and reclaiming $0.32 – $0.33, the H&S pattern would be invalidated. In that case, a retest of $0.36 – $0.38 resistance becomes likely. 📊 Indicators MACD: Bearish crossover below zero, confirming weakness. EMA200 (Yellow): Price trading below it → downside pressure remains. ⚠️ Disclaimer This analysis is for educational and technical purposes only and does not constitute financial or investment advice.

🧠 Bitcoin (BTC/USDT) Technical Analysis – 4H Chart ✅ Pattern Formation A classic Head & Shoulders pattern has formed on the chart. Left Shoulder: around $120,000. Head: peak near ~$124,000. Right Shoulder: around $119,000 – $120,000. Neckline: positioned around $112,000 – $113,000 (current price area). This setup is considered a bearish reversal pattern if the neckline is broken with a clear close. 🎯 Target Projections Distance from the Head to the Neckline ≈ $12,000. Measured move target after breakdown = $112,000 – $12,000 = ~$100,000. Key Support Levels: $108,000 – $106,000 (intermediate support). ~$102,100 (major support, aligned with the H&S target). $100,000 (psychological round-number support). 📈 Alternative Bullish Scenario If BTC quickly rebounds from the neckline and reclaims $118,000 – $119,000, the bearish pattern would be invalidated. In that case, price could revisit the $124,000 resistance zone. ⚠️ Disclaimer This analysis is based purely on technical chart patterns and does not represent financial or investment advice. Traders should conduct their own research before making any decisions.

Sure, here's a technical analysis of the Head and Shoulders pattern observed on the 4-hour Bitcoin chart, suitable for TradingView:Technical Analysis: Bitcoin (BTC/USD) - 4-Hour ChartHead and Shoulders Pattern IdentifiedOn the 4-hour timeframe for BTC/USD, a classic Head and Shoulders (H&S) topping pattern appears to be forming, indicating a potential reversal from an uptrend to a downtrend.Left Shoulder: Formed around early to mid-May, reaching a peak near $104,000, followed by a minor retracement.Head: The most prominent peak, occurring in late May/early June, reaching approximately $112,000, demonstrating the highest point of the previous uptrend.Right Shoulder: Currently forming, peaking around $107,000, and is now declining towards the neckline.Neckline:A crucial element of this pattern is the neckline, which has been identified by connecting the lows after the left shoulder and the head. This neckline appears to be a critical support level around $102,000 - $103,000.Outlook and Potential Price Targets:Confirmation of Bearish Reversal: A confirmed breakdown below the neckline (a sustained close below the $102,000 - $103,000 region on the 4-hour chart) would validate the Head and Shoulders pattern and signal a strong bearish reversal.Initial Target: The initial measured move target for a Head and Shoulders breakdown is typically calculated by taking the vertical distance from the top of the head to the neckline and projecting it downwards from the breakout point. In this case, this could potentially target levels around $96,000 - $97,000.Key Resistance: If the price attempts to recover, the neckline (around $102,000 - $103,000) would likely act as significant resistance.Important Considerations:Volume: Traders should monitor volume closely. A significant increase in selling volume on a breakout below the neckline would add further conviction to the bearish outlook.Invalidation: This pattern would be invalidated if Bitcoin manages to break significantly above the peak of the right shoulder (around $107,000) or if it fails to break the neckline and resumes an upward trajectory.Risk Management: As always, proper risk management is crucial. Traders should consider stop-loss orders above the neckline or the right shoulder to mitigate potential losses if the pattern fails to play out as expected.In summary, the formation of this Head and Shoulders pattern on the 4-hour BTC/USD chart suggests a high probability of a bearish reversal. A decisive break below the neckline will be the key confirmation of this bearish sentiment, with potential targets around the $96,000 - $97,000 area.Based on the updated chart, it is clear that the previously identified Head and Shoulders (H&S) topping pattern has now experienced a decisive breakdown.Pattern Confirmation: The price has cleanly broken below the neckline, which was established around the $102,000 - $103,000 level. This sustained move below the neckline confirms the validity of the Head and Shoulders pattern and signals a strong bearish reversal.Current Price Action: BTC/USD is currently trading below the broken neckline, indicating that this former support has now likely turned into resistance. There's a clear candle close below the neckline, which is a key confirmation signal.Volume (Observation): While not explicitly asked for, a quick glance at the volume bars suggests there might have been an increase in selling volume during the breakdown, which would further reinforce the bearish move.RSI (Relative Strength Index): The RSI on the chart is now trending lower, potentially moving towards or into oversold territory. This downward momentum on the RSI supports the bearish price action and indicates increasing selling pressure.Outlook and Price Targets:Bearish Continuation Expected: With the confirmed breakdown, the expectation is for further downside movement.Measured Move Target: The initial measured move target for this Head and Shoulders pattern is calculated by projecting the distance from the top of the Head ($112,000) to the neckline ($103,000 approx. = $9,000) downwards from the breakout point. This projects a potential target around $94,000 - $95,000.Key Support Levels: The horizontal purple lines on your chart around $96,000 - $97,000 now represent the next significant support zone that the price is likely to test. This aligns well with the measured move target.Resistance: The broken neckline (around $102,000 - $103,000) will now act as a crucial resistance level if the price attempts to retrace upwards. Any retest of this level from below would be considered a "throwback" and, if rejected, would further strengthen the bearish outlook.In summary, the Bitcoin chart on the 4-hour timeframe has confirmed the bearish Head and Shoulders pattern with a clear breakdown below the neckline. This suggests that further downside is likely, with potential targets around the $96,000 - $97,000 region and potentially extending towards the $94,000 - $95,000 measured move target. Traders should now watch for potential retests of the broken neckline as resistance.Updated Technical Analysis: Bitcoin (BTC/USD) - 4-Hour ChartHead and Shoulders Bearish Breakdown Confirmed with Neckline RetestBased on the new 4-hour chart, the Head and Shoulders (H&S) topping pattern has now seen a stronger confirmation of its bearish breakdown, and a "throwback" or retest of the broken neckline is currently underway.Left Shoulder: Formed earlier in May.Head: The clear peak in late May/early June.Right Shoulder: Formed in early June.Neckline: It's clearly visible that the neckline (the upper purple line around $103,000 - $104,000) has been decisively broken to the downside.Current Situation and Key Observations:Confirmed Breakdown: The price has sharply fallen below the neckline, confirming the bearish reversal expectations previously mentioned.Neckline Retest (Throwback): After the breakdown, the price is now attempting to rally and retest the broken neckline from below. This is a very common price action after a breakdown and serves as additional confirmation that the neckline has flipped from support to resistance.If the price is rejected at this level (i.e., if it fails to break back above the neckline and closes a 4-hour candle above it), it will confirm the new resistance and increase the likelihood of continued downside.Relative Strength Index (RSI): The RSI is currently trading in a neutral to bearish zone. This supports the weakening bullish momentum and may indicate continued selling pressure after this bounce.Next Support Levels:The first major support level clearly visible on the chart is the area around $97,000 - $98,000 (the middle purple line).The next significant level in case of continued downside would be around $89,000 - $90,000 (the lower purple line).Outlook:Most Likely Scenario (Bearish): If the price is rejected at the retest of the broken neckline (i.e., fails to close above $103,000 - $104,000), it is expected to resume its decline towards the next support levels at $97,000 - $98,000, and potentially $89,000 - $90,000 as a further target.Less Likely Scenario (Bullish): A sustained break and clear close above the broken neckline on the 4-hour timeframe (i.e., above $104,000) would indicate a false breakdown of the pattern and might invalidate the bearish outlook, but this is considered less probable after the clear initial break.Conclusion:The analysis on the 4-hour timeframe indicates that the Head and Shoulders pattern has been confirmed by a neckline breakdown, and the price is now in a "retest" phase of this line. This phase is critical: rejection at the neckline will reinforce the bearish expectations and open the door for lower support levels.
Disclaimer
Any content and materials included in Sahmeto's website and official communication channels are a compilation of personal opinions and analyses and are not binding. They do not constitute any recommendation for buying, selling, entering or exiting the stock market and cryptocurrency market. Also, all news and analyses included in the website and channels are merely republished information from official and unofficial domestic and foreign sources, and it is obvious that users of the said content are responsible for following up and ensuring the authenticity and accuracy of the materials. Therefore, while disclaiming responsibility, it is declared that the responsibility for any decision-making, action, and potential profit and loss in the capital market and cryptocurrency market lies with the trader.