Technical analysis by AboodAhmed about Symbol SEI: Sell recommendation (8/25/2025)

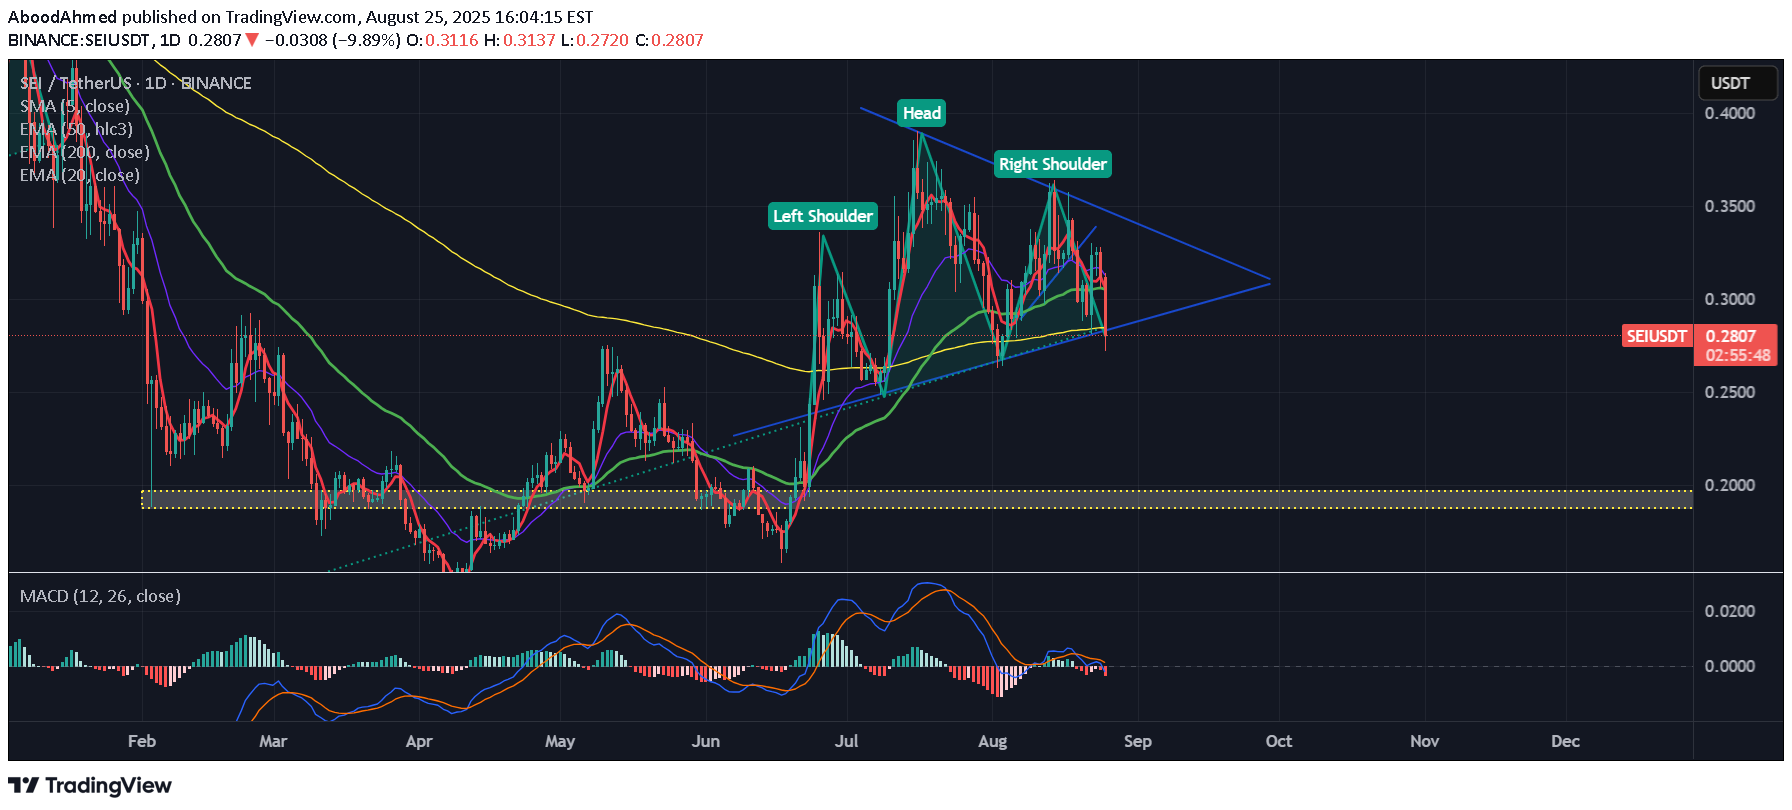
🧠 SEI/USDT Technical Analysis – Daily Chart ✅ Pattern Formation A clear Head & Shoulders pattern has formed on the daily chart: Left Shoulder: around $0.32 – $0.33 Head: peak near ~$0.37 – $0.38 Right Shoulder: around $0.32 – $0.33 Neckline: positioned at ~$0.28 – $0.29 (current price zone). This setup is a bearish reversal pattern if the neckline is broken with a daily close. 🎯 Target Projections Distance from Head to Neckline ≈ $0.09 – $0.10 Breakdown target = ~$0.19 – $0.20 (aligned with previous demand zone). Support Levels to Watch: $0.25 – $0.24 (intermediate support) $0.20 (major target from H&S) If broken, potential extension toward $0.18 📈 Alternative Bullish Scenario If SEI rebounds quickly, holding the ascending trendline and reclaiming $0.32 – $0.33, the H&S pattern would be invalidated. In that case, a retest of $0.36 – $0.38 resistance becomes likely. 📊 Indicators MACD: Bearish crossover below zero, confirming weakness. EMA200 (Yellow): Price trading below it → downside pressure remains. ⚠️ Disclaimer This analysis is for educational and technical purposes only and does not constitute financial or investment advice.
