
AXiVenture
@t_AXiVenture

What symbols does the trader recommend buying?
Purchase History
پیام های تریدر
Filter
AXiVenture
CHZ: Navigating the Surges of Fan-Driven Crypto Innovation
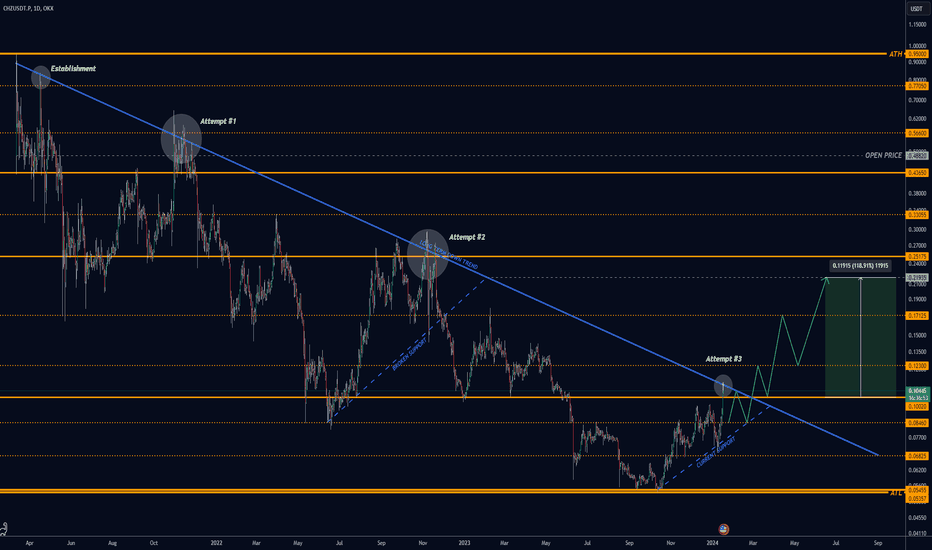
Chiliz (CHZ) entered the cryptocurrency trading arena on March 12, 2021, via the OKX platform. Its inception brought forth a distinctive digital asset with a dual role. CHZ serves not only as a means of transaction but as the native currency for Socios.com , a platform empowering sports and entertainment fans through blockchain-based voting rights. What sets CHZ apart is its innovative utility in connecting fans with their favorite teams. Through the Socios.com platform, users can engage in fan-driven decision-making, utilizing CHZ for transactions within the ecosystem. This dual-purpose functionality grants CHZ a unique position in the crypto market. Navigating CHZ's Chart Trajectory Initial Surge and Establishment of Key Levels: CHZ debuted at $0.48820 and swiftly faced an 11% dip in its first three hours of trading before reaching an all-time high (ATH) of $0.95000. Notable levels of interest were set at $0.43650, $0.56600, and $0.77050, acting as crucial support and resistance zones. Long-Term Sell-Off and Corrective Move: A substantial rally on April 16th, 2021, resulted in a 43% surge, failing to maintain the $0.77050 level, marking the onset of a prolonged sell-off. A 70+% corrective impulsive move ensued, dropping from $0.56600 to $0.17125 in just 23 trading days. Establishment of New Supportive Trend: A major level formed at $0.25175, where buyers attempted to breach the prior resistance at $0.56600. Exhaustion in the crypto market led to a decline to the next significant support at $0.10020, representing an 83% drop. On July 13, 2022, a new supportive trend emerged, initiating a 151% rally over 141 days. Consolidation and Rejection: Despite the impressive rally, CHZ encountered resistance at $0.33055, printing a lower high and subsequently dropping 32% to $0.17125. The established supportive trend was broken, leading to a further decline to $0.05455, a 45% drop. Current Landscape and Bullish Signals: Since January 10, 2024, buyers have dominated, pushing CHZ up by 31%. Crucial levels for sustaining bullish momentum are $0.08460 (minor) and $0.10020 (major). A breakout and hold of the long-standing downtrend are pivotal for confirming buyer control. Confirmation Bias and Indicators: On January 16, 2024, ROBO generated bullish signals (BUY4 & MOON), aligning with a persistent SUPER signal. Trading above the 200 daily EMA for four days reinforces the bullish narrative, with the 50-day EMA above the 200, signaling a bullish bias. The McGinley strip, acting as a dynamic support, remains above the 200 Day EMA, further reinforcing the bullish bias. Looking Ahead: The Importance of the Coming Week: The upcoming week holds significance in confirming the breakout of the current downtrend. In the dynamic world of trading, reacting to price movements remains paramount over attempting predictions. CHZ'S intricate journey and the current technical landscape underscore the importance of vigilance and adaptability in navigating the ever-evolving cryptocurrency market.
AXiVenture
Solana (SOL): Navigating future challenges

In the fast-paced world of cryptocurrencies, Solana (SOL) has emerged as a remarkable contender, offering a unique blend of cutting-edge technology and robust performance. This article delves into Solana's distinctive features, its historical journey through the crypto landscape, and the current technical indicators that shape its path forward. Solana Unveiled: A Speedy Blockchain Paradigm Solana is not your average cryptocurrency; it's an entire crypto computing platform with a clear mission—to deliver lightning-fast transaction speeds while maintaining decentralization. Solana achieves this ambitious goal through a series of innovative approaches, with its native cryptocurrency, SOL, serving as the fuel for transactions and staking. The platform has made significant strides by introducing groundbreaking concepts such as the "proof of history" mechanism. This innovative approach enhances its transaction throughput without compromising on the core principles of decentralization, providing users with a powerful, scalable, and efficient blockchain network. A Historical Perspective: The Volatile Odyssey of SOL Solana's journey began with its introduction to the trading world on OKX in early 2021, sporting an opening price of $3.020. Much like the broader crypto market, Solana experienced a rapid adoption phase characterized by swift price appreciation. The initial 415% rally in the first 33 trading days was a testament to SOL's appeal to both novice and seasoned crypto enthusiasts. During this period, SOL's price identified significant support and resistance levels at $6.115, $9.235, $12.35, and a major resistance point at $17.615. Following this bullish phase, Solana entered a 32-day sideways movement with an average swing of 30% in either direction. A breakout from this range occurred, propelling SOL's price to reach new support and resistance levels at $27.5 and $55.915, respectively. However, a significant reversal transpired on May 19th, 2021, as SOL faced a formidable rejection at the $55.915 resistance level. The ensuing 63.64% price drop in just five days found support at a previously established daily AOI (Area of Interest), represented by the dotted grey line. Over the next 68 days, SOL's price coiled within a range, signaling that buyers were regaining control. The subsequent breakout tested the $55.915 level, and SOL's price surged past it, rallying further to encounter new resistance at $78.50. Following a brief period of sideways trading, SOL achieved another robust breakthrough of this resistance, continuing its parabolic ascent. New support and resistance levels emerged at $94.50, $118.55, $138.50, and $191.10, culminating in an all-time high of $259.88 on November 6th, 2021. This marked the initiation of a relentless downtrend, and the end of a 614% rally. SOL's descent persisted for 125+ days, finding a major support point at $78.5. A subsequent breakout from the established downtrend hinted at a potential rally to the $138.50 support turned resistance level. Unfortunately, SOL's price faced rejection at this juncture, signaling the continuation of the downtrend. The collapse of FTX further exacerbated SOL's downward trajectory, causing its price to plummet by over 92% from $118.55 to $9.235. The Current Scenario: Resurgence Amidst Sideways Drift Since discovering support at $9.235, SOL embarked on an impulsive journey, briefly revisiting $23.5. However, this rebound proved short-lived and failed to surpass the pre-collapse FTX levels. SOL has since been meandering sideways, marked by an average swing of 15% in either direction. Importantly, it has not managed to break the current downtrend. From June 5th, 2023, to July 7th, 2023, SOL initiated a robust V-shaped recovery (Indicated by the BOX) off the $14.455 support level, accompanied by the establishment of a potential new supportive trend and a cross below the 20 level indicating that we could have a potential reversal. A breakout above $17.675 yielded a 55.59% gain to the resistance at $27.5. At present, SOL has experienced a strong bounce off the $17.675 support level, reinforcing the newly formed daily supportive trend. However, resistance has materialized around $23.50. The Road Ahead: Balancing on a Precipice SOL's current trajectory hinges on its ability to breach the $23.50 resistance level convincingly. Failing to do so could lead to a descent towards the AOI daily line at $20.291, serving as a potential entry point for both long and short positions. Let's examine the critical indicators: * ROBO is currently bullish, generating 2 out of 3 signals following the breakout from the daily AOI level. SOL's price remains above the 50-day and 200-day Exponential Moving Averages (EMA). While the current sentiment is bearish, the potential for a golden cross (50 EMA crossing above 200 EMA) looms on the horizon. Trading above the McGinley strip further reinforces the bullish outlook. Nevertheless, it cannot be overstated that SOL must surpass $23.50 or secure support at the 200 DEMA or the AOI daily to maintain this bullish momentum. Failure to find support at these levels or a break of the supportive uptrend could lead to a revisitation of $17.675 or even a deeper descent to $15.471. As always, in the ever-evolving crypto landscape, the wisest approach is to react to predictions rather than predict reactions. SOL's price action reflects the relentless dynamism of the crypto market, where technical indicators and historical context guide our journey through the blockchain frontier.My current Idea behind SOLWill want to see a stronger confirmation of support @ this level
AXiVenture
Unleashing the Potential of OMG: Where do we sit?
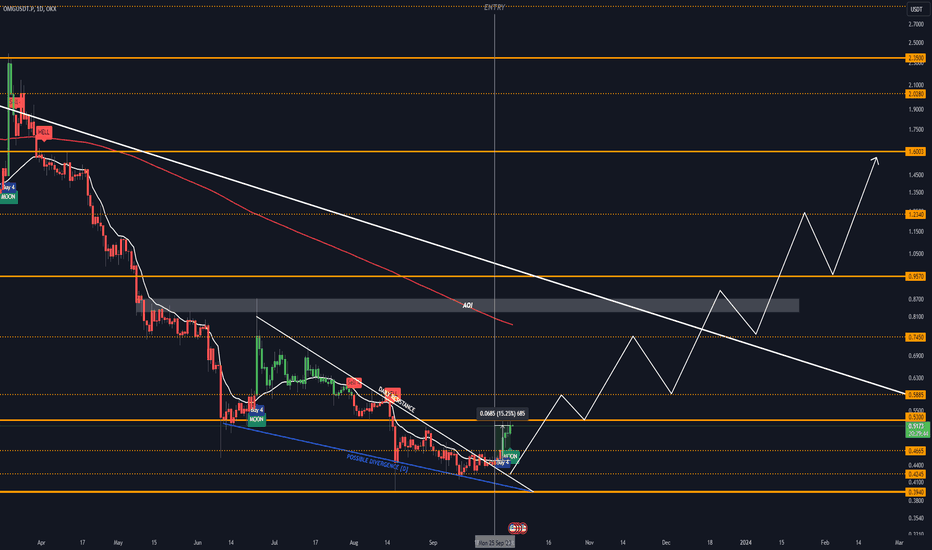
Cryptocurrency enthusiasts are no strangers to the dynamic world of digital assets. Among these, OMG, the native cryptocurrency of the OMG Network, stands out as a unique entity in the crypto sphere. This article delves into the essential aspects of OMG, its historical performance, and the intriguing technical dynamics that shape its current outlook. OMG Network: Pioneering Ethereum Scalability OMG takes center stage as the native token of the OMG Network, a blockchain platform that operates as a layer-2 scaling solution atop the Ethereum blockchain. Its primary mission is to enhance transaction efficiency by facilitating Ethereum transactions outside the Ethereum main network. OMG Network achieves this feat by significantly reducing transaction fees and accelerating transaction times, thereby addressing some of Ethereum's scalability challenges. Historical Trajectory: From ATH to Recent Lows OMG embarked on its journey to prominence and faced its historical zenith on November 5th, 2021, when it attained a staggering value just shy of $20.10. However, this pinnacle marked the onset of an extensive downtrend, evident in the bearish price action that emerged on November 7th, 2021. Since that pivotal moment, OMG has experienced a substantial decline, losing a staggering 97.59% of its value by August 17th, 2023. The crypto market's volatility and the unique dynamics of individual tokens have played a significant role in shaping OMG's price history. Exploring Bullish Divergence: A Promising Turnaround Signal One of the noteworthy aspects of OMG's recent price action is the emergence of a bullish divergence, a technical phenomenon that often signals a potential trend reversal. A bullish divergence occurs when an oscillator, in this case, the one used for analysis, demonstrates upward movement while the asset's price continues to trend lower. The critical juncture for OMG unfolded on September 6th, 2023, marked by market indecision. This period ultimately led to the formation of a support level at $0.4245, providing a crucial confirmation of the potential bullish divergence. OMG adhered to this support level and continued to trade within a defined range for 25 days, with the upper boundary at $0.4665. Presently, OMG has successfully broken the prevailing daily downtrend and surpassed the resistance at $0.4665. However, the next significant hurdle lies at $0.5300, which OMG needs to breach and secure with an open-close confirmation. The current outlook for OMG is notably bullish, bolstered by the factors mentioned above and validated by ROBO's signals on September 28th, 2023. Considerations and Key Levels: It's essential to keep in mind that, despite the bullish momentum, OMG remains below the 200-day daily Exponential Moving Average (EMA), which traditionally conveys a bearish signal. However, the asset's price continues to trade above the 50-day EMA and the McGinley strip, which offer additional insights into its price dynamics. Traders and investors can use the support and resistance (S/R) levels provided to make informed decisions regarding potential long or short positions. These levels serve as valuable reference points in assessing entry and exit strategies, enhancing risk management practices in the dynamic cryptocurrency landscape. In conclusion, the OMG cryptocurrency and the innovative OMG Network have carved out a unique niche within the broader crypto ecosystem. While the historical price journey has been marked by significant fluctuations, the emergence of bullish divergence signals a potential turnaround. As always, market participants should remain vigilant, conducting thorough analyses and employing sound risk management principles in their investment endeavors.
AXiVenture
IMX: A Comprehensive Analysis of a Dynamic Cryptocurrency

In the ever-evolving landscape of cryptocurrencies, IMX emerges as a distinctive player. Launched in November 2021, IMX is a cryptocurrency that has attracted attention for its unique features and trading patterns. In this comprehensive analysis, we will delve into IMX's journey, its distinctive characteristics, and its current position in the market. Understanding IMX IMX, short for its full name, is a cryptocurrency that operates within the realm of decentralized finance (DeFi). What sets IMX apart is its capacity to facilitate a wide array of financial activities, ranging from lending and borrowing to yield farming and trading. Essentially, IMX is a versatile asset that serves as the lifeblood of the broader DeFi ecosystem, allowing users to participate in various DeFi protocols, often with high liquidity. Historical Price Movements Early Momentum and Turbulence: IMX entered the market in November 2021, opening at a price of $6 per token. The initial days were marked by substantial volatility, with a notable 38% gain on the second day of trading. This early surge was indicative of the crypto market's fervor for innovative projects. Dramatic Ups and Downs: IMX reached its all-time high (ATH) at $9.54 but soon encountered a severe downturn, witnessing an 87% drop. This period was marked by intense selling pressure, with notable price swings in both upward and downward directions. March 2022 Rally: In March 2022, IMX experienced a remarkable 80% rally over the course of 23 days. However, this rally was met with resistance at the $2.8285 price level, resulting in an 86% retracement. Reversal and Strong Support: A pivotal moment occurred between November 2022 and January 2023 when a robust support zone at approximately $.3750 was established. This coincided with the detection of a hidden bullish divergence in the oscillator, signaling a potential trend reversal. * Understanding Divergences Divergence in technical analysis refers to a discrepancy between the price movement of an asset and an oscillating indicator, like the Relative Strength Index (RSI) or Moving Average Convergence Divergence (MACD). Hidden bullish divergence, as observed in the IMX chart, occurs when the price forms a lower low while the oscillator forms a lower high. This suggests that underlying bullish momentum may be building, potentially indicating a trend reversal. Post-Reversal Rally: Following the aforementioned reversal, IMX embarked on an impressive rally of 236% in just 68 days, with an additional 280% gain for those who heeded the bullish divergence signals. Challenges at $1.52: IMX faced significant challenges at the $1.52 price level, which acted as both support and resistance. A Head and Shoulders pattern emerged, further confirmed by a SELL4 signal, prompting a short position. Understanding the McGinley Strip The McGinley Dynamic is a technical indicator used in trading to smooth out price data and provide a moving average that adapts to market conditions. The McGinley Strip is formed by plotting multiple McGinley Dynamic lines on a price chart. It helps traders identify trends and potential reversal points. When the price is above the McGinley Strip, it may indicate a bullish trend, while a price below the strip may signal a bearish trend. Establishment of a Downtrend: IMX moved into a downtrend, as indicated by the money flow, which was flowing out on the oscillator. Current Market Position As of September 14th, 2023, several critical developments can be observed: Golden Dot and Oversold Conditions: A "Golden Dot" has appeared, indicating a cross below the 20 zone, which typically signals oversold conditions. This may hint at a potential trend reversal. Additionally, a triangle formation on the oscillator confirms this reversal sentiment. Breaking Resistance: IMX has successfully broken through the daily AOI box and a strong resistance level at $.6210. Crossing the Downtrend: IMX is now trading above the previously established downtrend line. 50 EMA Below 200 EMA: Notably, the 50-day Exponential Moving Average (EMA) remains below the 200-day EMA, suggesting a persistent bearish bias in the market. Future Outlook Several factors are crucial in assessing IMX's future outlook: Confirmation of ROBO Signals: The bullish sentiment should be further confirmed by the closing of candles as confirmation. Maintaining Key Levels: IMX needs to sustain its position above the $.6210 price level, using it as support. Crossing EMAs: A cross of the 50 EMA above the 200 EMA could indicate a potential shift in market sentiment. Resistance and Support: Rejection off the $.6885 level or failure to break the 200 EMA (red line) could indicate a bearish outlook. Using AOI Lines: Traders can utilize the AOI lines as entry and exit points or to gauge current market sentiment. In conclusion, IMX's journey in the crypto market has been marked by significant volatility, reversals, and notable technical indicators. As it navigates these challenges, traders and investors must remain vigilant, employing a combination of technical analysis and fundamental understanding to make informed decisions in this ever-changing landscape
AXiVenture
1INCH: Navigating the Decentralized Exchange Landscape

What is 1INCH? 1inch stands as the bedrock of the 1inch Network, an ingenious decentralized exchange aggregator. Designed to optimize crypto prices across decentralized exchanges, the platform ensures users get the best deals. The 1INCH token, launched in December 2020, powers this ecosystem. The primary method to earn 1INCH tokens involves providing liquidity on the 1inch liquidity platform. Historical Price Analysis: Entry to the Scene: 1INCH debuted on OKX on December 25th, 2020, immediately marking its presence with a 51% surge. However, this was followed by a 55% correction within the first five days. Formation of Crucial Levels: A vital support range materialized at $.9785 - $1.1120. Monster Rally: The subsequent 115 days saw a staggering 530% rally in 1INCH's price. During this period, fresh support levels emerged at $1.65, $2.05, $4.5735, and $5.3635. Resistance and Correction: A significant resistance formed at $7.50, leading to a precipitous 75% correction within 15 days. A subsequent rebound from $1.65 ushered in a second rally, culminating in 1INCH's all-time high (ATH) of $11. Notably, the ATH's initial candle exhibited a rapid 180% surge in a single day, with 50% of this gain relinquished on the same trading day. Present Market Situation Prolonged Sell-Off: Since October 27th, 2021, 1INCH has grappled with an enduring sell-off. The breach of the last major low on August 18th, 2022, marked the establishment of a formidable resistance/downtrend. Emergence of Supports: New support levels have come into play, previously set at $.5555, $.3825, $.2335, and the current all-time low (ATL) of $.2005. Current Position and Signals Persistent Bearish Trend: 1INCH has been entrenched in a bearish trajectory since May 11th, 2021. A robust downward trend persists, punctuated by four significant attempts to break it, particularly the last two being substantial. Bearish Indicators: Technical cues underscore the bearish sentiment: the 200 EMA remains above the 50 EMA, alluding to a bearish outlook. Furthermore, all three ROBO signals point to a sell-off, compounded by trading below the McGinley strip. Identifying Potential Shifts: Oscillator Insights: The oscillator, accompanied by a hyper wave, underlines money flow and directional momentum. A bell signaling the wave crossing below the 20 level implies potential buying activity, even within oversold conditions. Implications and Predictions: Actionable Insights: In the current landscape, initiating a short position isn't recommended. It necessitates confident breach of the level at $.2405, with a potential target of $.2335 (a 2%+ decrease). This might elicit increased buying activity. A key benchmark is reclaiming the $.2615 level. Guiding Principle: Reacting to predictions, rather than predicting reactions, is essential in navigating the complex realm of 1INCH. Note: It's important to conduct in-depth research and consider professional advice before making investment decisions.Looks to be slowly ticking up.OPEN CLOSE RESISTANCE @ .2615
AXiVenture
Basic Attention Token (BAT): Revolutionizing Digital Ads

So, what is BAT? Born from the innovative Brave browser, the Basic Attention Token (BAT) heralds a unique position in the cryptocurrency world. Unlike most, Brave champions user privacy by eliminating most ads and tracking cookies, courtesy of its integral “shields” feature. A natural query arises - how does this ad-free model ensure revenue for websites and content creators? Enter BAT. Operating on Ethereum's platform as an ERC-20 token, BAT embodies the spirit of utility tokens, which are crafted for distinct applications. BAT ushers in an advertising model where users' privacy remains inviolate, and they have the autonomy to engage. Brave users accumulate BAT by voluntarily interacting with occasional, non-invasive ads. These tokens can then be channeled as tips to commendable content creators. Additionally, enthusiasts can acquire more BAT from exchanges, enhancing their tipping capacity. Historical Price Perspective Inception on OKX: BAT made its appearance on OKX on August 29th, 2020. It's pivotal to acknowledge the simultaneous behavior of BTC, which witnessed a 15% value drop around September 2nd, 2020. This turbulence inflicted a 30% devaluation upon BAT within 48 hours. Initial Value Zones: Early trading shaped two attention zones for BAT at $0.2515 and $0.2750. Initial Decline: BAT continued its descent, with a further 30% reduction, finding stability around the $0.1775 mark. Bullish Wave: As the larger crypto sphere exhibited a rebound, BAT experienced a meteoric 450% surge within 80 days post breaching the $0.2750 resistance in late January 2021. Resistance Encountered: The momentum faced a ceiling at $1.5750. BAT's inability to traverse this barrier precipitated a 70% plunge, retracing to a significant support at $0.4450. Record High: BAT’s subsequent bullish phase enabled it to register an all-time high (ATH) of $1.9273. However, the ensuing deceleration, combined with a death cross of the 50 and 200 EMA's in mid-February 2022, signified the dawn of a bearish epoch. Contemporary Market Situation Retracement and New Resistance: After a brief surge from the $0.2750 domain, the prior $0.4450 support transformed into a formidable resistance, giving birth to a potent downtrend. Latest Support Discovery: A salient support level materialized at $0.1650, which became the epicenter of a significant rally towards the end of December 2022. Indicators Turn Bullish: A promising crossover of the 20-day moving average above this level was noted on June 16th, 2023, complemented by two out of three bullish ROBO signals. Key support and resistance zones, delineated on the price chart, are represented by three gray lines. What Lies Ahead? Immediate Forecast: Current evaluations suggest BAT is navigating an upward trajectory. To sustain this momentum, it's imperative for BAT to solidify its stance above $0.2176 and $0.2250. Achieving this might propel BAT towards the next resistance at $0.2335 (offering a potential 6% appreciation). This could attract a fresh wave of buyers, potentially pushing the token closer to the $0.2616 resistance. Potential Retrace: Should BAT falter in surpassing these pivotal levels in the imminent days, we might see a pullback to around $0.2090 or potentially lower. Observers should also be wary that the 50 and 200-day EMAs are still to indicate a crossover. Conclusion: The Basic Attention Token (BAT), with its visionary integration into the Brave browser, offers a paradigm shift in digital advertising. For potential investors, understanding BAT's intertwining with larger market dynamics, technical levels, and underlying fundamentals will be paramount for making informed decisions.
AXiVenture
Yield Guild Games (YGG): The Nexus of NFTs and DeFi in Gaming

Yield Guild Games (YGG) stands as a pioneering decentralized autonomous organization (DAO) that deftly combines the principles of non-fungible tokens (NFTs) with decentralized finance (DeFi). Through its strategic investments in NFTs related to blockchain gaming, YGG envisions creating a robust virtual and gaming world economy. The primary objective is to optimize the utility of its community-owned assets, benefiting all token holders in the process. Renowned games like The SandBox and Axie Infinity have witnessed the infusion of value-driven virtual ecosystems, thanks to YGG's innovative strategies in content development and in-game economic structuring. Built upon the foundations of smart contracts and DAO-based governance, where token holder consensus drives decisions, YGG has undeniably etched a significant mark within the decentralized sphere, accentuating the value of NFTs in blockchain gaming. Historical Price Trajectory: YGG’s Debut: Launched on the OKX exchange on August 6th, 2021, YGG commenced trading at a price point of $2.3345. Early trading dynamics led to a swift 15% price reduction, carving out an initial weak support at $2. Rapid Ascend: Breaking free from its initial price, YGG witnessed a sharp 135% surge over a mere three days, setting a new threshold at $4.8215. Climbing Peaks: YGG's momentum carried it further, establishing a robust resistance at $9.68 and clocking an all-time high of $11.4568. $4.8215 - A Major Player: The $4.8215 level saw repeated interactions, with each engagement instigating an average upward thrust of 10%. Stalling and Retracement: Following a stagnant phase of 153 days without significant higher highs, YGG breached the $4.8215 support on January 5th, 2022, plummeting by 55% to its initial levels. Range-Bound Action: An 80-day ranging period saw a new resistance emerge at $3.1990. The failure to maintain the open level's support catalyzed a widespread correction/selloff, mirroring the wider crypto market trend. Reversal and Correction: After hitting a nadir, YGG rebounded robustly in mid-June 2022, soaring by 175% from the recent lows. However, despite the renewed interest, the absence of sustained buying pressure and the persistent inability to record new higher highs triggered another selloff. Present Market Scenario Trend Reversal Indicators: On June 16th, 2023, after a sharp daily downturn just days earlier, a positive crossover of the 20-day moving average indicated a possible easing of the bearish sentiment. Sideways Movement: Post the crossover, YGG exhibited a horizontal trend, with recurring 17% price jumps between the minor support and major resistance. Bullish Confirmation: Technical tools like ROBO flagged bullish signals in late July 2023, forecasting a potential upward shift in market sentiment. Breakout: August 4th, 2023, marked a significant event with YGG breaking out of its daily downtrend, resulting in a staggering 170% surge over four days to reach its current valuation. Prospective Market Movement Current Situation: As of now, YGG’s surge has culminated in reaching the target price of $0.4725. Immediate Forecast: To sustain its bullish narrative, YGG needs to consistently maintain above the $0.5444 level and overcome the resistance posed at $0.6155. Downward Correction Potential: Failure to remain above these crucial levels might trigger a correction towards the $0.4180 mark (equating to a 25% price reduction) or further down to $0.37, signaling a 35% correction. Technical Indicators: An impending 'golden cross' of the 50 and 200-day EMA remains to be observed, which historically indicates the onset of a new bullish trend. Conclusion: Yield Guild Games (YGG), with its visionary amalgamation of DeFi principles and NFTs within the realm of blockchain gaming, presents a dynamic asset in the crypto market. As with any cryptocurrency, its journey has been characterized by peaks, troughs, and pivotal technical levels. For prospective investors and traders, understanding the intricate dance between historical data, present trends, and predictive indicators will be paramount in making informed decisions in this volatile landscape.
AXiVenture
Axie Infinity (AXS): A Universe of Digital Potential

Axie Infinity, a creation of the Vietnamese studio Sky Mavis, operates within the realm of non-fungible tokens (NFTs). The game revolves around digital entities known as Axies, which share certain resemblances with Pokémon. Players nurture these Axies as virtual pets, focusing on various aspects like battling, breeding, collecting, raising, and establishing kingdoms. The game offers an in-game economy where players can monetize their efforts through selling items (Axies they breed, virtual real estate, accessories, etc.) via the game’s NFT marketplace and also acquire tokens. While my analysis is founded on an objective standpoint, I must admit I hold a personal bullish bias towards Gamefi cryptocurrencies, with Axie Infinity (AXS) being the catalyst that ignited my interest in the crypto ecosystem. My initial investment journey with AXS started on the Binance platform and later transitioned to OKX mid of the previous year. AXS was launched in November 2020 on Binance, whereas its listing on OKX occurred later in July 2021. Historical Price Analysis Binance Era: Launch: AXS opened at $0.50 on Binance on November 20th, 2020, during BTC's '20 bull run. A subsequent 14% drop in BTC led to a 35% dip in AXS, forming a major support at $0.37. A sharp recovery of 125+% occurred in the next 22 days. Early 2021 Rallies: Breaking the previous rally's high on January 26th, 2021, AXS achieved an impressive 60% gain in 11 days, creating another crucial support at $1.345. Bull Run Impact: From February 26th to July 28th, 2021, AXS skyrocketed 3275% in conjunction with the broader crypto bull run. OKX Integration: Resistance & Support: Upon AXS's OKX debut, resistance at $45.50 and support at $37.50 were established. All-Time High: Amidst hype and economic concerns, AXS reached its all-time high (ATH) of $165.67. Current Market Position Downtrend: Since November 25th, 2021, AXS has faced a bearish downtrend with an Area of Interest (AOI) ranging from $115-102. The break of major support at $91.85 without substantial buyer intervention led to a sell-off, reaching the current support at $5.96. Significant Support Level: The $5.96 support level has seen major rallies (November 10th, 2022, and December 31st, 2022) and a significant 17% drop on June 10th, 2023. A recovery above this support level indicates weakness as the price revisits this area. Where Do We Stand? Trends & Indicators: Observing the major downtrend since early May 2022, with three significant attempts to break, and considering the 50 and 200 EMAs (Exponential Moving Averages), the 50 is acting as resistance. Bullish Signals: The first bullish signal created by ROBO at $5.885 remains intact, suggesting that shorting is not advisable despite potentially bearish signs. What's Next? Potential Downside: If AXS fails to sustain above $5.96, a downward movement could occur towards two significant areas highlighted for mid-short term perspectives. Potential Upside: Should the price hold above $5.96 and challenge the AOI or attempt to break the current downtrend, a psychological shift could lead to a potential rally. Patience: This coin will require careful observation and patience as the market dynamics unfold. Conclusion Axie Infinity (AXS) represents an engaging and complex intersection of gaming, blockchain, and digital economy. Its journey showcases the volatility and potential within the GameFi space. The coming months may reveal whether AXS can capitalize on its support levels or succumb to bearish pressures. As always in crypto, vigilance and strategic insight will be paramount for traders and investors navigating this dynamic landscape.
AXiVenture
Shifting SAND' of Crypto: An In-depth Journey into the Sandbox

To begin, let's delve into understanding the fundamentals of SAND. The Sandbox is an innovative, decentralized gaming platform that utilizes blockchain technology and non-fungible tokens (NFTs) to provide a unique play-to-earn model. This platform allows players to create digital assets, customize their own games and immerse themselves in an array of interactive hubs, environments, and experiences. Moreover, they can monetize their digital creations by selling them via the Sandbox Marketplace in exchange for the native cryptocurrency, SAND tokens. The Sandbox universe is subdivided into 166,464 units of virtual real estate, referred to as LAND. Players can populate their LAND with games and ASSETS, or they can amalgamate several LANDs into larger estates. The ASSETS, or components of the virtual world, are categorized into entities and block ASSETS. Each of these ASSETS has a certain value in SAND and can be sold or traded at varying prices. Having established the basic concept, let's shift our focus to the historical price trajectory of SAND. SAND was launched on the OKX exchange on April 2nd, 2021, amidst an all-time high market for Bitcoin (BTC) and Ethereum (ETH). Post-launch, SAND underwent a substantial fall from its initial price of $0.7060 to $0.1740, marking a 75% decrease. Interestingly, this price level became a major structural low as it has not been revisited since. Despite the downtrend of BTC and ETH, SAND broke the resistance level of $0.27 on July 4th, 2021. This shift sparked investor interest in alternative cryptocurrencies like SAND. Consequently, the token witnessed a remarkable 2650% surge within 150 days, averaging a day-to-day increase of 18.27%. However, on November 25th, 2021, SAND reached its all-time high at $8.49 but failed to maintain above the critical support/resistance zone at $7.5125. As weaknesses began to appear across the industry, a downtrend ensued with the price plunging 70% over the following 150 days. Notably, the price frequently rebounded from the support/resistance level of $2.5520 until it was breached, leading to an additional 85% fall to the support level established in April 2021. So, where does SAND stand today? As of recent observations, after managing to hold above the major support/resistance zone at $.3850, SAND rallied to $.46 and above before encountering a substantial sell-off. It's important to note that a strong downtrend has been in place since May 10th, 2022. The most recent rally against this trend originated from the support level at $.3850, also forming an Area of Interest (AOI) ranging between $.4890 and $.52. Furthermore, the emergence of a potential uptrend suggests that the price may have difficulty breaching the current resistance level at $.46. Let's now consider the crucial technical indicators: Both the 50-day and 200-day Exponential Moving Averages (EMAs) are currently bearish, with the price unable to breach the 50 EMA in its recent attempt. This, coupled with the downward trend of both EMAs, indicates a possibly bearish sentiment. In terms of algorithmic trading, 2 out of 3 ROBO indicators currently suggest a bullish sentiment on the daily timeframe. Using these two indicators in tandem provides a neutral outlook, suggesting it might be prudent to wait for an optimal entry point for long positions. What should we anticipate going forward? For SAND to trend upwards, traders and investors will need to see a break above the current resistance level, which could alter market sentiment towards the project. Conversely, if SAND fails to do so and breaks the present daily uptrend, it may return to and possibly sweep past previous lows at $.4105 and $.3975, marking a 1.5 - 5% decline from the current price. Should there be a market-wide sell-off for BTC and ETH, SAND could potentially test the major structural support at $.3850, which also serves as a crucial psychological level.$.3975 level as indicated acted as a support level.
AXiVenture
GFT: Are we in a gifting mood?

GFT, a unique cryptocurrency with a mission to revolutionize the financial landscape, was released for trading on OKX on February 8, 2023. While initial interest was short-lived, GFT soon caught the attention of traders amidst a sudden and aggressive sell-off triggered by BTC's stagnation on Sunday, 26th, 2023. Despite an 85% drop from its release price, GFT found a supportive range with an all-time low of $0.011700. On the graph, two strong downtrends are apparent, with a glimmer of hope depicted by an increase in buying presence represented by the light grey uptrend. Technical Analysis: Bullish Bias and Key Levels: Currently, a bullish bias is favored for GFT's continued growth. To confirm this, a break and hold above $0.016100 and the first downtrend line are essential. Subsequently, breaking the last significant high at $0.025200 would solidify the bulls' control. However, facing resistances at $0.017320, $0.019300, and $0.022500 could indicate that sellers are still in charge, possibly leading to a retest of the $0.013200 range. Where Do We Sit? Confirming the Trade Idea: Multiple confirmation signals support the bullish bias. The wave oscillator at the bottom of the graph shows a positive cross above the 20-level, indicating a shift in power. Prior to this, a flip below the 20-level suggested oversold conditions and hinted at a possible reversal. Moreover, the higher highs created by the two waves signify increasing buying power. ROBO Advisor and Golden Cross: ROBO is bullish on the daily, 3-hourly, and 45-minute timeframes. Additionally, a golden cross has been observed on the 3-hourly timeframe, further supporting the bullish sentiment. GFT's potential for growth and its unique mission in the financial landscape make it an intriguing asset for traders and investors. As with any investment, it is essential to conduct thorough research, consider risk tolerance, and employ proper risk management strategies. Technical analysis offers valuable insights but should be combined with fundamental analysis and market sentiment to make well-informed decisions. Please note that the cryptocurrency market is highly volatile, and it is crucial to exercise caution, seek professional advice, and make informed decisions based on your risk tolerance and financial goalsNeeds to break and hold the downtrend!My New updated Idea on GFTI have adjusted some Key areas or (AOI's) and also added some little grey area AOIS that may be significant sell zones.Hit my AOI grey box
Disclaimer
Any content and materials included in Sahmeto's website and official communication channels are a compilation of personal opinions and analyses and are not binding. They do not constitute any recommendation for buying, selling, entering or exiting the stock market and cryptocurrency market. Also, all news and analyses included in the website and channels are merely republished information from official and unofficial domestic and foreign sources, and it is obvious that users of the said content are responsible for following up and ensuring the authenticity and accuracy of the materials. Therefore, while disclaiming responsibility, it is declared that the responsibility for any decision-making, action, and potential profit and loss in the capital market and cryptocurrency market lies with the trader.