
AR33_
@t_AR33_

What symbols does the trader recommend buying?
Purchase History
پیام های تریدر
Filter
AR33_
BTC After the Flush: Building a Base Into 2026
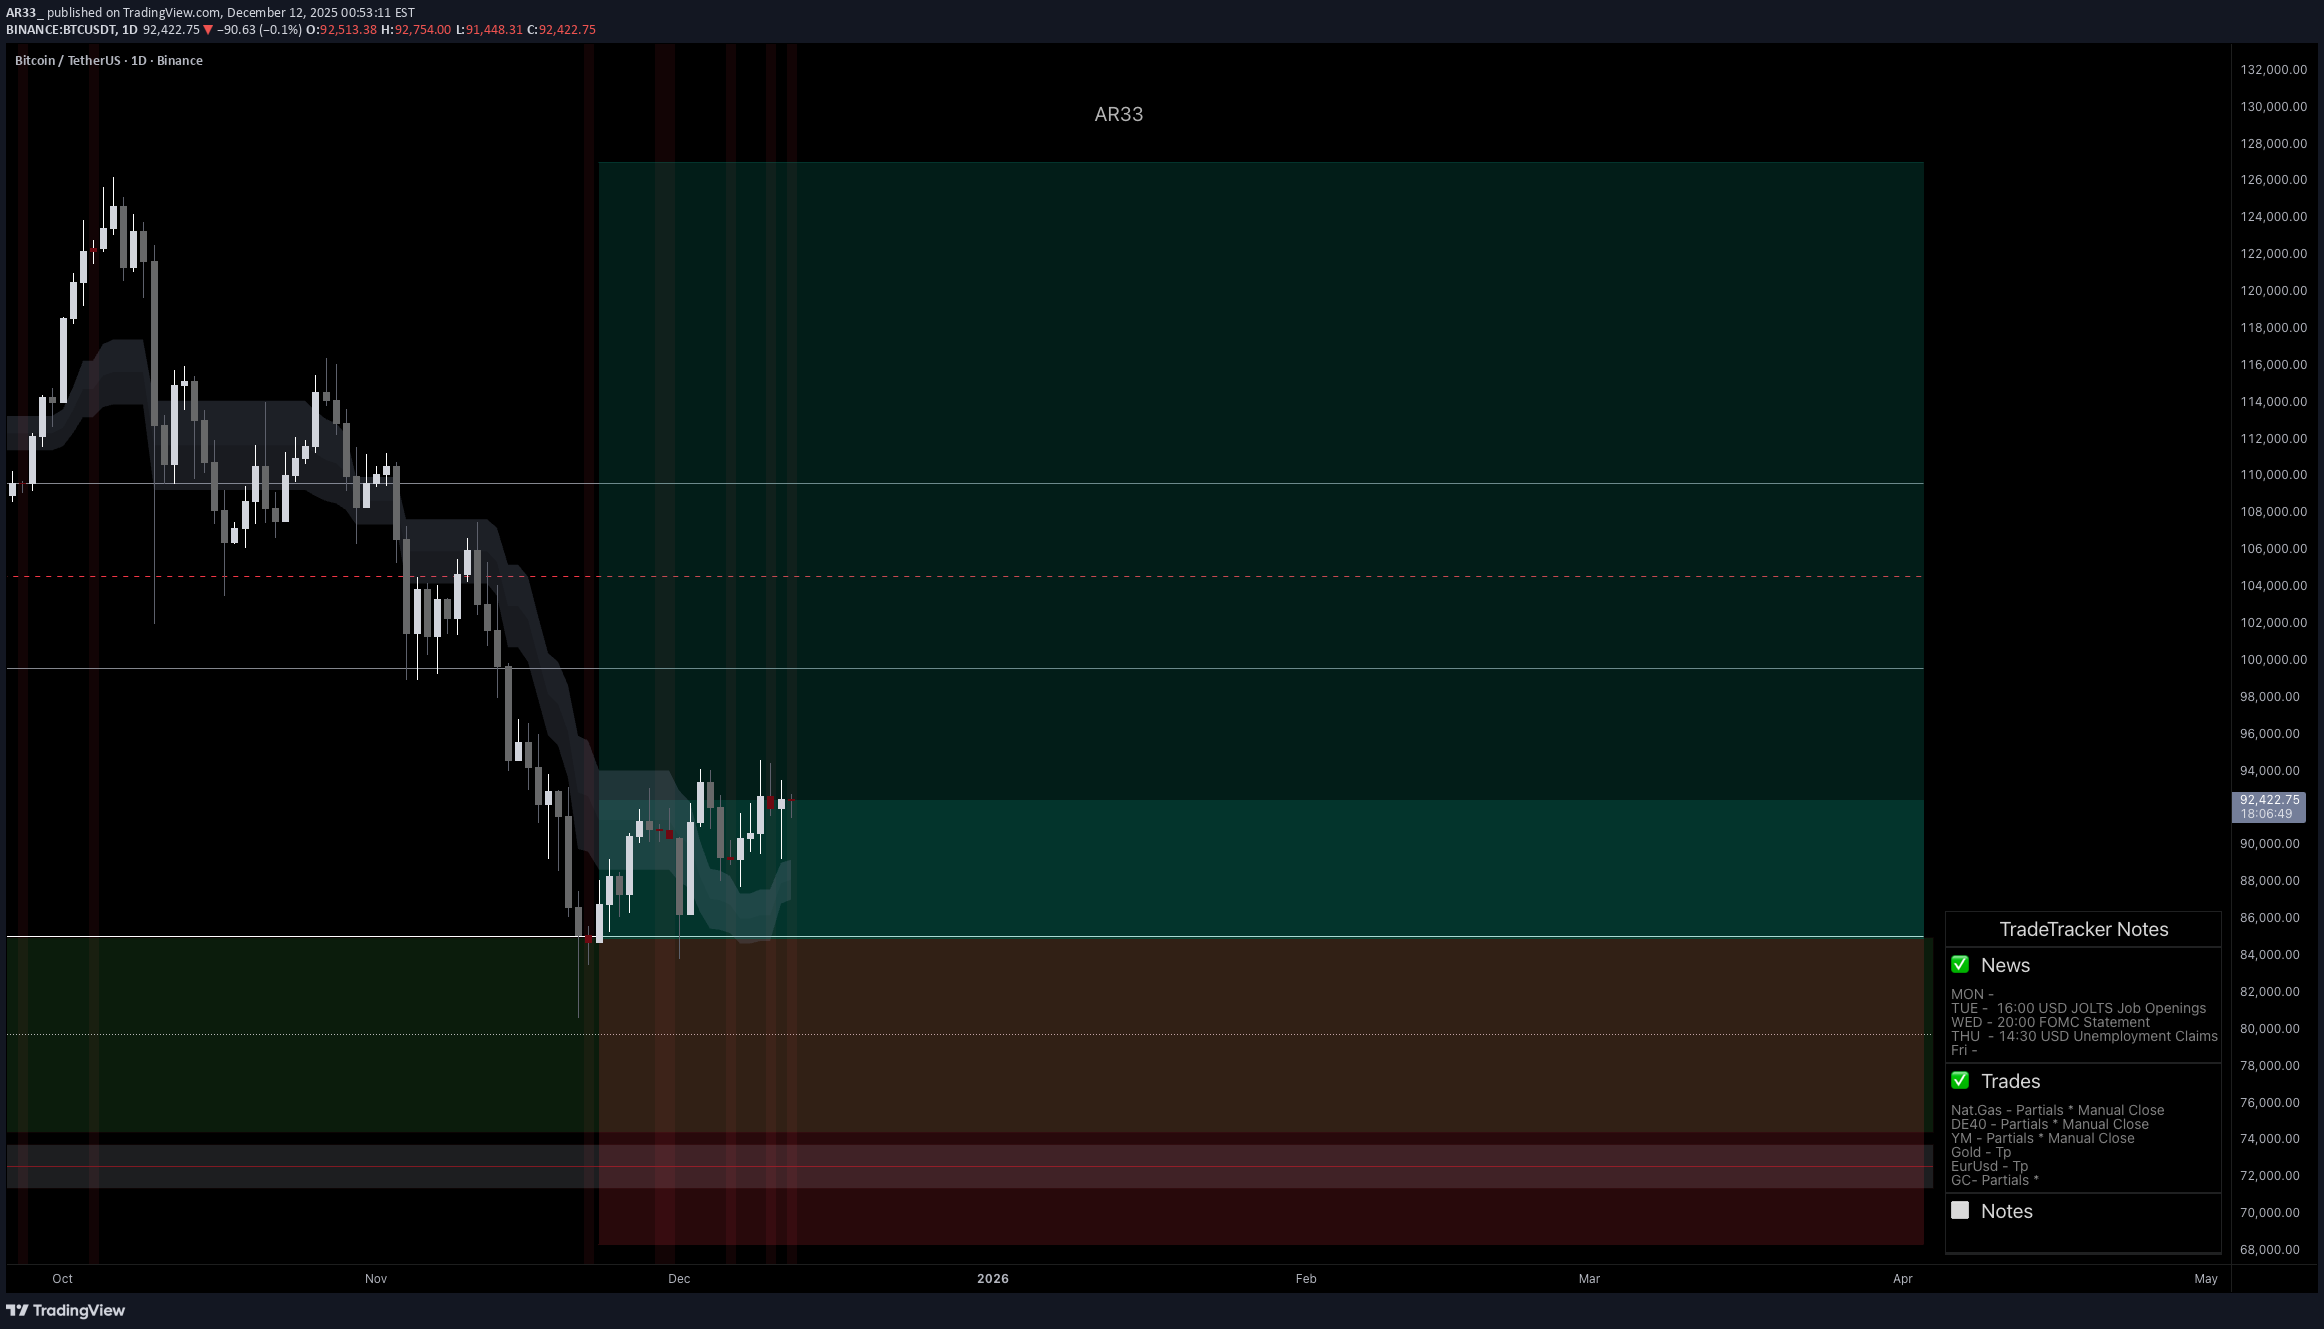
Bitcoin printed a clear correction from the 126,333 spot top into 80,625, a 36% retrace that finally reset an overheated trend. After that impulse down, price stopped bleeding and started building a base. That is the context for my long, not a breakout chase. My first entry triggered at 85,000. If price sweeps lower, I will add, with my final planned entry sitting in the 72,000 to 70,000 region. The whole idea is simple: scale into higher time frame demand after a deep reset, then let the market do the work if it wants to rotate back into risk. Technicals: on the daily, the selloff created an obvious “damage candle” sequence, followed by compression and range behavior. I am treating the 80K to 85K band as the core demand zone. The level that matters for confirmation is the recovery of the mid range resistance around 94,652, because a clean reclaim would shift the structure from “bounce” to “reversal attempt” and opens the door for a move back into the 100K area and, eventually, a retest of the prior ATH zone near 126K if momentum returns. Fundamentals : the macro backdrop is supportive for risk if financial conditions keep easing. The Fed has already moved policy lower and continues to guide the market with forward projections, which is the type of environment that can reprice duration and high beta assets.  At the same time, institutional crypto flows have been rebuilding. CoinShares reported a rebound in digital asset ETP inflows with Bitcoin leading, and daily US spot Bitcoin ETF flow data has also shown positive net flows on recent sessions.  On derivatives, CME positioning and open interest remain a key dashboard for whether this base is being built with size behind it.  Execution note: I am not trying to “be right” on the exact bottom. I am trying to be positioned where the risk is definable and the upside is asymmetric. If the narrative changes, I will adjust. If the market gives the move, I will pay myself and protect capital. Note: Please remember to adjust this trade idea according to your individual trading conditions, including position size, broker-specific price variations, and any relevant external factors. Every trader’s situation is unique, so it’s crucial to tailor your approach to your own risk tolerance and market environment.
AR33_
Gold’s Big Moment: $3,000 in Play – Can Bulls Hold It?
Gold has finally reached the psychological $3,000 level, triggering the first round of sell-offs as traders take profit. The question now is whether this move can sustain itself or if we are set for a deeper pullback. Given the rapid move up, I remain cautious, ready to cut the trade quickly if I see signs of weakness in the continuation.Fundamentals:•Market Sentiment: Bullish drivers remain strong as gold benefits from rising inflation expectations and the Fed’s rate pause, which has fueled demand for safe-haven assets.•Geopolitical & Economic Factors:•President Trump’s aggressive tariff agenda is fanning concerns about global trade, increasing risk aversion and driving flows into bullion-backed assets.•Chinese jewelry stocks are soaring, signaling growing demand for gold in the region.•The CME FedWatch Tool indicates a 97% probability that the Fed will hold rates steady at its next meeting, reinforcing gold’s appeal.•Technical Considerations:•Gold hit a fresh all-time high of $2,993, putting the psychological $3,000 mark in focus.•Above $3,000, there is little historical price action to guide resistance levels, making price discovery uncertain.•On the downside, $2,970 acts as a key pivot, with $2,951 and $2,914 serving as strong support zones if a deeper retracement occurs.Risk Management:•The first sell-off at $3,000 indicates short-term profit-taking.•I am monitoring price action closely and will exit quickly if the move proves unsustainable.Let’s see if gold can hold above $3,000 or if we are in for a correction!Note: Please remember to adjust this trade idea according to your individual trading conditions, including position size, broker-specific price variations, and any relevant external factors. Every trader’s situation is unique, so it’s crucial to tailor your approach to your own risk tolerance and market environment.Gold trade is currently 0.27% in profit. On the order flow and market depth, price is testing VWAP, where it has been consistently rejected. If this level fails to hold, I will exit the trade in profit and look for a reentry on Monday. Enjoy the weekend and remember—pay yourself!Gold opened the week with a strong move upward, pushing the position into 0.42% profit. I secured 80% of the position and will let the remaining trade play out under the same parameters. Enjoy the trading week and pay yourself!The position hit TP, reaching the 3K psychological level before facing a massive sell-off. A solid trade, but holding over the weekend added extra risk. Enjoy the trading week and keep showing up!
AR33_
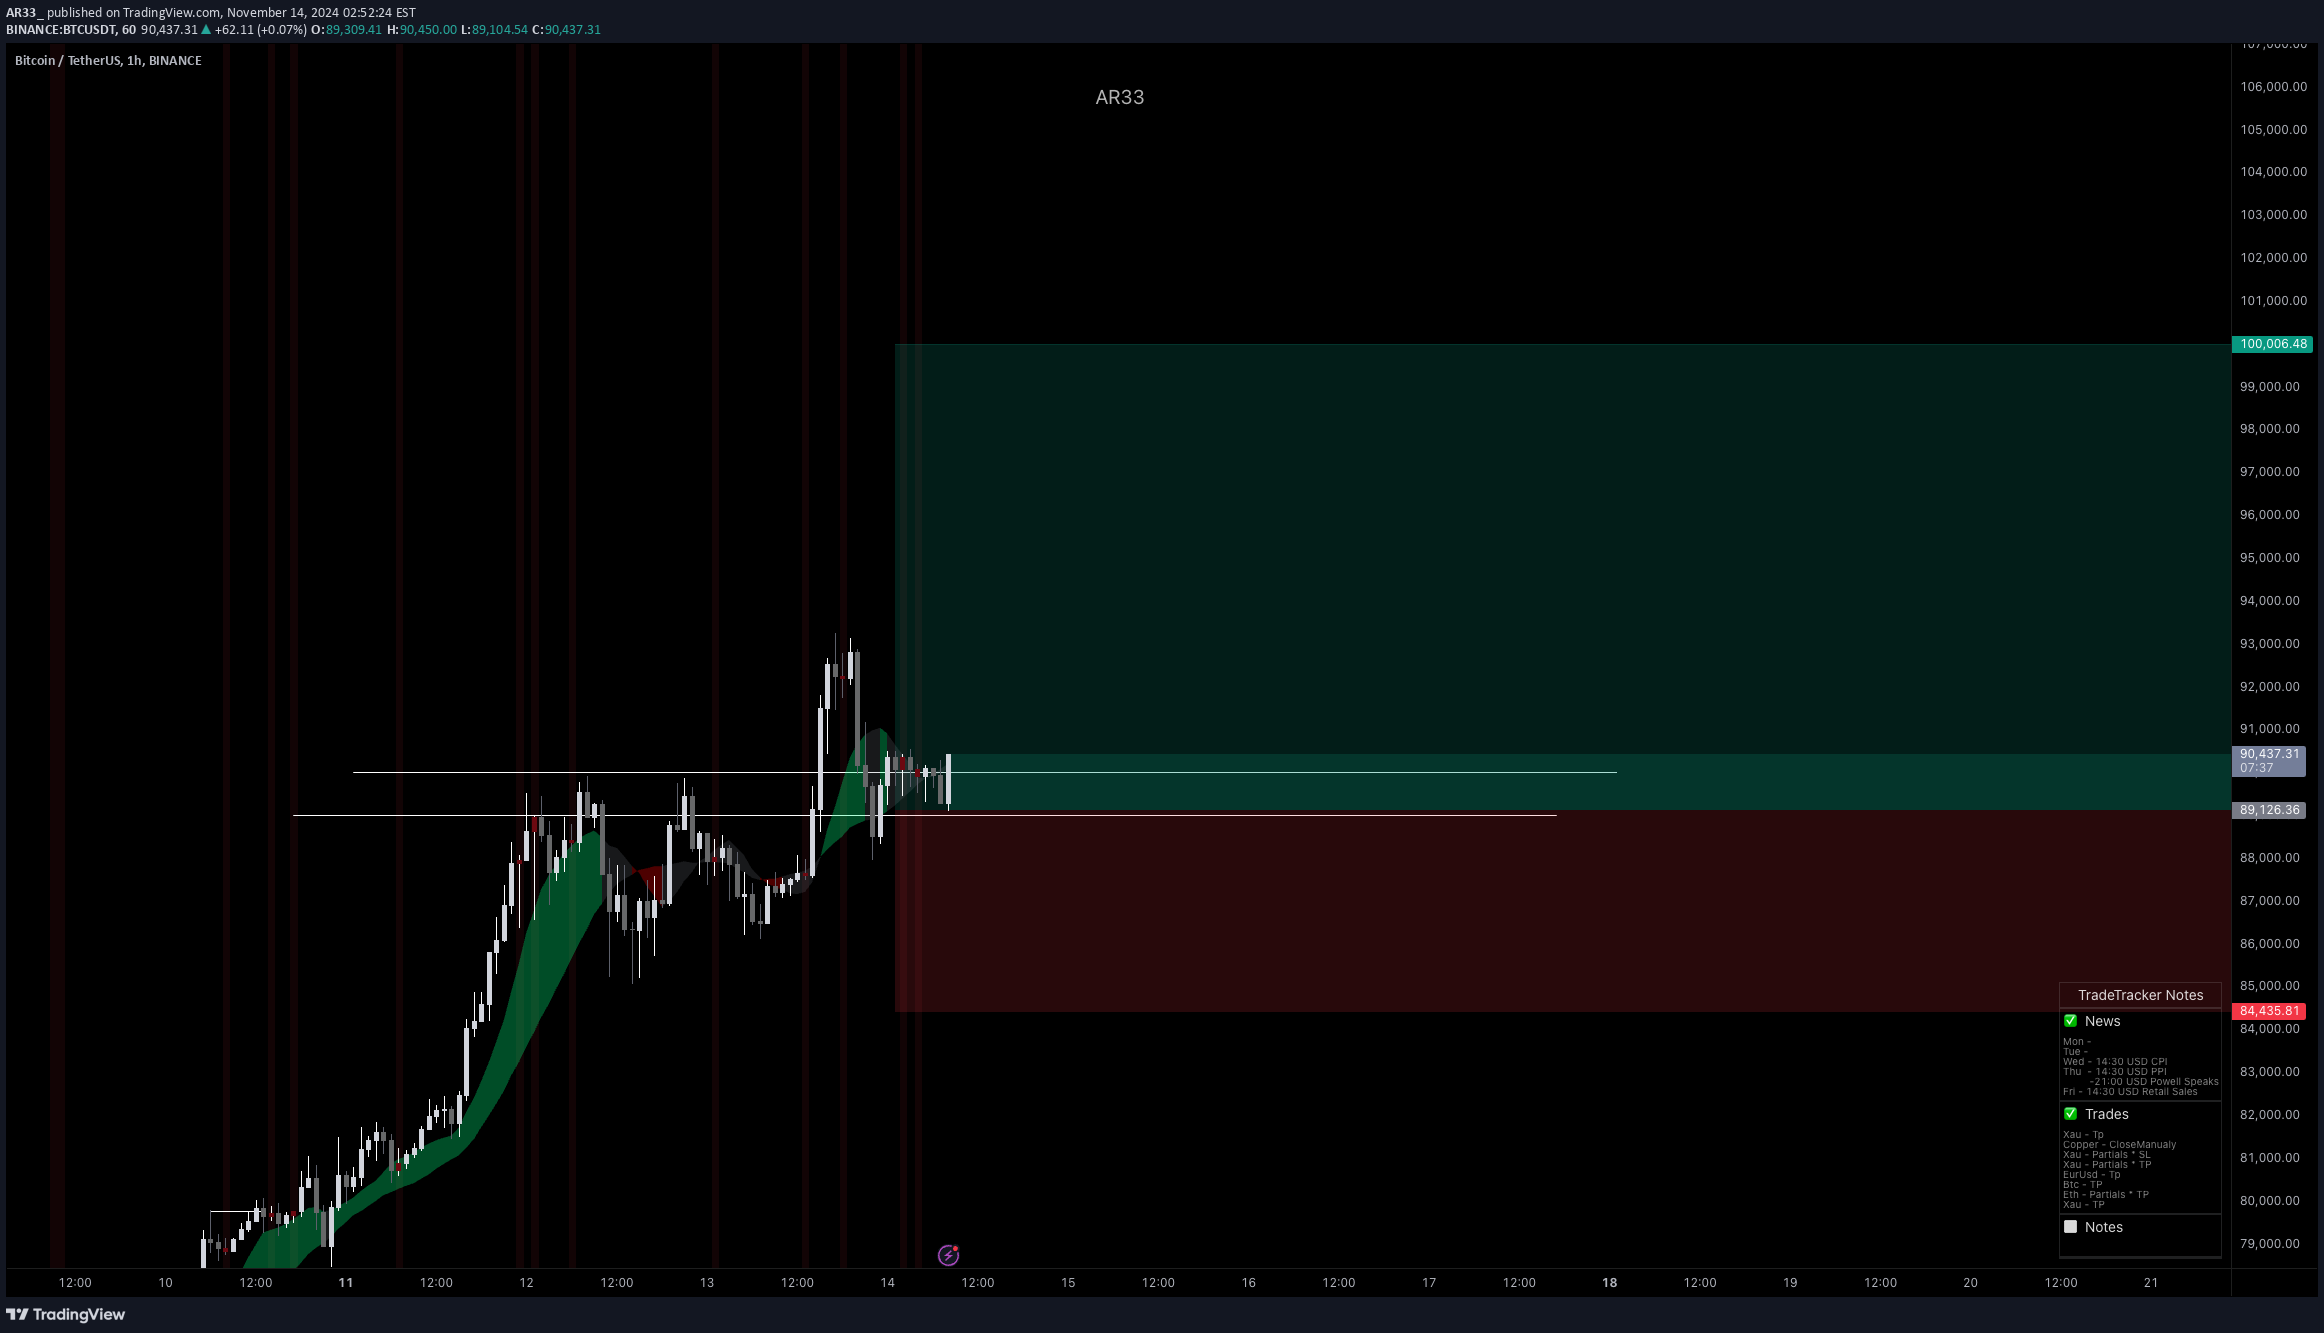
Bitcoin Holds Strong Above 200MA – Is the Next Rally Incoming?
Bitcoin has successfully defended the 84K-86K support zone, with the CME gap now fully closed. On the daily timeframe, BTC remains above the 200MA, signaling strong bullish momentum. With macroeconomic factors aligning in favor of crypto, this could be the start of another leg higher.Technical Analysis:•Support Zone: 84K - 86K held firm, preventing further downside.•CME Gap Closure: The retracement completed the necessary gap-fill, eliminating inefficiencies.•Trend Reversal Signal: BTC has reclaimed the 200MA on the daily chart, reinforcing bullish sentiment.•Breakout Watch: Price is approaching a descending trendline, a breakout above could trigger a strong move toward the 110K target.Fundamental Analysis:•Bitcoin ETF Impact: Institutional demand continues to grow with ETF adoption.•Macroeconomic Tailwinds: The Fed’s expected slowdown in rate hikes is a net positive for risk assets like BTC.•Geopolitical Factors: Increased demand for BTC as a hedge against economic instability and inflation.•Regulatory Developments: A more constructive approach from regulators supports long-term adoption.With bullish momentum building, Bitcoin is at a key inflection point. Will it break out and push towards new highs? Stay tuned and trade wisely!Note: Please remember to adjust this trade idea according to your individual trading conditions, including position size, broker-specific price variations, and any relevant external factors. Every trader’s situation is unique, so it’s crucial to tailor your approach to your own risk tolerance and market environment.
AR33_
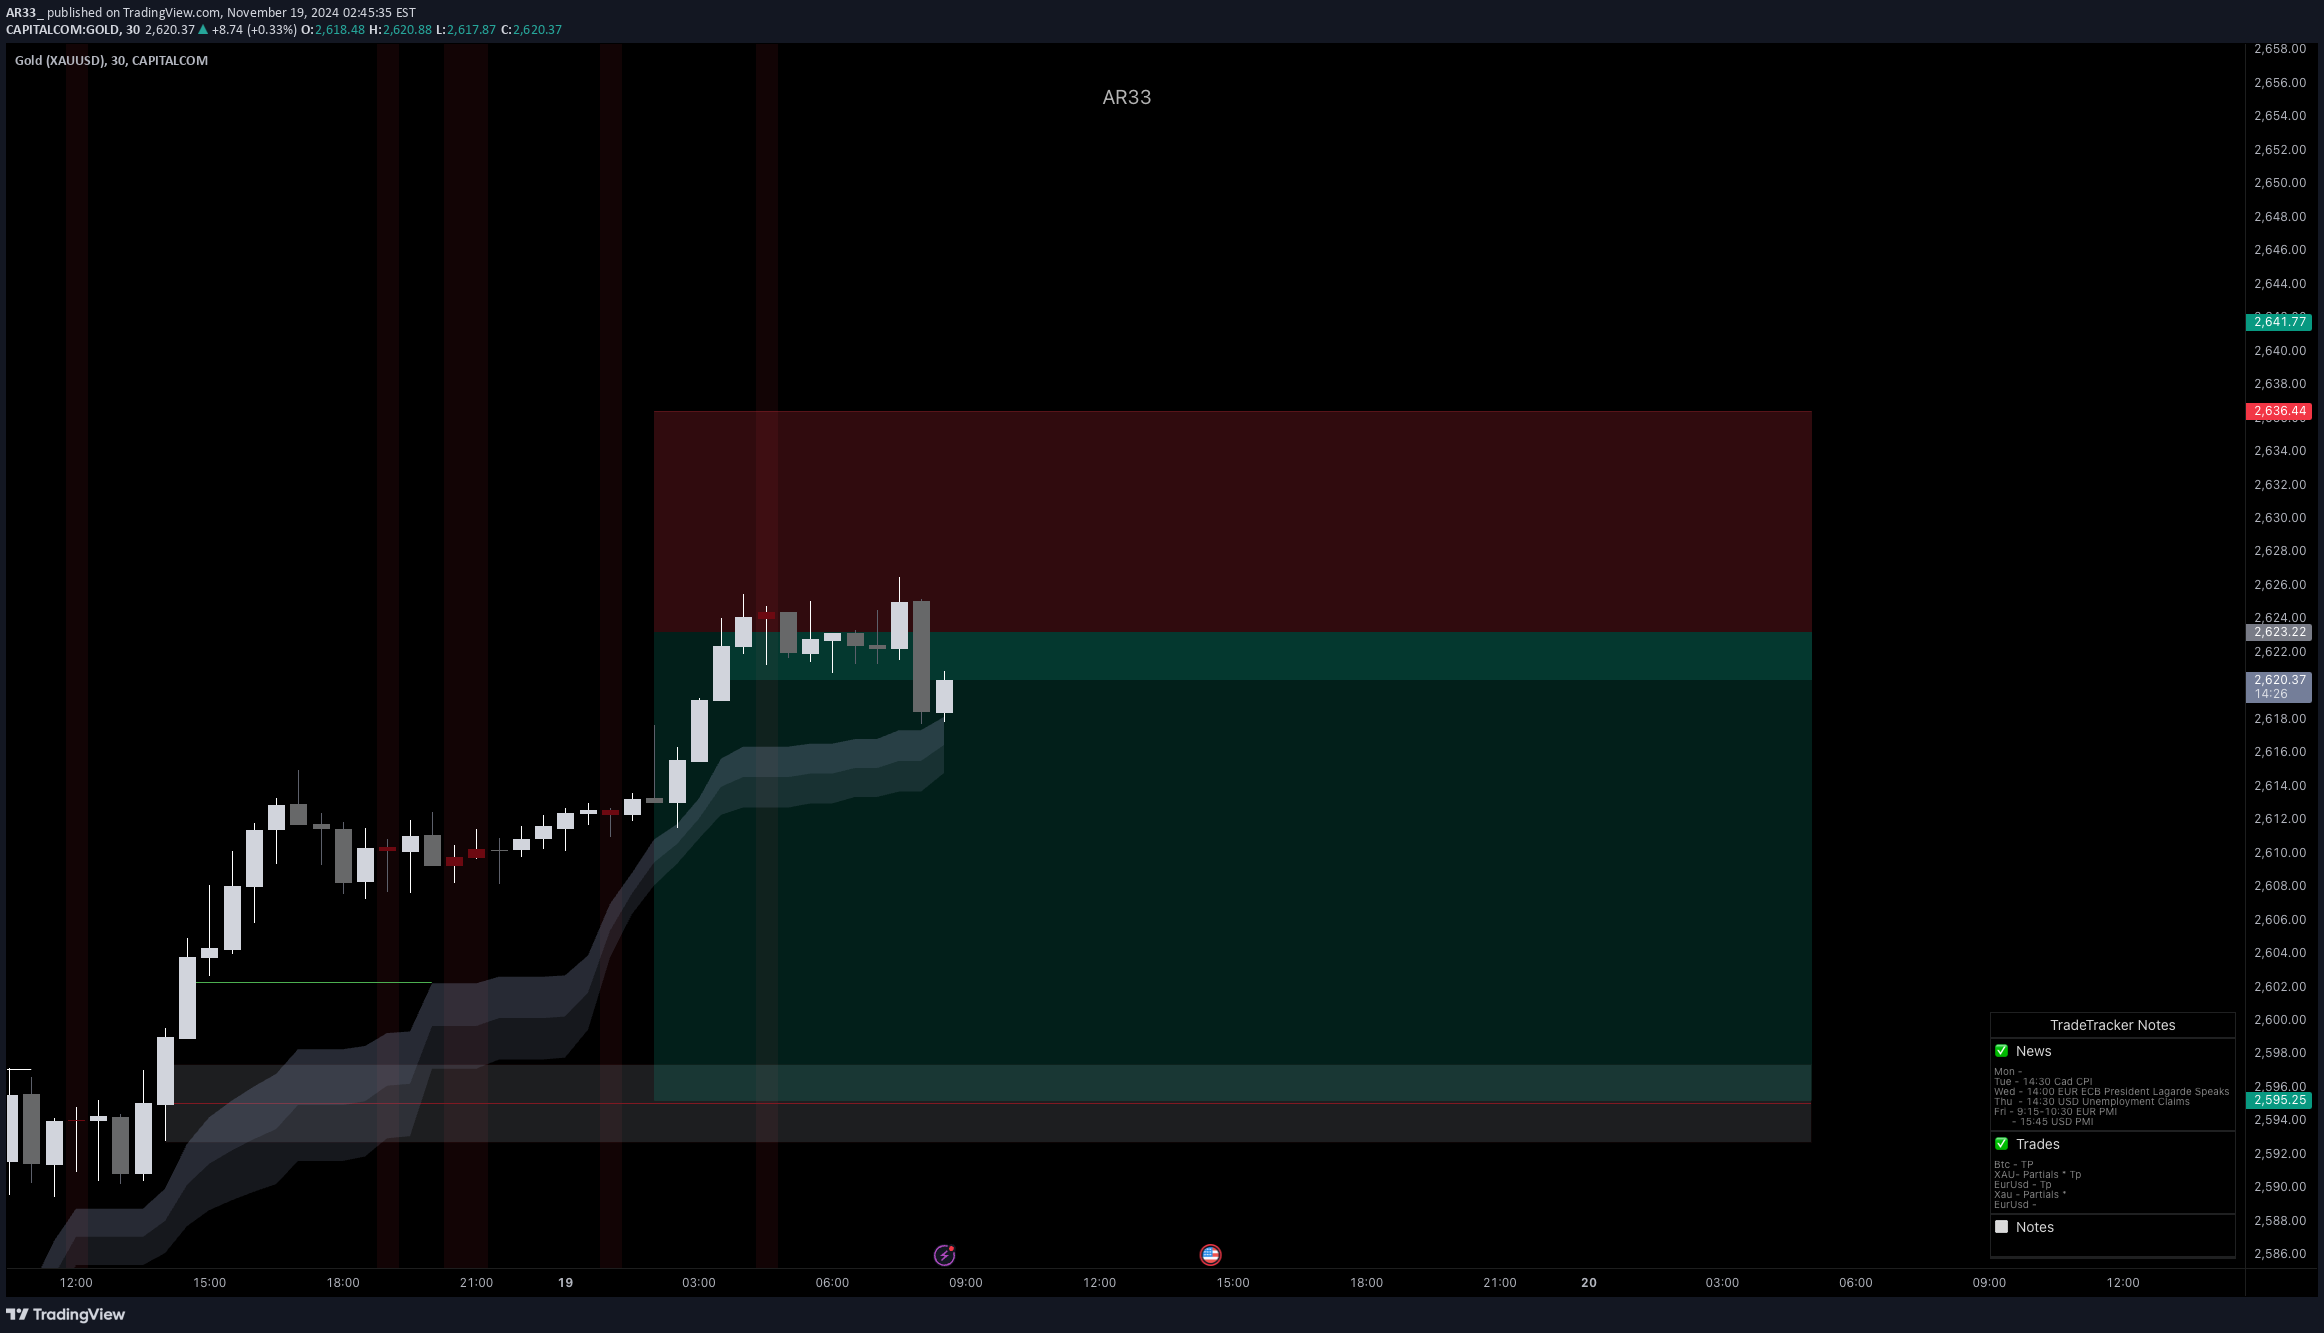
Gold (XAU/USD) Long Setup: First Swing of the Year Amid NFP Week
I initiated a long position on Gold (XAU/USD) following a retracement to the 0.6 Fibonacci level on the 8-hour timeframe. This setup marks the first swing trade on Gold this year, targeting the $2,680-$2,687 price zone. Gold opened the year on a bullish note, aligning with mid-range technicals. This trade reflects a mid-term outlook, aiming to capitalize on potential momentum driven by this week’s major macroeconomic events, including the Nonfarm Payrolls (NFP) release and the FOMC’s intervention.Fundamentals:The Federal Reserve’s hawkish tone, suggesting a slowdown in interest rate cuts for 2025, is providing upward pressure on US Treasury bond yields. However, these signals are driving flows away from non-yielding assets like Gold. Alongside geopolitical risks and trade war fears, this creates a complex backdrop for Gold. Additionally, the pullback in the US Dollar from its November highs is offering some support for the precious metal. Traders will closely monitor Friday’s NFP report and the December FOMC meeting minutes for further direction.Key bullish themes for metals:•Rising inflation expectations and the Fed’s pause in rate hikes support Gold.•China’s green initiatives boost demand for metals.•Interest rate cuts could provide further upside for Gold.•Stagflation fears increase Gold’s attractiveness as a safe-haven asset.Technicals:•Entry: Positioned after a 0.6 Fibonacci retracement.•Target Zones: $2,680 - $2,687.•Timeframe: 8-hour chart, aligning with the mid-range strategy.•Outlook: Maintaining a close watch on price action, especially with upcoming macro releases that could create volatility.Let’s keep the momentum strong and pay attention to market signals. Stay focused, and as always, pay yourself!Note: Please remember to adjust this trade idea according to your individual trading conditions, including position size, broker-specific price variations, and any relevant external factors. Every trader’s situation is unique, so it’s crucial to tailor your approach to your own risk tolerance and market environment.The position remains steady above our entry point as the first 8H candle of the session closes with indecision, reflecting a tug-of-war between buyers and sellers. On the order flow side, we observe a bullish divergence, hinting at potential upside momentum. However, it’s crucial to note that the outcome of this divergence is unpredictable. Patience and disciplined risk management are key. Let’s continue to monitor closely and let the market reveal its next move. Stay focused, and as always, pay yourself!Congratulations to everyone who took this trade! The first target has been reached, and profits are locked in. Stop-loss has been raised, transforming this into a risk-free trade moving forward. Enjoy your well-earned profits and stay focused for the next opportunities. Let’s continue to trade smart and maximize gains.The gold position has gained 2% profit so far, marking another opportunity to take partial profits. I’m raising the stop-loss to the $2,650 area to secure gains while allowing room for further upside. This trade showcases remarkable momentum, reinforcing the importance of disciplined trade management.The gold trade has been closed at $2,680, securing a solid 2.16% gain. This decision was made ahead of the NFP release to avoid unnecessary exposure to market volatility. Key Lesson: Protecting profits is paramount, especially when significant economic events are on the horizon. Enjoy the well-earned profits, and have a great weekend. Pay yourself – you deserve it!
AR33_
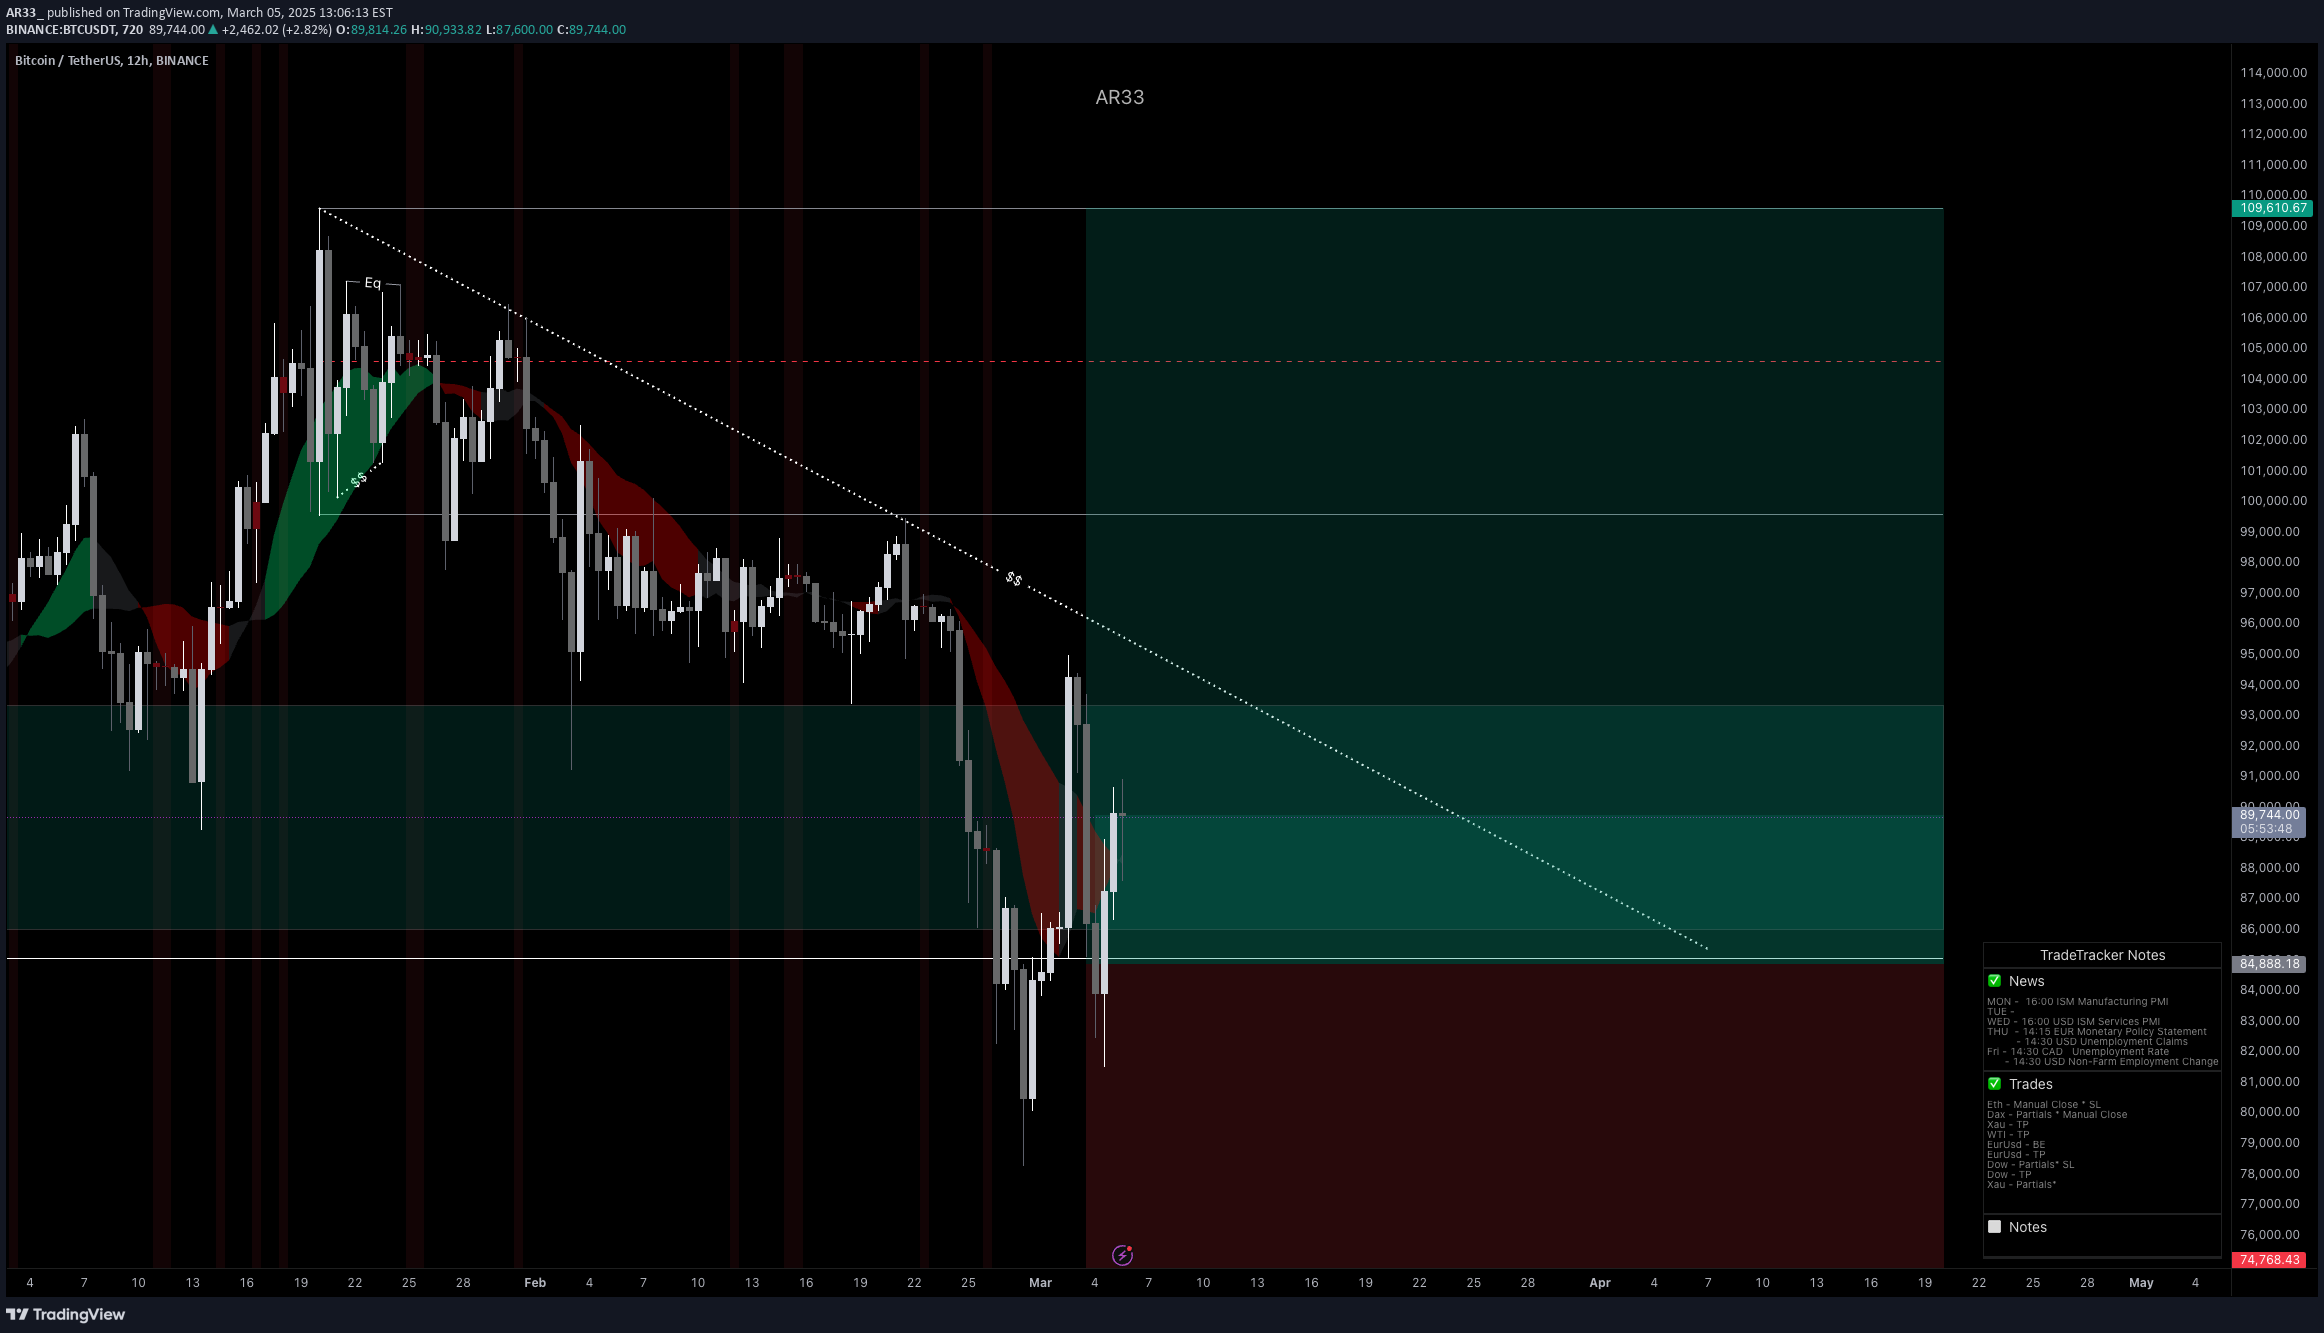
BTC/USD Short: FibCloud Rejection and 200MA Target
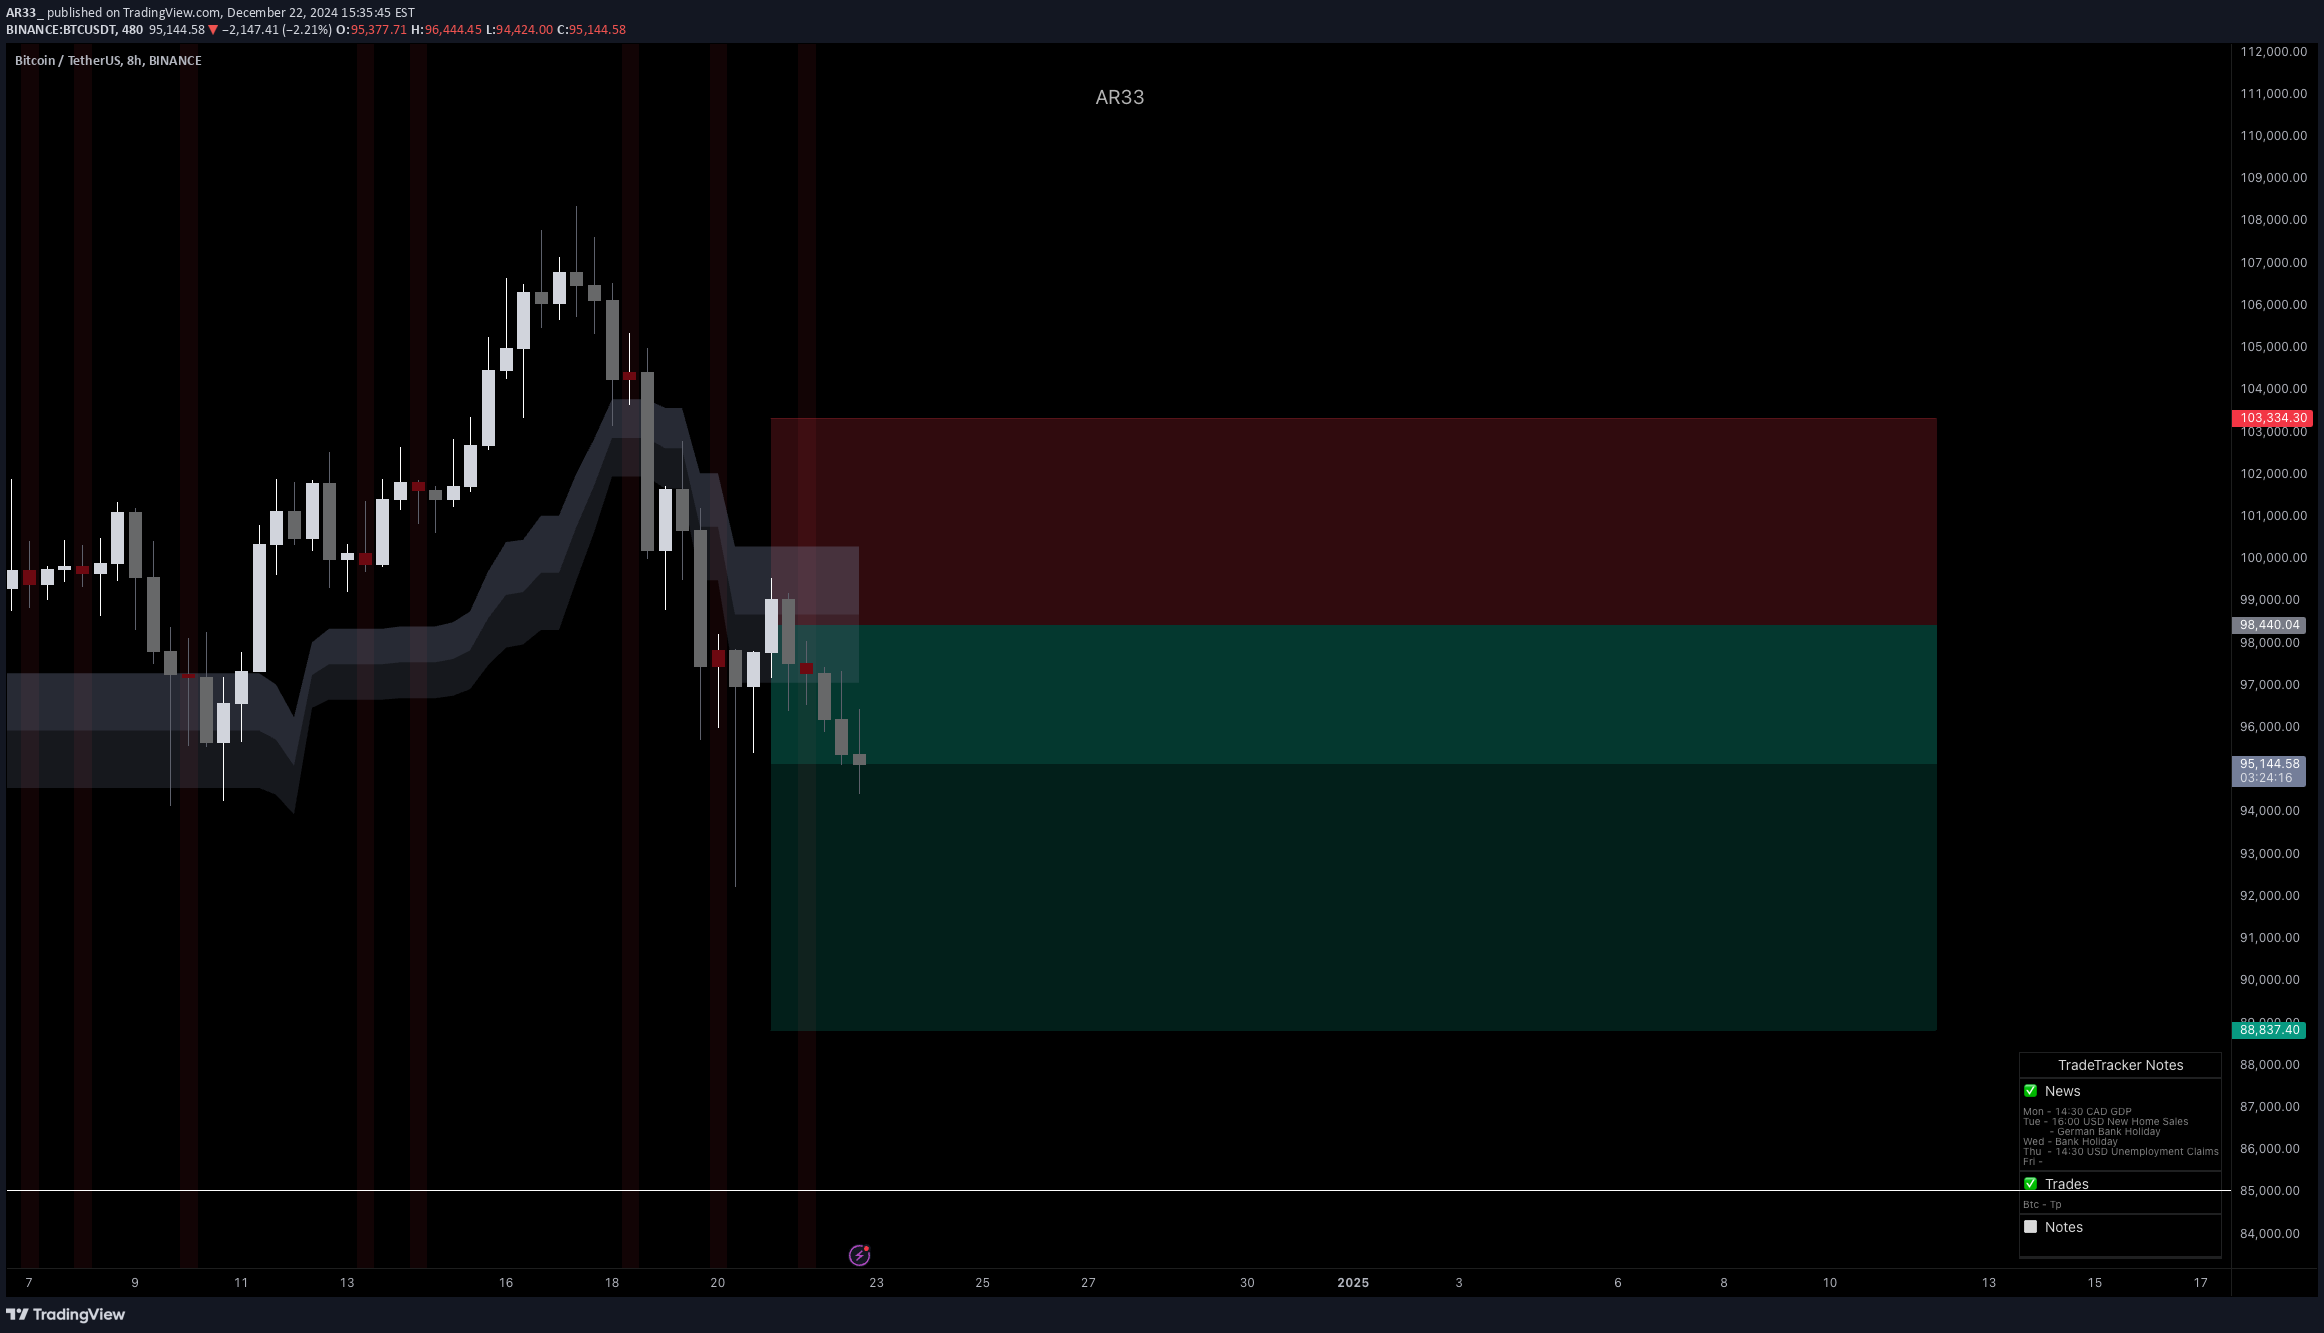
On the 8-hour BTC/USD timeframe, I have executed a short position following a clear rejection from the FibCloud, signaling strong resistance at this level. The price action showcases a classic flip of old support into new resistance, further solidifying bearish momentum.My target for this trade is the $90,000 price zone, aligning with the 200MA on the 8-hour chart. Additionally, order flow data confirms significant sell-side activity, with large orders clustered between the $90,000 and $89,000 levels, providing further confluence for this setup.The trade is structured to capitalize on the retracement move, with the potential for price consolidation or reversal upon hitting the 90K psychological and technical support zone.Technicals:•Entry Trigger: Rejection from FibCloud and resistance flip.•Target: $90,000 (aligned with the 200MA and key order flow levels).•Stop Loss: Positioned above the FibCloud to mitigate risk.•Order Flow Insight: Large sell orders between $90,000–$89,000 add weight to the bearish scenario.This setup emphasizes a disciplined approach to risk management, leveraging technical and order flow alignment for optimal execution. Stay sharp, and remember to pay yourself!Note: Please remember to adjust this trade idea according to your individual trading conditions, including position size, broker-specific price variations, and any relevant external factors. Every trader’s situation is unique, so it’s crucial to tailor your approach to your own risk tolerance and market environment.I’ve secured some profits at the 92,500 level, locking in gains as the trade now stands at 6% in profit. The position is officially risk-free, as I’ve adjusted to manage risk effectively going into the holiday season. This ensures capital safety while allowing the short trade to capitalize further if the market continues downward. Enjoy the trading week, stay sharp, and remember to pay yourself!The trade has returned to the entry price zone, which also aligns with the Point of Control (POC) of this range. I am now reconsidering whether to let this trade run further or close it at breakeven. Notably, there are still large orders below the 91k level, offering potential opportunities if the market dips. At this point, I only hold a small portion of my initial position, as I made it a low-risk trade by selling most of it earlier. This aligns with the cautious approach I adopted due to the holiday narrative. Enjoy the holidays, stay sharp, and always remember to pay yourself!BTC has yet to break below the 92.5k level, maintaining its consolidation range between 100k and 92.5k after rejecting the 97.5k price area on Friday. To manage the position effectively, I have adjusted my stop loss (SL) below the entry price, ensuring a profitable exit if the market trends higher. Stay sharp during these trading days and always pay yourself!BTC has tapped the 91k price zone, aligning with its demand zone and the Value Area Low (VAL) at 91.1k. To manage this trade effectively, I have adjusted my stop loss (SL) deeper into profit at the 95k price area. From this point onward, I will actively monitor the trade and close it manually if necessary to protect profits. Always pay yourself and stick to your trading rules!The trade has been closed manually at 92k due to significant buying pressure observed on the order flow. It was a good and straightforward trade, although I initially expected BTC to displace deeper, targeting at least 87k more swiftly before the start of the year. However, we always take what the market offers rather than force expectations. This marks a strong finish for the trade and a solid start to the year. Stay disciplined, manage risk effectively, and remember to pay yourself. Here’s to a successful trading year ahead—happy 2025!
AR33_
Gold Short: Capitalizing on Sunday Open Rejection
Gold has shown a strong rejection of the $2,650 price area after retracing to the Sunday open levels, aligning with the prevailing higher time frame (HTF) bearish trend. This trade is engaged to capitalize on the downside potential as the price fails to break the dynamic resistance at $2,650. With the support of the HTF momentum and a clear rejection, the trade setup focuses on targeting the lower support levels in the $2,610-$2,600 zone while maintaining a disciplined approach to risk management.Technical Analysis:Daily Chart:•Price struggles below the mildly bearish 20 SMA.•Both 100 and 200 SMAs maintain their bearish slopes, confirming the downtrend.•Momentum indicators remain neutral, supporting the absence of bullish reversal signs.4-Hour Chart:•XAU/USD trades below the flat 20 SMA while hovering near a directionless 100 SMA.•The 200 SMA around $2,690 acts as dynamic resistance, pushing prices lower.•Indicators are aligned with bearish momentum, suggesting further downside.•Support Levels: $2,626.70, $2,611.35, $2,598.70•Resistance Levels: $2,643.30, $2,655.00, $2,671.55Fundamental Analysis:The US Dollar’s strength continues to weigh on Gold prices, driven by robust macroeconomic data:•ISM Manufacturing PMI: Revised upward to 49.7, better than expected, supporting USD strength.•Wall Street Sentiment: Mixed trading as geopolitical tensions between the US and Russia persist.•Upcoming Events: Markets anticipate key US employment data, particularly the Nonfarm Payrolls (NFP) report on Friday, which could bring additional volatility to XAU/USD.Trade Management:•Entry near $2,645 with clear rejection signals.•Stop Loss: Placed above $2,659 to manage risk efficiently.•Targets: Initial take profit at $2,622, with a potential extension to $2,610.•Risk Management: Adhering to the bearish trend, the trade will be closely monitored, especially as the US Nonfarm Payrolls data approaches.•Risk Management: Trail stops as price moves lower. Monitor market reactions closely, especially around major support and resistance zones, and adapt as Nonfarm Payrolls approach.Note: Please remember to adjust this trade idea according to your individual trading conditions, including position size, broker-specific price variations, and any relevant external factors. Every trader’s situation is unique, so it’s crucial to tailor your approach to your own risk tolerance and market environment.The trade is currently at the breakeven point, fluctuating between profit and drawdown. Since Monday, the price has been ranging within the 2,634–2,656 zone. I am actively managing the position and will exit if there is a close below the breakeven level. With tomorrow expected to be a volatile trading day due to upcoming news, I plan to close the trade beforehand. The market appears to be preparing for these events.Gold has finally started moving, allowing me to close 90% of the position at 2,623. As mentioned in my earlier note, I plan to avoid being involved during tomorrow’s NFP release due to the expected high volatility. Having been in this trade since Monday, I decided not to take on additional risk. Overall, this was a solid move. I’ll let the remaining portion of the trade run into tomorrow to see if there’s further momentum. Pay yourself and adjust to the market dynamics accordingly.I have decided to fully close the position at 2,613, securing a 1.22% move in my favor. The market moved as anticipated, and I prioritized locking in profits without exposing myself to volatility. It’s been a productive trading week without unnecessary risk during high-volatility days. Enjoy the weekend and remember to always pay yourself!
AR33_
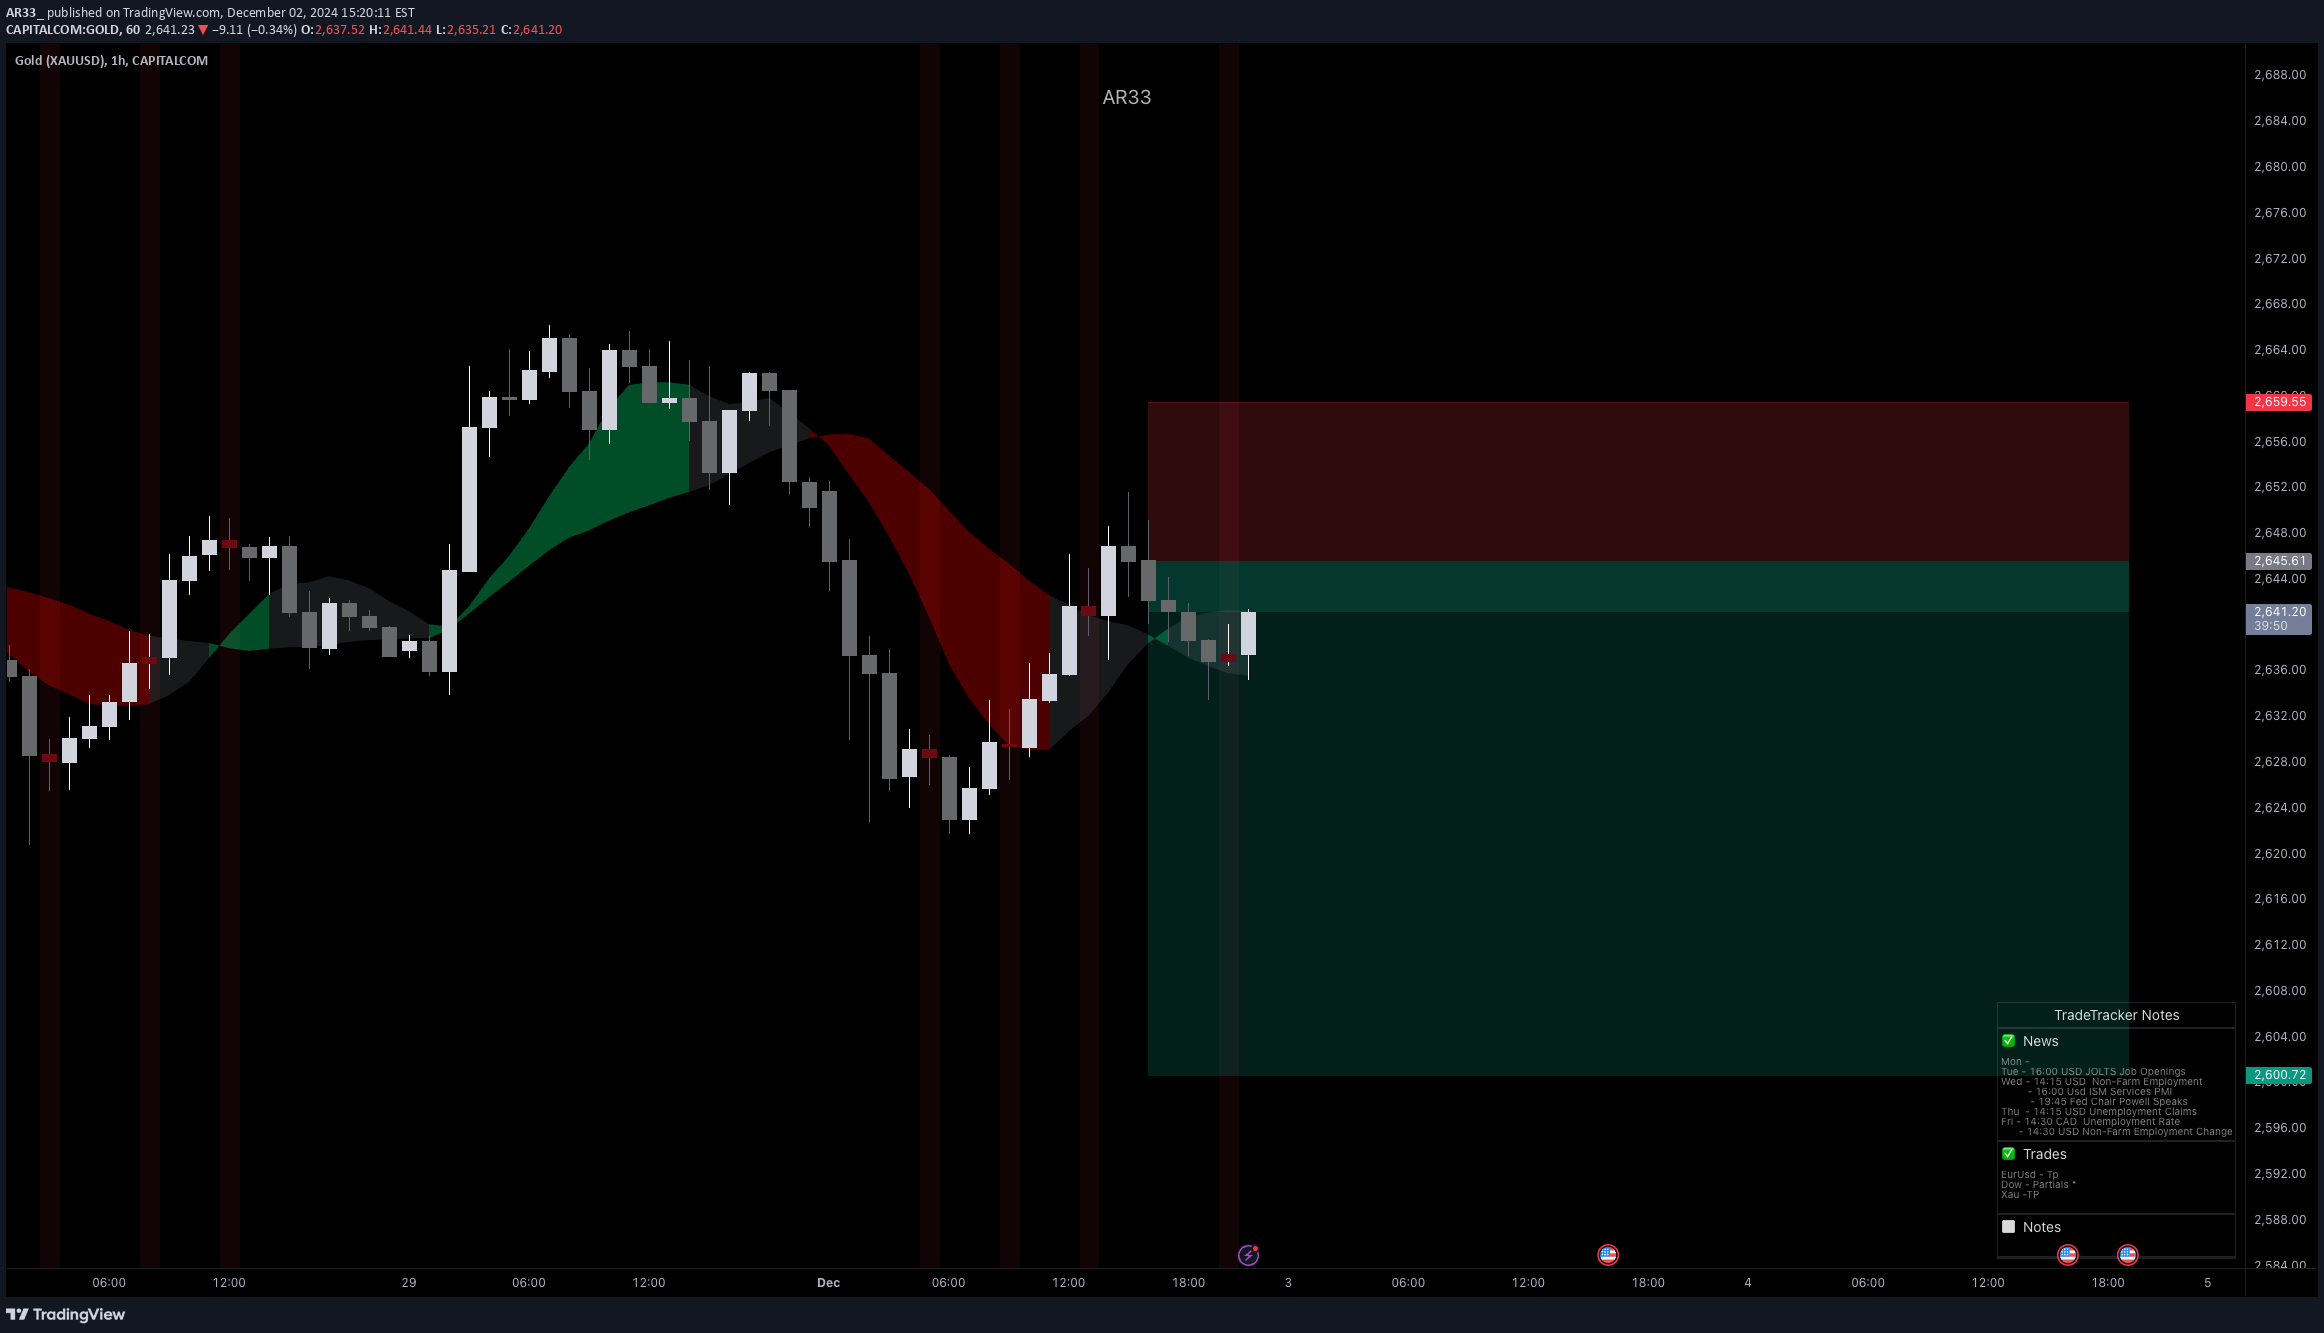
Gold’s Next Move: Short Trade Setup Amid Key Retracement
Gold has retraced to the 0.5 Fibonacci level within the cloud zone, trading above the 200 Moving Average (MA) on the 30-minute timeframe. While the smaller time frame shows a bullish structure, the higher time frame remains firmly bearish. This trade capitalizes on the short-term bullish momentum within the retracement phase, keeping the broader bearish trend in mind for risk management.Our approach is focused on capitalizing on the retracement for a short position while aligning with the overall bearish trend. If the price fails to hold key levels, a deeper bearish continuation is expected.Technical Analysis:•Retracement Level: Gold is at the 0.5 Fibonacci cloud level on the 30-minute chart.•Moving Average: Currently trading above the 200MA on the lower time frame, indicating temporary bullish momentum.•Higher Time Frame: Still bearish, reflecting a downtrend in the broader structure.•Recent Price Action: Gold surged 1.13% above the 200MA, then retraced into the cloud, testing support for the next move.•Trade Setup: Short-term bearish execution with targets aligned to the broader downtrend, capitalizing on the retracement level as an entry point while considering the smaller time frame’s temporary bullish momentum.Fundamental Overview:Gold prices rebounded in Asian trading, supported by easing US Treasury bond yields and a softer US Dollar. Geopolitical tensions between Russia and Ukraine and expectations of further stimulus measures from China provide additional support for gold. However, long-term concerns about US monetary policy and interest rate stability may weigh on the metal’s trajectory.Traders are closely monitoring signals from Federal Reserve policymakers regarding future rate hikes. Additionally, the market is cautious about potential ripple effects from Nvidia Inc.’s earnings on the broader sentiment.This trade takes advantage of the short-term bullish retracement on the lower time frame while staying aligned with the higher time frame’s bearish outlook. Proper risk management and vigilance toward key fundamental triggers remain essential.Note: Please remember to adjust this trade idea according to your individual trading conditions, including position size, broker-specific price variations, and any relevant external factors. Every trader’s situation is unique, so it’s crucial to tailor your approach to your own risk tolerance and market environment.I have decided to close the trade at a loss as soon as it reached the 2,626 level. The geopolitical headlines dominating the space, especially concerning nuclear war threats, have made the market highly unpredictable. As seen in the news: •“Russia warns of nuclear response due to Western missile use by Ukraine.” •“Putin signs new nuclear doctrine amidst escalating tensions.” Gold often reacts strongly to geopolitical uncertainties like these, and I prefer to minimize risk by cutting the trade early rather than letting it turn more negative. In volatile scenarios like this, caution is paramount. Manage your positions wisely and prioritize risk management over speculation. Stay safe and vigilant in your trades!
AR33_
BTC to100K: Riding the Bullish Breakout with Strong Fundamentals
BTC is currently showing strong bullish momentum, with both technical and fundamental factors in alignment. The trade aims to capitalize on this momentum towards the 100K level, with a cautious eye on potential selling pressure. Pay attention to the consolidation range, as further upward movement could solidify BTC’s path to the target.Technical Overview:•Trend: We are in a strong bullish trend, trading well above the 200MA, indicating sustained upward momentum.•Breakout & Retest: Recently, BTC saw a breakout and a successful retest, reinforcing this trend.•Range Consolidation: Currently consolidating within a range, with a low at 85K and a high at 93K. I’ve taken a mid-range entry to capitalize on any upward movement within this channel.•Plan: If sellers aggressively push the price above the 85K level, I will consider reentry opportunities aligned with price action.Fundamental Drivers:1.Global Adoption & Regulation: The Fed’s constructive stance on digital assets, combined with increasing demand and institutional adoption, is supporting BTC’s upward trajectory.2.Economic Conditions: As inflation and interest rates remain focal points, Bitcoin is being viewed as an inflation hedge. Additionally, El Salvador’s adoption of BTC as legal tender is adding to the credibility and mainstream adoption of cryptocurrency.3.Bitcoin ETF: The SEC’s positive outlook on a BTC-based ETF is expected to boost demand and further legitimize BTC within traditional financial markets.4.Geopolitical Factors: War-driven demand, potential sanctions on Russian money, and global financial uncertainty are all fueling demand for BTC as a decentralized, safe-haven asset.Note: Please remember to adjust this trade idea according to your individual trading conditions, including position size, broker-specific price variations, and any relevant external factors. Every trader’s situation is unique, so it’s crucial to tailor your approach to your own risk tolerance and market environment.he trade is progressing well, currently up by 3%. We witnessed a retracement on Thursday, coinciding with speeches by Powell and President Lagarde, which created some volatility in the market. Despite this, BTC remains resilient, respecting its structure and continuing to range between two defined levels. This range offers excellent opportunities for scalping, as price action remains predictable enough to profit on smaller timeframes. Starting Monday, we anticipate a clearer outcome for the ongoing trade as the market may decide on its next direction. Enjoy this incredible market environment to maximize profits, and as always, pay yourself when in profit!The trade is currently up by 9.7%. BTC has achieved a new high, and the level has been well-held. I’ve now moved my stop loss (SL) into profit at the 92k price zone. At 98k, I took my first partials. Moving forward, I will continue to trail the position. The next step will involve adjusting the SL to 97k once the price moves higher. This adjustment secures the trade as we approach the psychological 99-100k level, where sellers may begin to take profits. Due to platform limitations, I cannot add more detailed notes directly, but I will mark profits as they are realized. The trade, however, will continue running until my upper targets are met. A great trade, excellent price action—remember to Pay Yourself!
AR33_
BTC : Riding Asia Open Volume to the Golden Zone Target
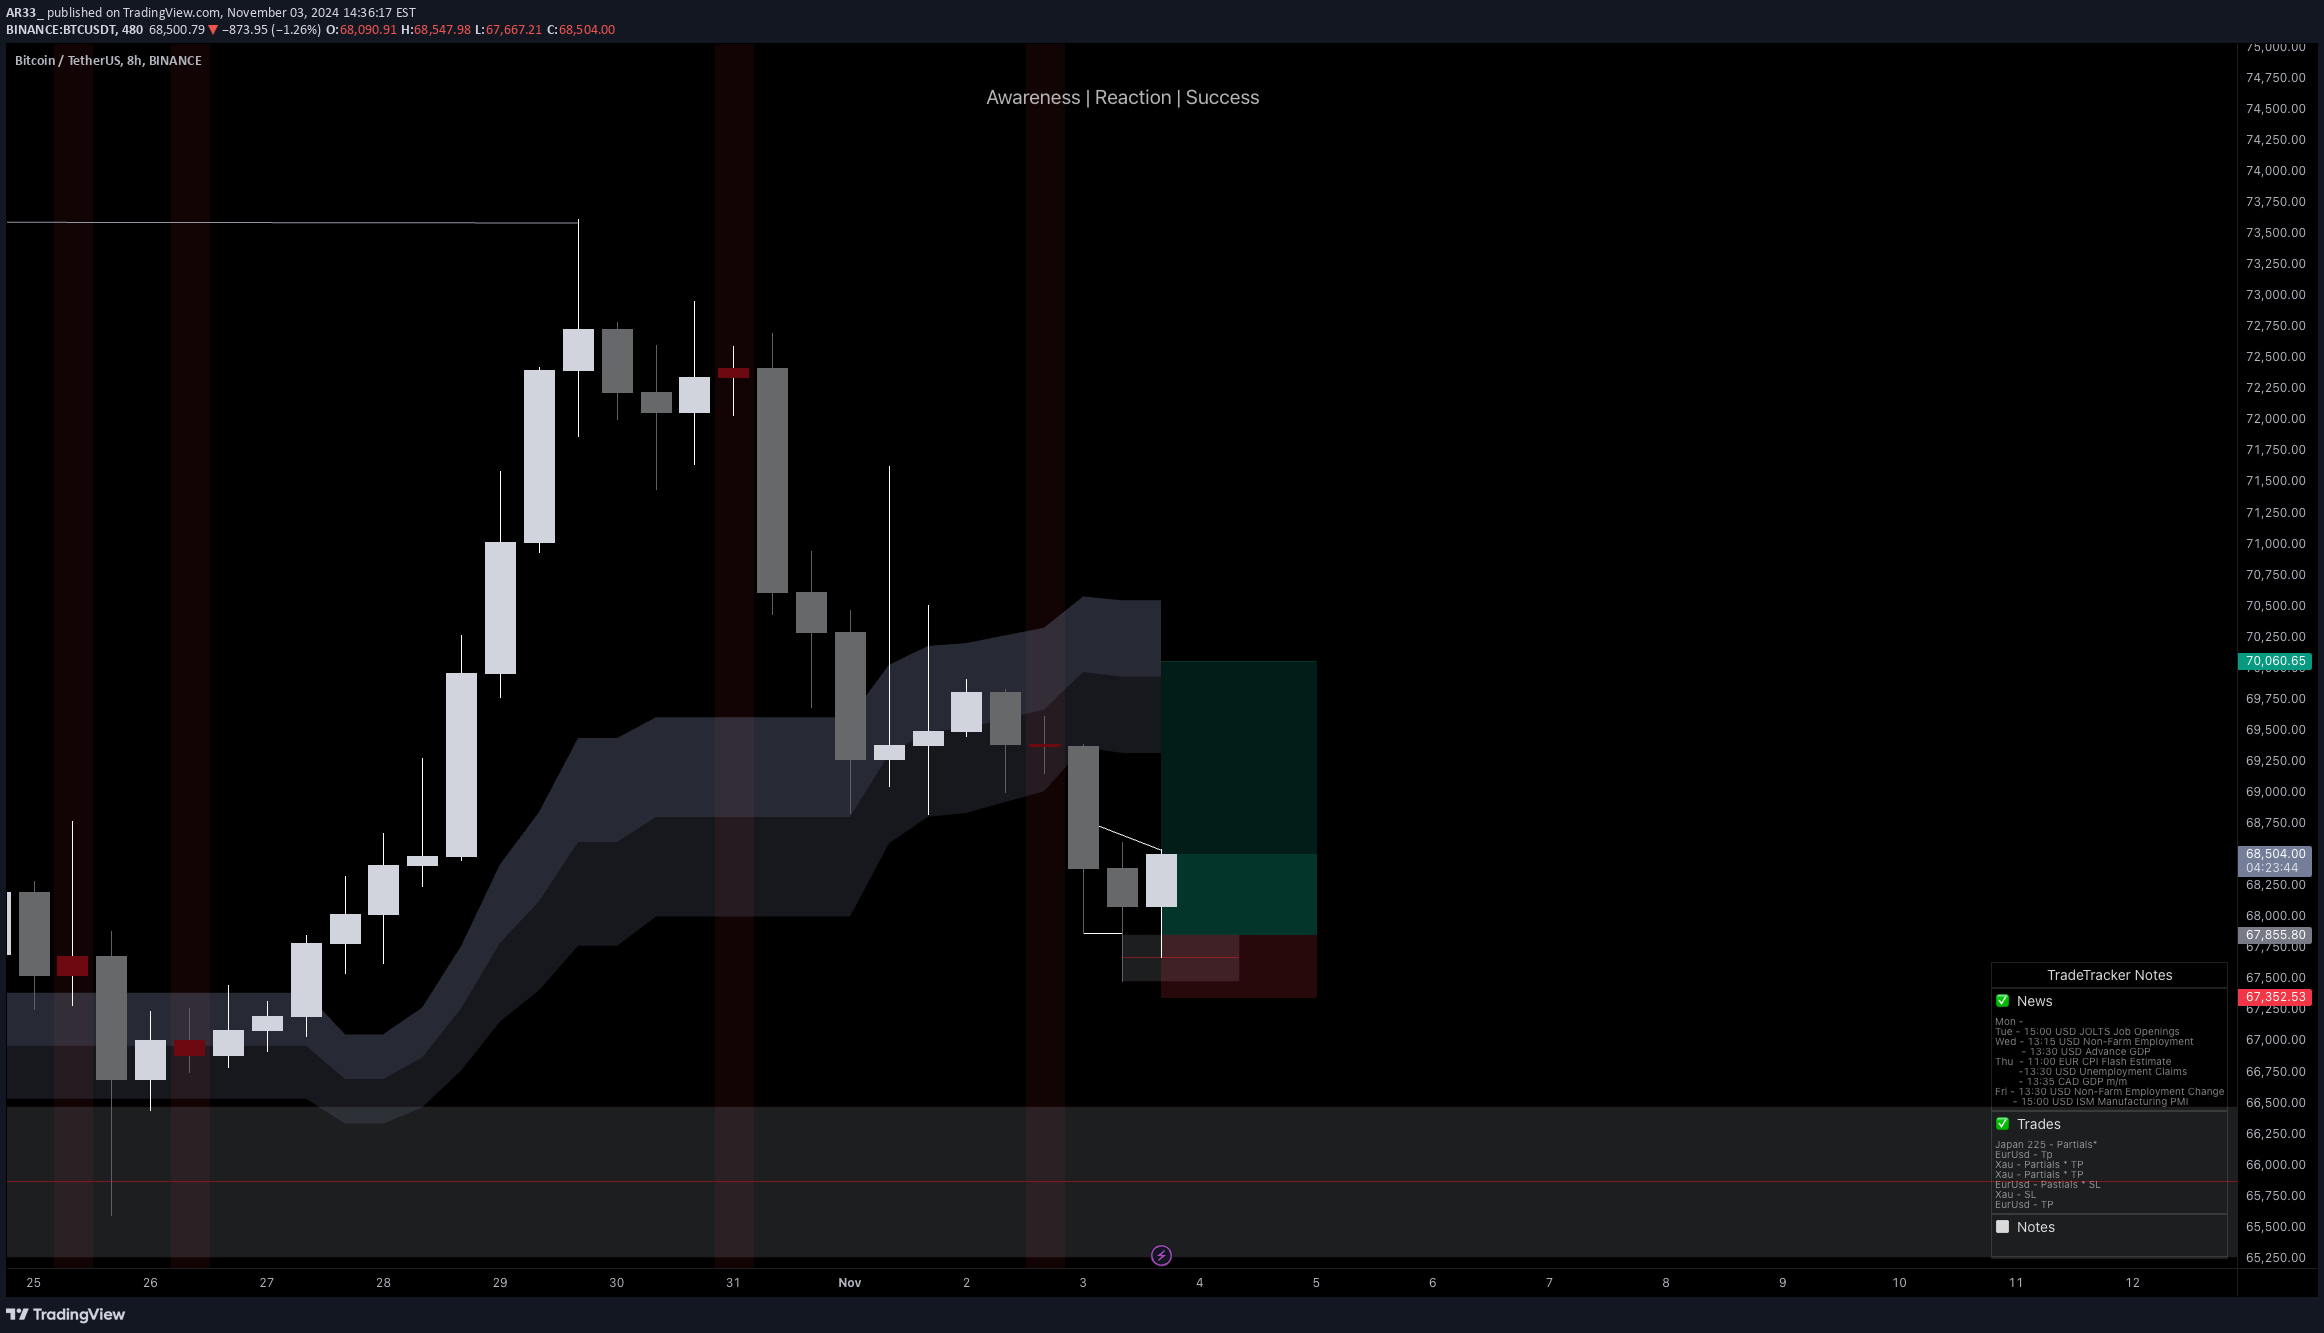
On the 8-hour chart, I’m targeting an entry to capture potential volume influx as the Asian markets open. I plan to take partial profits along the way, with a target to reach the $71,000 zone, which aligns with the golden Fibonacci retracement level.Fundamental Context:This setup is influenced by the buzz around the upcoming U.S. Presidential Election and speculation around Donald Trump’s potential reentry, possibly fueling a “buy the rumor, sell the news” effect. Given the high-impact events surrounding this period, I’m managing risk closely, aiming for strategic exits to maximize profitability within this volatile environment.Note: Please remember to adjust this trade idea according to your individual trading conditions, including position size, broker-specific price variations, and any relevant external factors. Every trader’s situation is unique, so it’s crucial to tailor your approach to your own risk tolerance and market environment.Closed 80% of the position at 69,200 with stop loss moved to breakeven. The price may face resistance around this level and the 200 MA, which could bring some rejection or consolidation. If the price continues to move higher, I’ll trail my stop loss to lock in more profits. This is now a risk-free, quick trade. Congratulations to everyone who followed, and remember to Pay Yourself!Since the last update, BTC has been ranging between the 200 MA and the 0.6 Fib retracement. On a smaller timeframe, a bullish structure has been forming over the past 9 hours. I’ve raised my stop loss slightly to secure more profits. If BTC breaks above 69,400, I’ll trail my stop loss further to capture potential continuation. Let’s remember that BTC has stabilized here following an 8% drop, so the high timeframe (HTF) outlook shows a different perspective. This trade is purely based on capturing quick volume from Sunday a few hours before traditional markets open, aiming to capture the volume from the sessions as they begin. Pay yourself and stay sharp!The trade hit its stop loss, and given the price action, this downside move was likely inevitable with large orders positioned down to the 64-63k range. For now, I’ll hold off on new BTC trades, letting it absorb the incoming orders over the next few days. Wishing everyone a productive trading week—remember, always Pay Yourself!
AR33_
Gold Short: Pullback from Overbought Highs
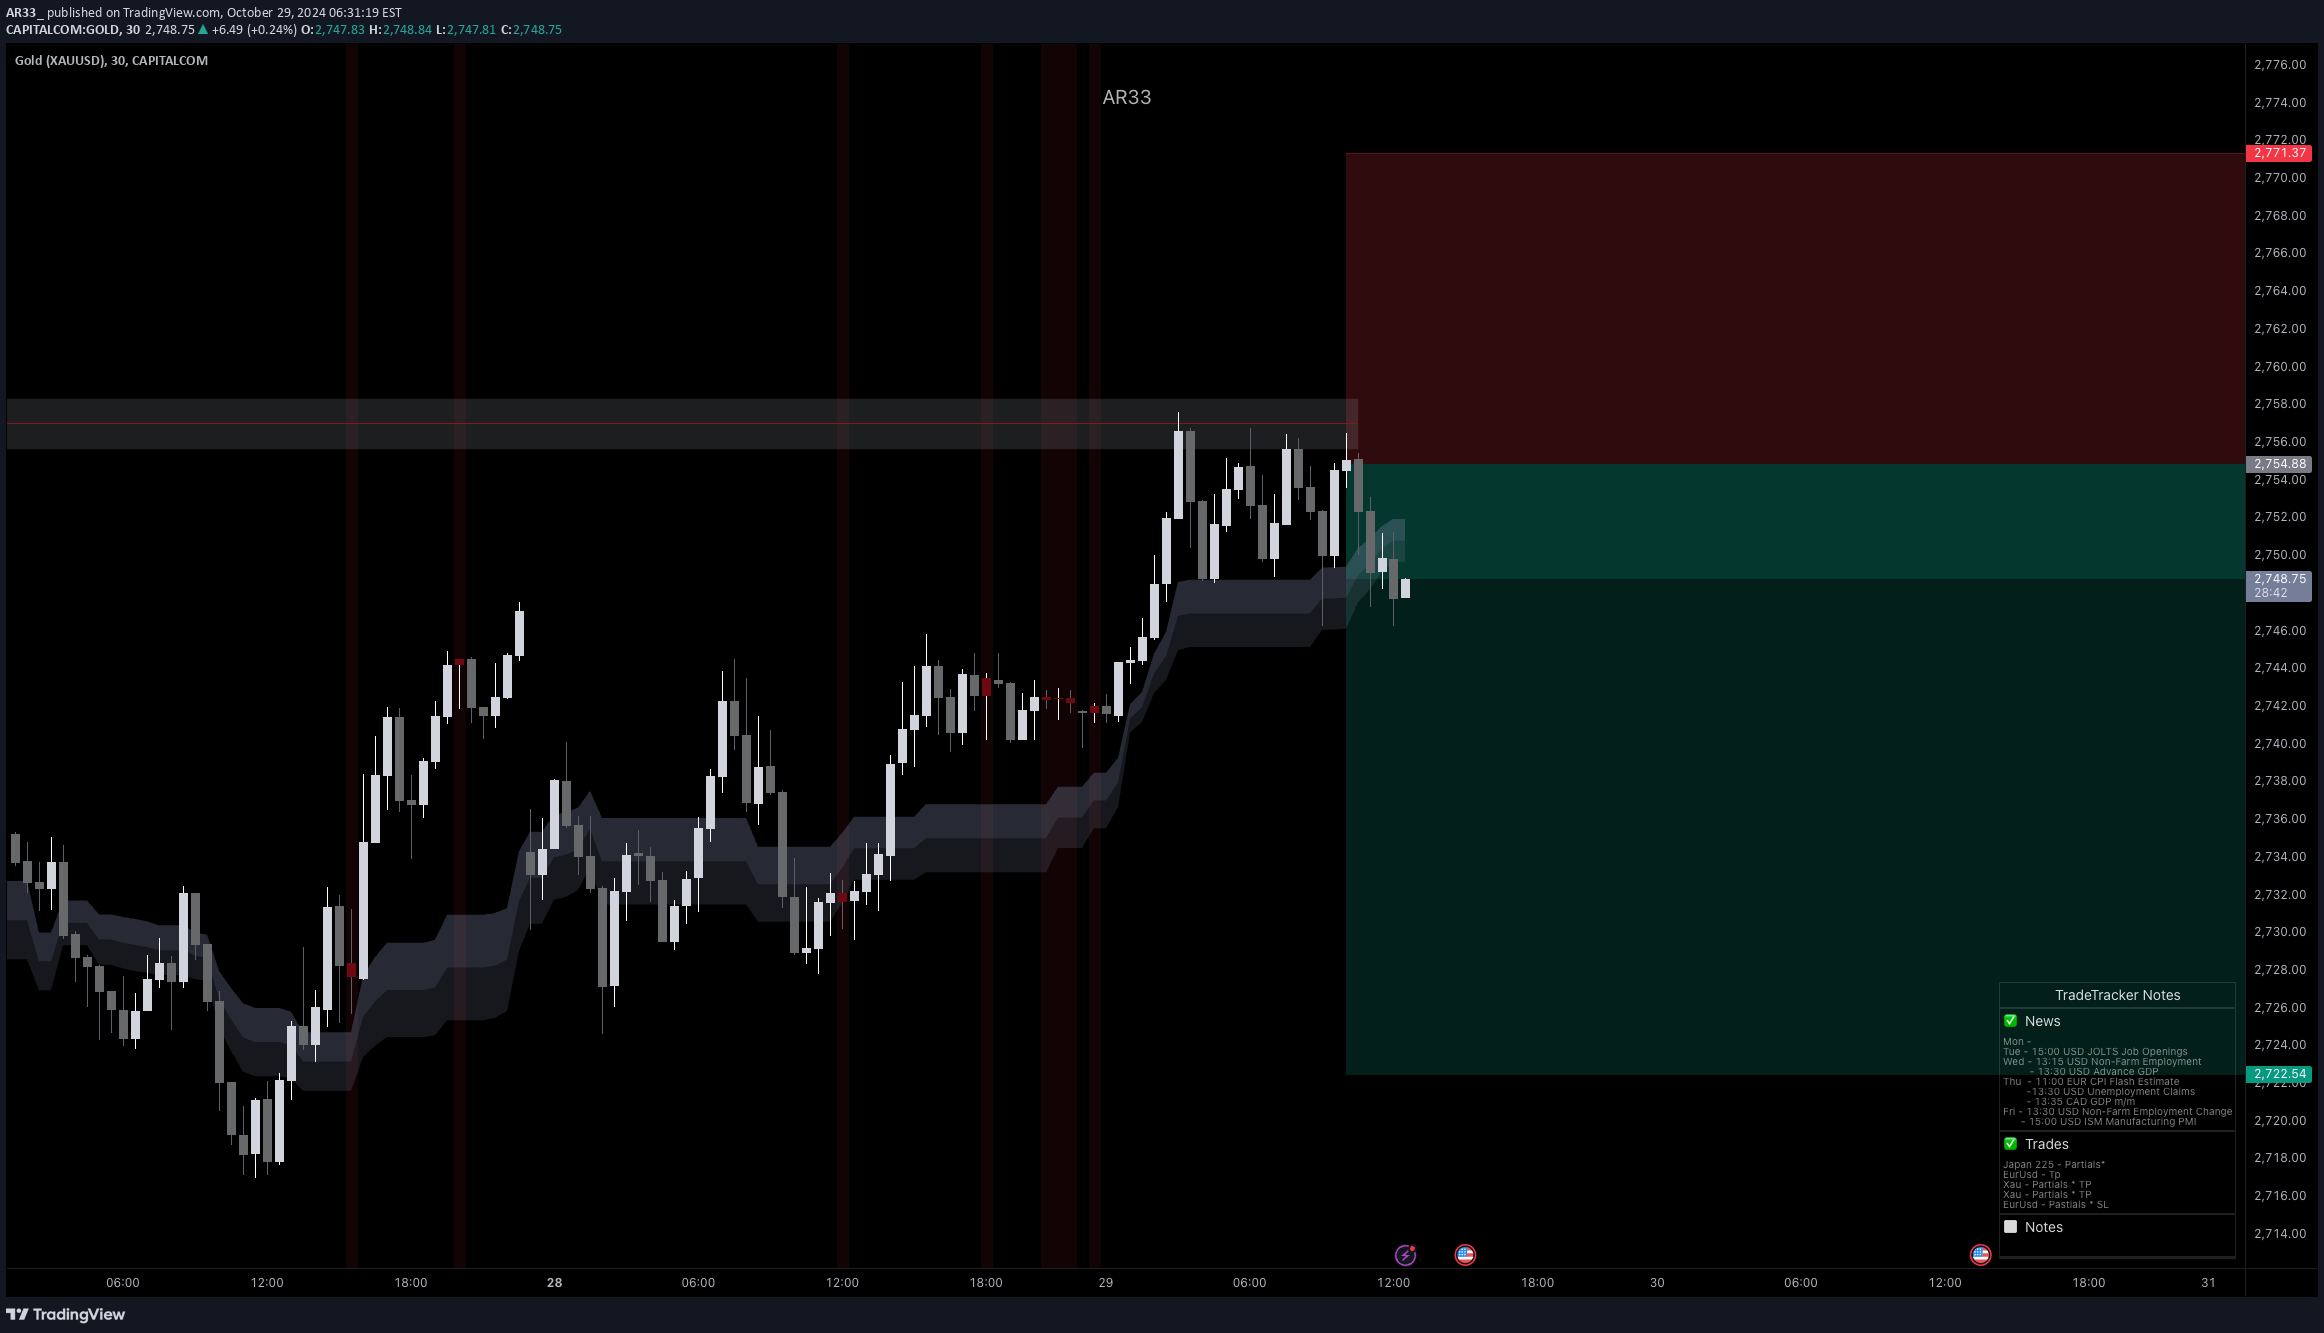
Currently, Gold (XAU/USD) is showing signs of nearing overbought levels, with price action testing the upper resistance channels on the 30-minute timeframe. A descending trendline aligns with key Fibonacci retracement zones, suggesting a potential reversal opportunity from recent highs around $2,764. In this setup, I’m monitoring price action around the trendline for any signs of rejection, which could indicate the start of a short-term downward movement.The Relative Strength Index (RSI) is approaching overbought territory, currently close to 69, which often signals an imminent pullback. This, combined with recent highs, gives a strong technical basis for a short position targeting a reversion to lower support levels.Fundamental Context:Fundamental factors are adding weight to this setup. Market sentiment remains risk-off due to persistent geopolitical uncertainties in the Middle East and a closely watched U.S. presidential election, both of which have driven safe-haven demand for Gold. Additionally, there is a 96% market expectation for a Fed rate cut of 25 basis points, creating a low-interest rate environment, further supporting bullish Gold sentiment.However, despite these bullish drivers, any signs of easing in geopolitical tensions or unexpected outcomes in the Fed’s rate decision could diminish the upward momentum. Combined with RSI overbought conditions, this presents a tactical opportunity to capitalize on a potential corrective move in Gold’s price.Trade Plan:1.Entry: Short position near the $2,755 resistance level.2.Stop Loss: Set above the recent high around $2,770 to guard against a false breakout.3.Target: Initial target at $2,720, with potential to add partials or adjust if price action shows signs of reversal.Note: Please remember to adjust this trade idea according to your individual trading conditions, including position size, broker-specific price variations, and any relevant external factors. Every trader’s situation is unique, so it’s crucial to tailor your approach to your own risk tolerance and market environment.
Disclaimer
Any content and materials included in Sahmeto's website and official communication channels are a compilation of personal opinions and analyses and are not binding. They do not constitute any recommendation for buying, selling, entering or exiting the stock market and cryptocurrency market. Also, all news and analyses included in the website and channels are merely republished information from official and unofficial domestic and foreign sources, and it is obvious that users of the said content are responsible for following up and ensuring the authenticity and accuracy of the materials. Therefore, while disclaiming responsibility, it is declared that the responsibility for any decision-making, action, and potential profit and loss in the capital market and cryptocurrency market lies with the trader.