
AHoboWithAStick
@t_AHoboWithAStick

What symbols does the trader recommend buying?
Purchase History
پیام های تریدر
Filter
Signal Type
AHoboWithAStick
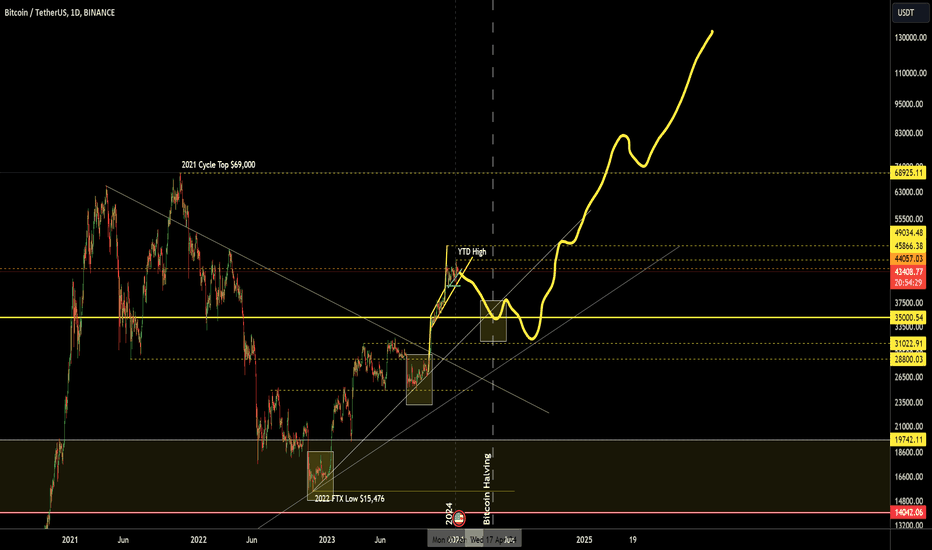
Just an idea on how BTC 's price action might play out over the next 12-18 months, going into the halving then starting the next halving cycle. Can definitely see this kind of price action playing out if the pending ETF approvals are all denied (January at time of writing) and the markets have to wait till the next possible approval window during the late spring period.
AHoboWithAStick
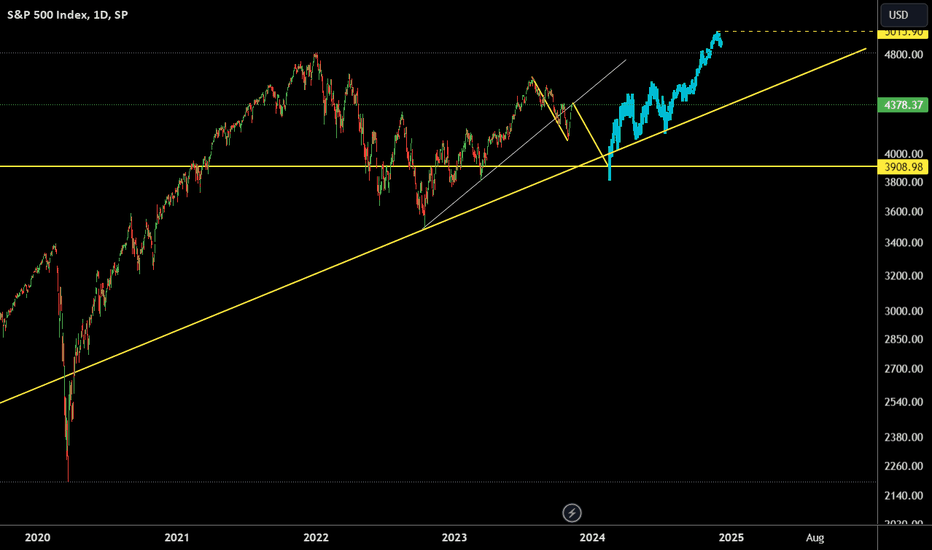
Just an idea on how the SPX could perform over the next 14 months
AHoboWithAStick
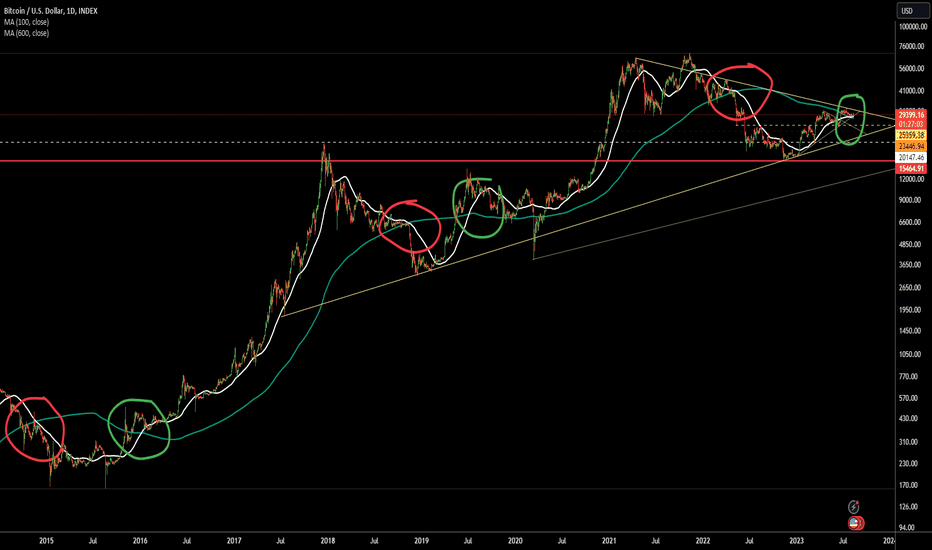
During the previous 2 cycles, once BTC 's 100d-MA fell below the 600d-MA (death cross), BTC 's price proceeded to capitulate to at or near the bear market lows. Once BTC 's 100d-MA moved above the 600d-MA (golden cross), the 100d-MA did not come back down below the 600d-MA until the following cycle's lows. Moving now to the current cycle, BTC 's 100d-MA once again fell below the 600d-MA on May 13 2023. BTC 's price then proceeded to capitulate down to the current cycle's low (~$15,473). Then on July 26 2023, BTC 's 100d-MA moved above the 600d-MA. Now we just need to wait and see if the trend holds. Confirmation won't be known until either the next bull cycle really kicks off, or if the 100d-MA is not able to hold above the 600d-MA before price can reach a new ATH. Death to the Golden Cross
AHoboWithAStick
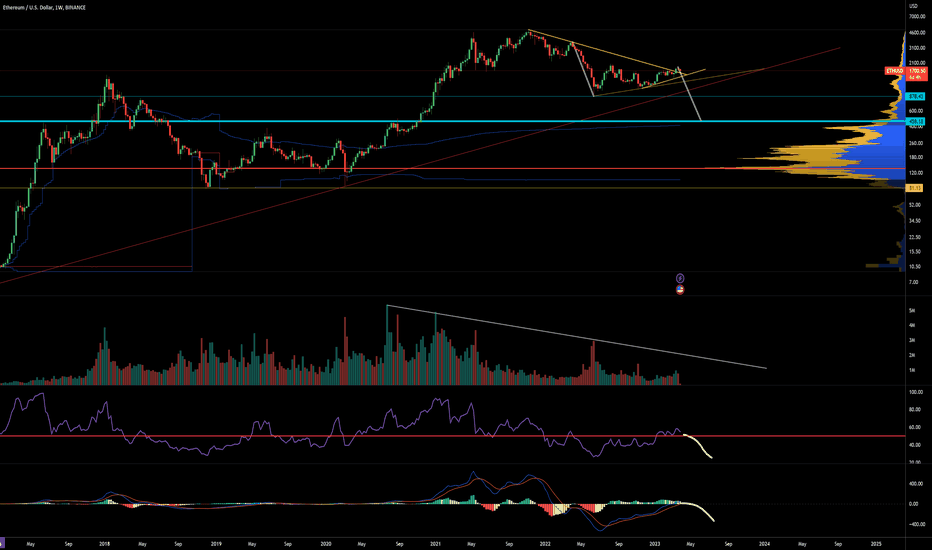
ETH weekly price chart still looks very bearish and the VRVP support doesn't really build out until sub $500. I still believe that this bear market is not yet over, and there is much more potential pain to come to the cryptoverse. Would love to be wrong, but the TA ain't lookin' great and there is still a regulation shit storm brewing on the horizon (albeit, the fundamentals are quite strong). Definitely going to place some layer-in buy orders sub $1,000 down to $500
AHoboWithAStick
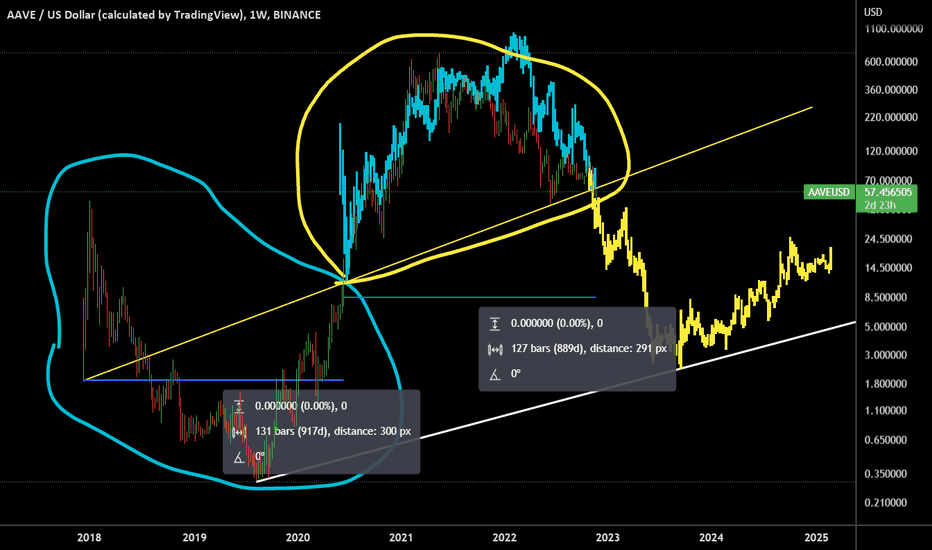
If you take an upward trend measurement from the 2019 lows for AAVE you get the white support line when extended to present. The yellow line that slices through the middle of the chart is a weekly average price line (WAPL). You can see that AAVE spent around the first 50% of its life below the WAPL(circled in blue), and the second 50% of its life above the WAPL (circled in yellow). You will also notice that the ratio of time from the genesis event(TGE)/time following the breakout above the WAPL, is approaching 1:1 (917 days & 889 days, respectively) If you then take a bar-pattern measurement of the first 50% of AAVE's life (TGE to breakout above WAPL), invert it, then place it at the point where it crosses above the WAPL, the resulting data (blue bar-pattern) fits eerily well to AAVE's price movements over the second 50% of its life. This then begs the question, "What happens if you apply the previous steps to the time AAVE's price was above the WAPL, and instead place it at the current point in time?" The answer to that question is the yellow bar-pattern you see on the chart. What's even more eerie is the fact that a breakdown below the WAPL, following this inverted fractal, would take the price of AAVE down exactly to the white upward support line we measured out at the very start. wack
AHoboWithAStick
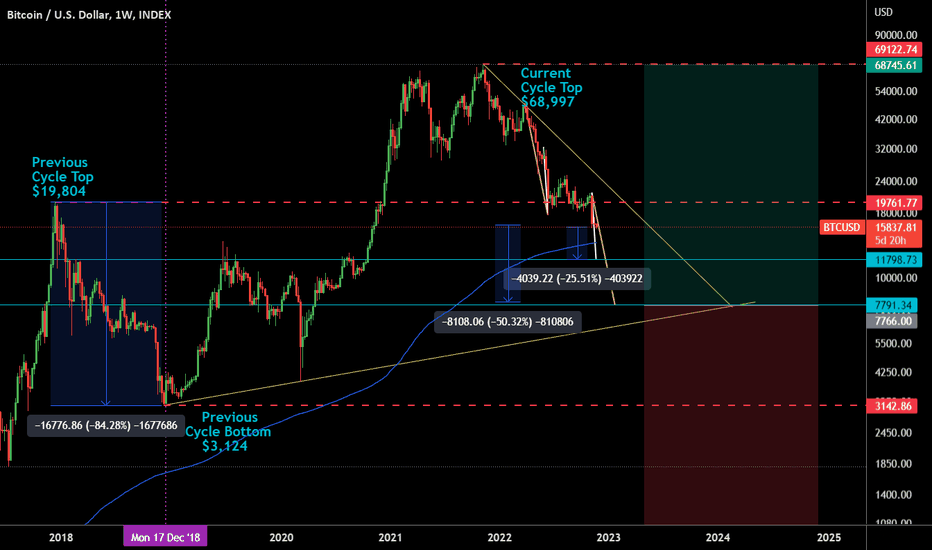
Some BTC technical analysis attempting to forecast possible bottom prices, as well as identify deep value buying opportunities
AHoboWithAStick

I spy with my little eye, a wyckoff accumulation pattern drawing out on the 4-Hr ETH/USD price charts. Will be interesting to see how it plays out. Just publishing this for personal tracking and learning.
AHoboWithAStick

Just a prediction on where I think Eth's price might head over the course of Q4 2021 and into Q1 & Q2 of 2022. The orange triangle is where I believe the current market cycle will reach its peak, before then pulling back for the remainder of the cycle (if this prediction plays out in any kind, I believe the price would retrace to current Q4 prices for support through the bear market).
Disclaimer
Any content and materials included in Sahmeto's website and official communication channels are a compilation of personal opinions and analyses and are not binding. They do not constitute any recommendation for buying, selling, entering or exiting the stock market and cryptocurrency market. Also, all news and analyses included in the website and channels are merely republished information from official and unofficial domestic and foreign sources, and it is obvious that users of the said content are responsible for following up and ensuring the authenticity and accuracy of the materials. Therefore, while disclaiming responsibility, it is declared that the responsibility for any decision-making, action, and potential profit and loss in the capital market and cryptocurrency market lies with the trader.