
ADSV11
@t_ADSV11

What symbols does the trader recommend buying?
Purchase History
پیام های تریدر
Filter
Signal Type
ADSV11
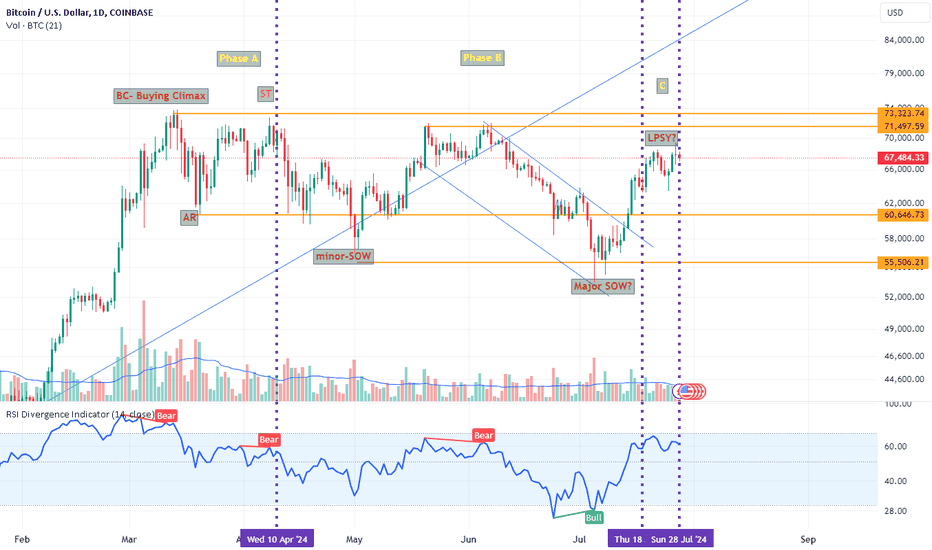
I've been tracking Bitcoin's recent movements, and I believe we're seeing a classic Wyckoff distribution pattern play out. Key Levels and Phases Phase A (Buying Climax - BC): We saw a significant buying climax, where the price reached a peak in the upper $70,000s. An Automatic Reaction (AR) followed, pulling back to around the mid $60,000s. Phase B: During this phase, the price oscillated between the mid $60,000s and the upper $70,000s, forming a series of Secondary Tests (ST) and minor Signs of Weakness (SOW). Notice the increased volatility and volume spikes, typical in this phase. Phase C: We might be in Phase C, where a potential Last Point of Supply (LPSY) is forming. The recent rally failed to break the resistance in the low $70,000s, indicating potential weakness. Diminishing Volume: The recent rally to the low $70,000s saw diminishing volume, hinting at a lack of buying interest. Bearish Signals Major SOW? The price broke below the minor SOW level (mid $50,000s) and bounced back, possibly confirming a major SOW. RSI Divergence: The RSI is showing bearish divergence with multiple bear signals since March. Trading Strategy Short Position: If the price fails to break above the low $70,000s again and shows bearish signs, consider entering a short position. Target the previous support levels around the mid $60,000s and mid $50,000s. Stop Loss: Place your stop loss just above the low $70,000s to manage risk. Remember, always do your own research and trade responsibly. Happy trading!More volumeincrease volume
ADSV11
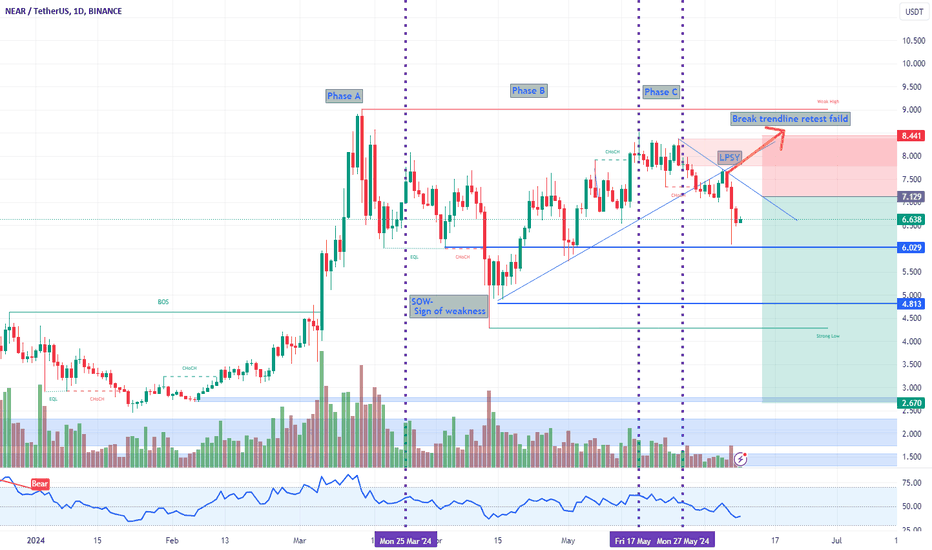
NEAR/USDT on the daily timeframe highlights the Wyckoff phases A, B, and C, indicating a potential short position setup. In Phase A, there is a break of structure (BOS) followed by a sign of weakness (SOW), suggesting initial bearish pressure. Phase B shows multiple tests of resistance and support levels, forming lower highs (CHoCH) and lower lows, signaling further consolidation and distribution. In Phase C, the final sign of weakness (LPSY) is evident as the upward trendline is broken, leading to a sharp decline in price towards lower support levels. The target price is set at 4.459 USDT, with a risk/reward ratio of 3.4. Key price levels include 6.029 USDT and 4.813 USDT, with a strong support zone around 2.670 USDT, making this a compelling short position opportunity.TP1 reach. hold 50% positionReshort with full positionClose 50% . Keep 50 to 2.6
Disclaimer
Any content and materials included in Sahmeto's website and official communication channels are a compilation of personal opinions and analyses and are not binding. They do not constitute any recommendation for buying, selling, entering or exiting the stock market and cryptocurrency market. Also, all news and analyses included in the website and channels are merely republished information from official and unofficial domestic and foreign sources, and it is obvious that users of the said content are responsible for following up and ensuring the authenticity and accuracy of the materials. Therefore, while disclaiming responsibility, it is declared that the responsibility for any decision-making, action, and potential profit and loss in the capital market and cryptocurrency market lies with the trader.