Technical analysis by readCrypto about Symbol ETH on 12/16/2025

readCrypto
Next Volatility Period: Around January 1, 2026
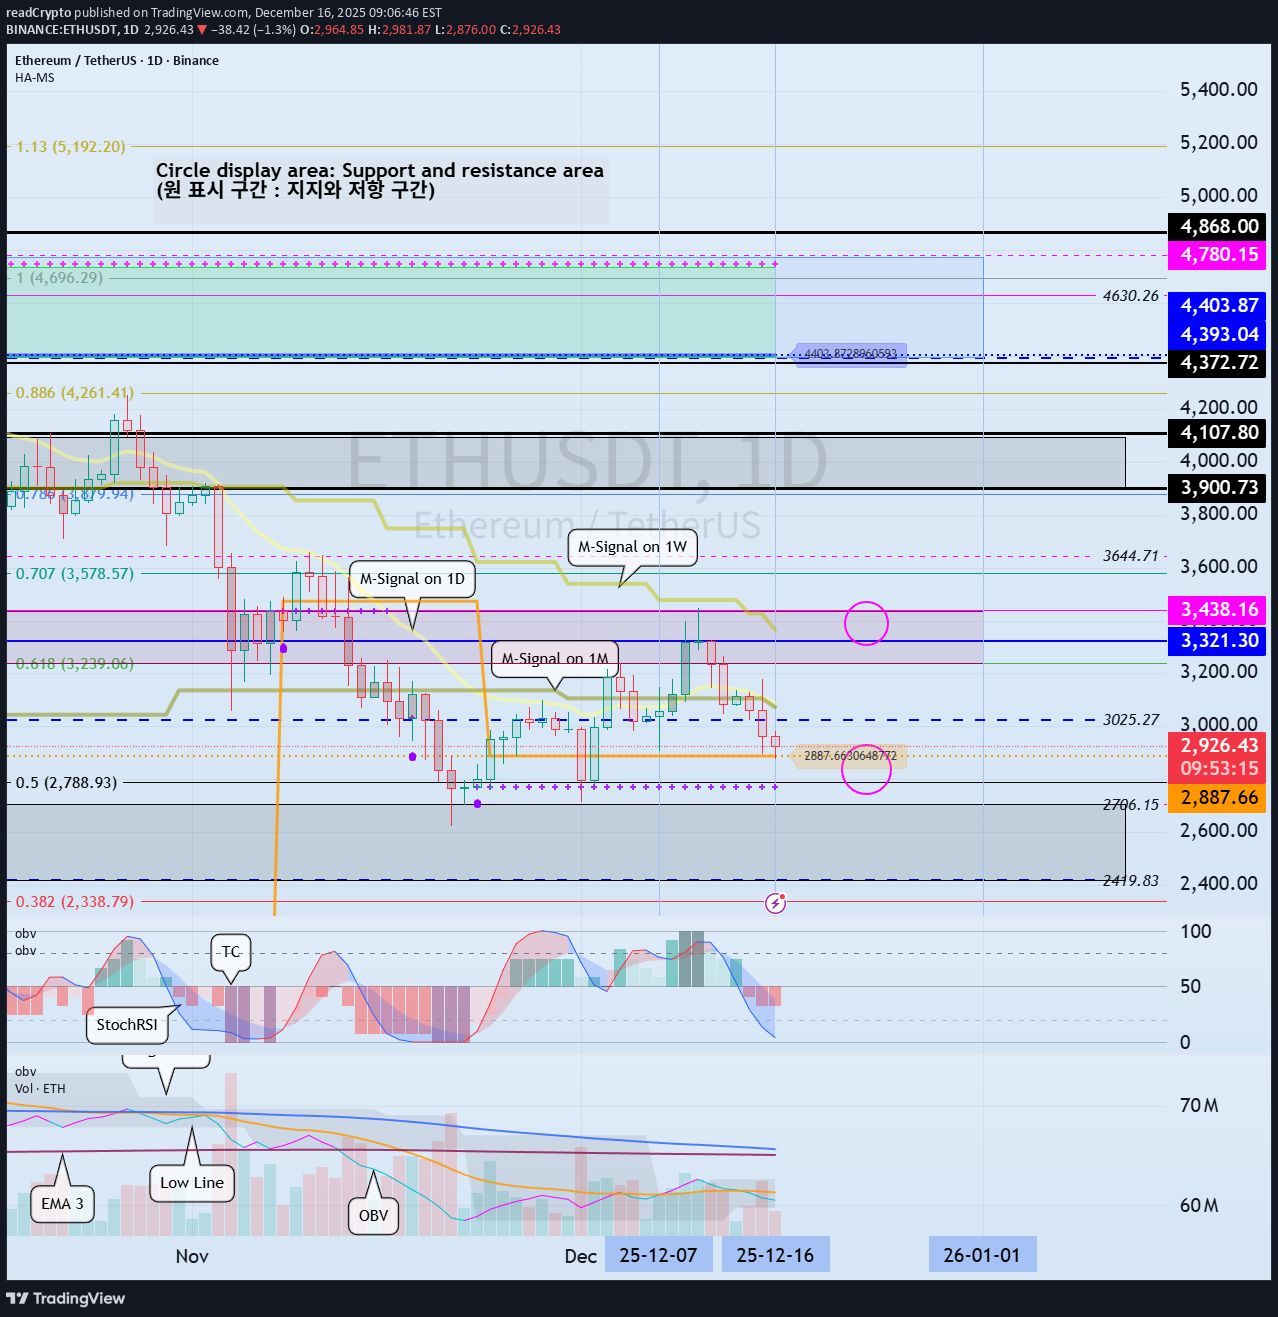
Hello, traders! Follow us to get the latest information quickly. Have a great day! ------------------------------------- (ETHUSDT 1D Chart) This volatility period is expected to last until December 17th. To initiate an uptrend, the price must rise above the M-Signal indicator on the 1M chart and remain stable. In this sense, the key is whether the price can find support near 2887.66 and rise above 3025.27 to maintain its upward momentum. However, a full-scale uptrend is expected to begin only if the price rises above the HA-High ~ DOM (60) range on the 1M chart (3321.30-3438.16). - From a trading perspective, trading below the M-Signal indicator on the 1M chart is difficult, so if possible, it's best to find a trading opportunity around 3025.27 based on the presence of support. In the medium to long term, you can buy in installments whenever support is found near the DOM (-60) ~ HA-Low range. Therefore, the timing for buying in installments is until support is found near 2770.12-2887.66. However, if the price declines from the DOM(-60) to HA-Low range, a step-down trend is likely, so you should consider a countermeasure. In other words, if you bought when the price was supported near the DOM(-60) to HA-Low range, you can sell a portion of your holdings when the price rises and then begins to decline, leaving the coins (tokens) corresponding to the profit. This can be done in installments. - To sustain the uptrend from a long-term perspective, the price must be maintained above 2419.83-2706.15. If this fails and the price declines, a long-term downtrend is likely, so you should consider a countermeasure. There are two types of declines: 1. Normal Decline This occurs when the price rises from the DOM(-60) to HA-Low range, forms the HA-High to DOM(60) range, and then declines. This decline is likely to continue until it reaches the DOM(-60) or HA-Low indicators, making it difficult to gauge the actual extent of the decline. Therefore, during a normal decline, it's difficult to determine the timing of a partial purchase, so caution is advised when making a purchase. However, other indicators and support and resistance levels can be used to estimate the timing. 2. Staircase Decline This refers to a further decline from the DOM(-60) to HA-Low range. Therefore, if the decline continues, the DOM(-60) or HA-Low indicators will eventually be encountered again, allowing for the timing of a partial purchase. However, because it's impossible to predict the frequency of this decline, split trading is necessary. When making a split trade, it's important to increase the number of coins (tokens) corresponding to the profit by engaging in short-term trading (day trading) at each split purchase price. At the same time, you should recover a portion of your principal to secure funds for future split purchases. - Among the declines mentioned above, the moment we should be interested in is when the second step decline occurs. In other words, it's worth considering trading when the DOM(-60) or HA-Low indicators are met. - Thank you for reading to the end. I wish you successful trading. --------------------------------------------------This chart shows a decline from the DOM(-60) to HA-Low range, ultimately forming a stepwise downward trend. At this point, since the price has fallen below the M-Signal indicator on the 1M chart, the first option is to wait without trading. Secondly, if you buy when support is found near the DOM(-60) to HA-Low range, you must sell some of your initial investment to recover your initial investment. Otherwise, if the price declines further, you may not have enough funds to buy, or the purchase volume may be too large, resulting in a high average purchase price. In fact, in the example chart, during the stepwise downward trend, it's difficult to see how the price rose after finding support near the DOM(-60) to HA-Low range. Therefore, there were virtually no opportunities to buy. It's possible that a buy was made when the HA-Low indicator formed at 0.00000 461. This is because the price rose above the M-Signal indicator on the 1D chart. When buying in a step-down trend, it's most important to sell in installments when you've made a profit or when the price falls below your stop-loss point to recover some of your initial investment. If you adhere to these guidelines, you'll likely recover losses more quickly or achieve significant profits.The HA-High ~ DOM(60) range, or the DOM(60) ~ HA-High range, or the range formed by the DOM(60) and HA-High indicators, is a sell zone. Also, the DOM(-60) ~ HA-Low range, or the HA-Low ~ DOM(-60) range, is a buy zone. Therefore, if the price declines from the DOM(60) ~ HA-High range and meets the DOM(-60) or HA-Low indicators, consider it a normal decline and observe how the wave forms again. However, it's better to consider the HA-Low indicator as a trading point rather than the DOM(-60) indicator. Looking at the current example chart, the DOM(-60) indicator is close to the current price level, while the HA-Low indicator is formed at a low price. Therefore, when the price rises above the DOM(-60) indicator, you should check whether the HA-Low indicator is generated to identify the support zone and determine the timing of a trade. If the price falls below the DOM(-60) indicator, there's a possibility of a further decline until the HA-Low indicator is met. Therefore, you should follow a segmented buying strategy during a stepwise downtrend. Since the price is maintained above the M-Signal indicator on the 1M chart, you can trade with less pressure.#ETHUSDT It's showing a normal downtrend, falling from the HA-High to DOM(60) range. We can resume trading when we meet the DOM(-60) or HA-Low indicators. However, if it falls below the 2419.83-2706.15 range, there's a possibility of a long-term downtrend. Therefore, if it falls below the 2419.83-2706.15 range, we should stop trading and observe the movement. This means that the 2419.83-2706.15 range represents an important support area. Therefore, if support is found in this area, we expect it to rise above the 3321.30-3438.16 range. The key question is whether the price can rise after finding support in the 2770.12-2887.66 range. The next volatility period is around January 1, 2026, but since BTC's volatility period is around December 23, we need to monitor the movement at that time. - The price must remain above the M-Signal indicator on the 1M chart to maintain a high probability of continuing the uptrend. If not, a long-term downtrend is likely, so profit taking is necessary. However, the actual trading timing may vary depending on the support area formed around the M-Signal indicator on the 1M chart. In other words, the M-Signal indicator on the 1M chart is currently hovering around 3025.27, but the key support and resistance zone is 2419.83-2706.15. Therefore, the final target range is 2419.83-2706.15. BTC and ETH are coins that can be held for the long term. Therefore, they are coins that can be purchased at any time as long as you have the necessary capital. If you don't have enough capital, it's best to sell some of your coins to secure cash and then buy them again when a favorable opportunity arises. However, the StochRSI indicator is currently in an oversold zone, making it an awkward time to sell. Therefore, the only option now is to buy more when support is found.