Technical analysis by norok about Symbol BTC: Sell recommendation (12/15/2025)

Bitcoin Price History Rhymes
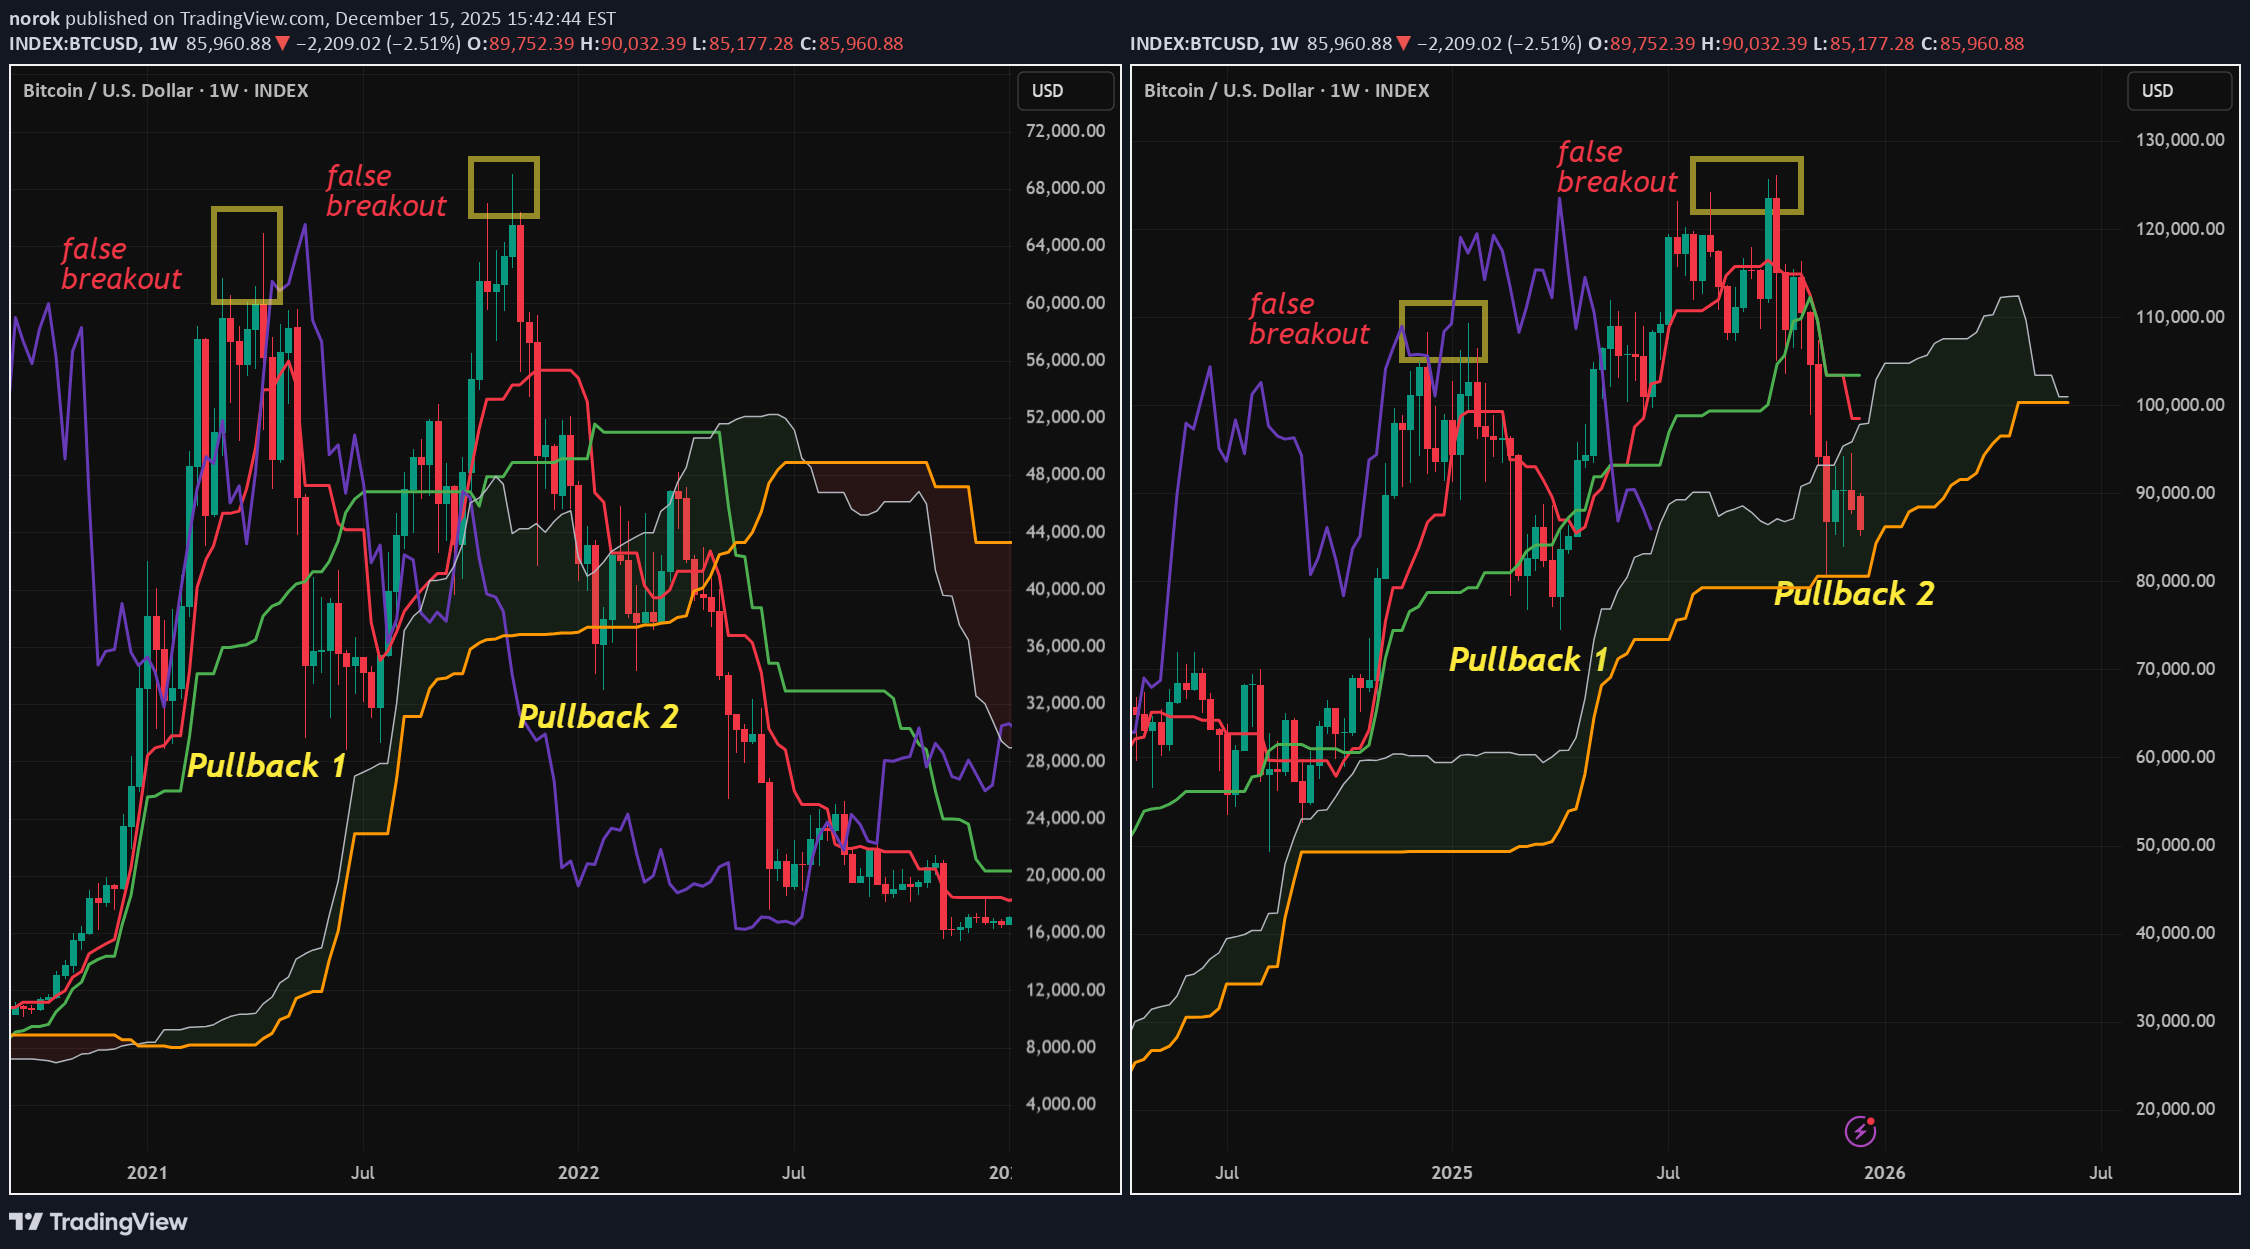
As I look at the chart for BTCUSD on the Weekly timeframe with Ichimoku overlayed the similarities to the 2021-2022 cycle top are eerie. Let's break down what I mean: The key indicator of Ichimoku is price relative to the Kumo Cloud. A trend on the respective timeframe begins when price is above the cloud. I also use Chickou as momentum for confirmation. This means that the current Bull trend of Bitcoin began officially on the Weekly in November 2023. The inverse to this rule is when price and momentum are on the opposite side of the cloud. The last Bear trend of Bitcoin began officially on the Weekly in May 2022. So we can see how close Bitcoin is to true Bearish territory; getting below 80k and staying there for a prolonged time. The other eerie similarity is the double false breakouts or "Spikes." If you learn ONE price action indicator remember the false breakout! There is no more reliable signal of reversal than when price makes a new high/low and then CLOSES back inside the prior range. Once again this year as in 2021 there were two such signals weeks apart. It means that the market stopped buying at critical moments where breakouts should have occurred if price were to continue. These false breakouts are past being tradeable now but everyone should take note of just how frequent and reliable these instances are.