Technical analysis by Thorne- about Symbol BTC: Buy recommendation (12/11/2025)

بیت کوین آماده انفجار؟ تحلیل تکنیکال راز کفسازی و سیگنالهای صعود قوی را فاش کرد
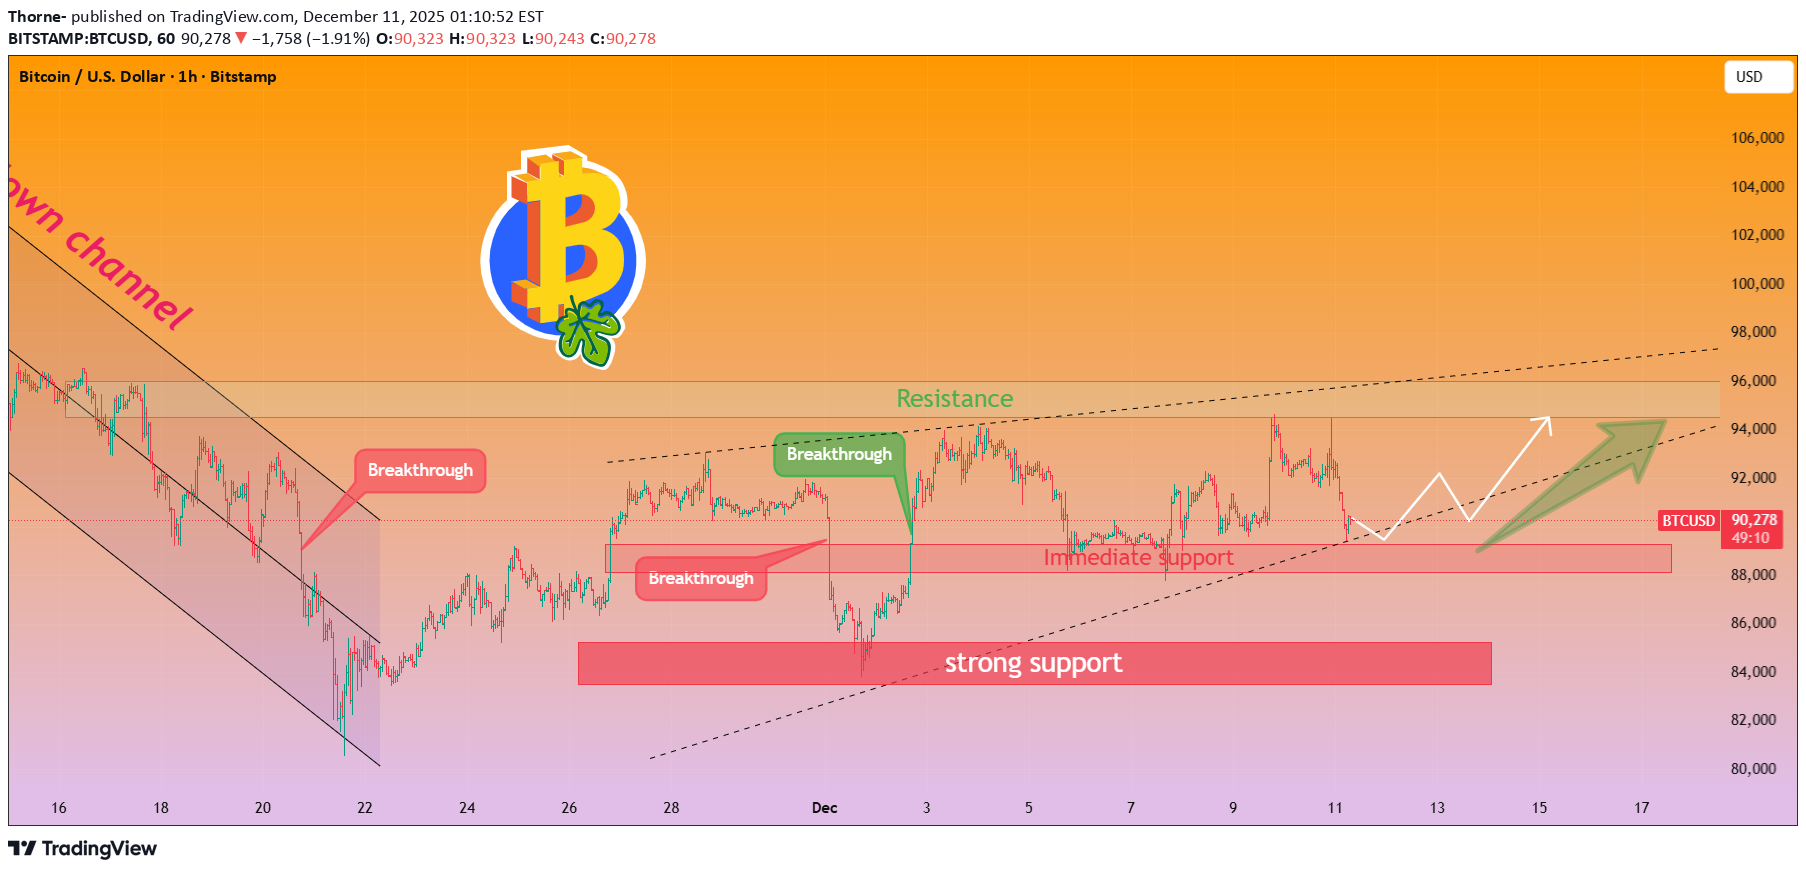
Bitcoin Technical Outlook: Bottom Structure Confirmed, Breakout Signals Emerging Bitcoin’s current price around $90,500 lies in a critical technical support zone, with three concurrent signals forming a strong bullish resonance. The bottom structure has been firmly established, and preliminary breakout signals are taking shape, laying a solid foundation for a potential upward movement in the short term. The detailed technical analysis is as follows: Daily Chart Trend: Oscillating Bottoming and Breakout Accumulation EMA15 Provides Immediate Support: Bitcoin has made a breakthrough above the daily EMA15 trend line at $90,800. Although the current price of $90,500 is slightly below this level, it stays close enough to form reliable immediate support. As a key short-term moving average, EMA15 reflects the recent market trend direction. The price’s proximity to this level indicates that the short-term upward momentum has not faded, and it is in a stage of consolidation before a potential further breakthrough. Bollinger Bands Contraction Signals Imminent Breakout: The daily Bollinger Bands are contracting sideways, which signifies a sharp decline in market volatility and a temporary balance between bullish and bearish forces. This is a typical "calm before the storm" pattern in technical analysis. Moreover, Bitcoin’s K-line has steadily held above the Bollinger Bands’ midline at $89,500. The midline, often seen as a barometer of short-term trends, with the price standing firm above it, reveals that the market’s internal center of gravity is shifting upward. This perfectly aligns with the characteristics of "oscillating to build a bottom and accumulating momentum for a breakout", suggesting that the bulls are gradually gaining the upper hand during the consolidation phase. 2 - hour Chart Indicators: Momentum Recovers with Ample Upside Room MACD Momentum Rebounds: On the 2-hour chart, Bitcoin’s MACD momentum has shifted from weakening to strengthening. This indicator acts as a "microscope" for market momentum. The recovery of MACD momentum implies that the bearish momentum in the short term has been fully released, and the bullish forces are gradually gathering strength. If the MACD forms a golden cross and the red bars continue to expand subsequently, it will further confirm the start of a short-term upward trend. RSI in a Healthy Range: The RSI indicator on the 2-hour chart has moved out of the oversold zone and has not entered the overbought range (above 70). As a "thermometer" for market sentiment, RSI’s current position indicates that the market has shaken off the overly pessimistic sentiment without falling into excessive optimism. There is sufficient space for further upward movement in the price. This also means that the subsequent upward trend may be more sustainable, avoiding the risk of a pullback caused by an immediate overbought state. Support and Resistance Zones: Solid Bottom and Clear Breakout Targets Solid Multi - tiered Support System: The $88,000 - $89,000 range serves as a recent high - volume trading zone. A large number of trading orders concentrated here form a natural support barrier. In addition, the underpinning of large - scale on - chain capital at this level further strengthens the support. This zone acts as a robust bottom defense line, which is expected to effectively block downward price movements and prevent a sharp decline. Together with the nearby $90,500 support and the $89,500 Bollinger midline, they form a multi - tiered support system that greatly reduces the downside risk for the bulls. Clear Resistance and Breakout Significance: The key resistance zone is concentrated between $93,600 and $94,200. This zone overlaps with the EMA30 resistance and a critical Fibonacci retracement level. EMA30, as a medium-term trend line, usually brings significant selling pressure when the price approaches it. The Fibonacci key level is also a position where the market is prone to profit - taking. However, if Bitcoin can break through the $93,600 - $94,200 range with sufficient trading volume, it will mean the complete end of the short-term consolidation phase. It will break through the medium-term technical constraints and open up a smooth upward channel, paving the way for a new round of upward movement. Bitcoin trading strategy buy:89000-90000 tp:91000-92000-95000 sl:88000