Technical analysis by SMC-Trading-Point about Symbol BTC: Sell recommendation (12/7/2025)

SMC-Trading-Point
BTC/USD) Bearish trend analysis Read The caption
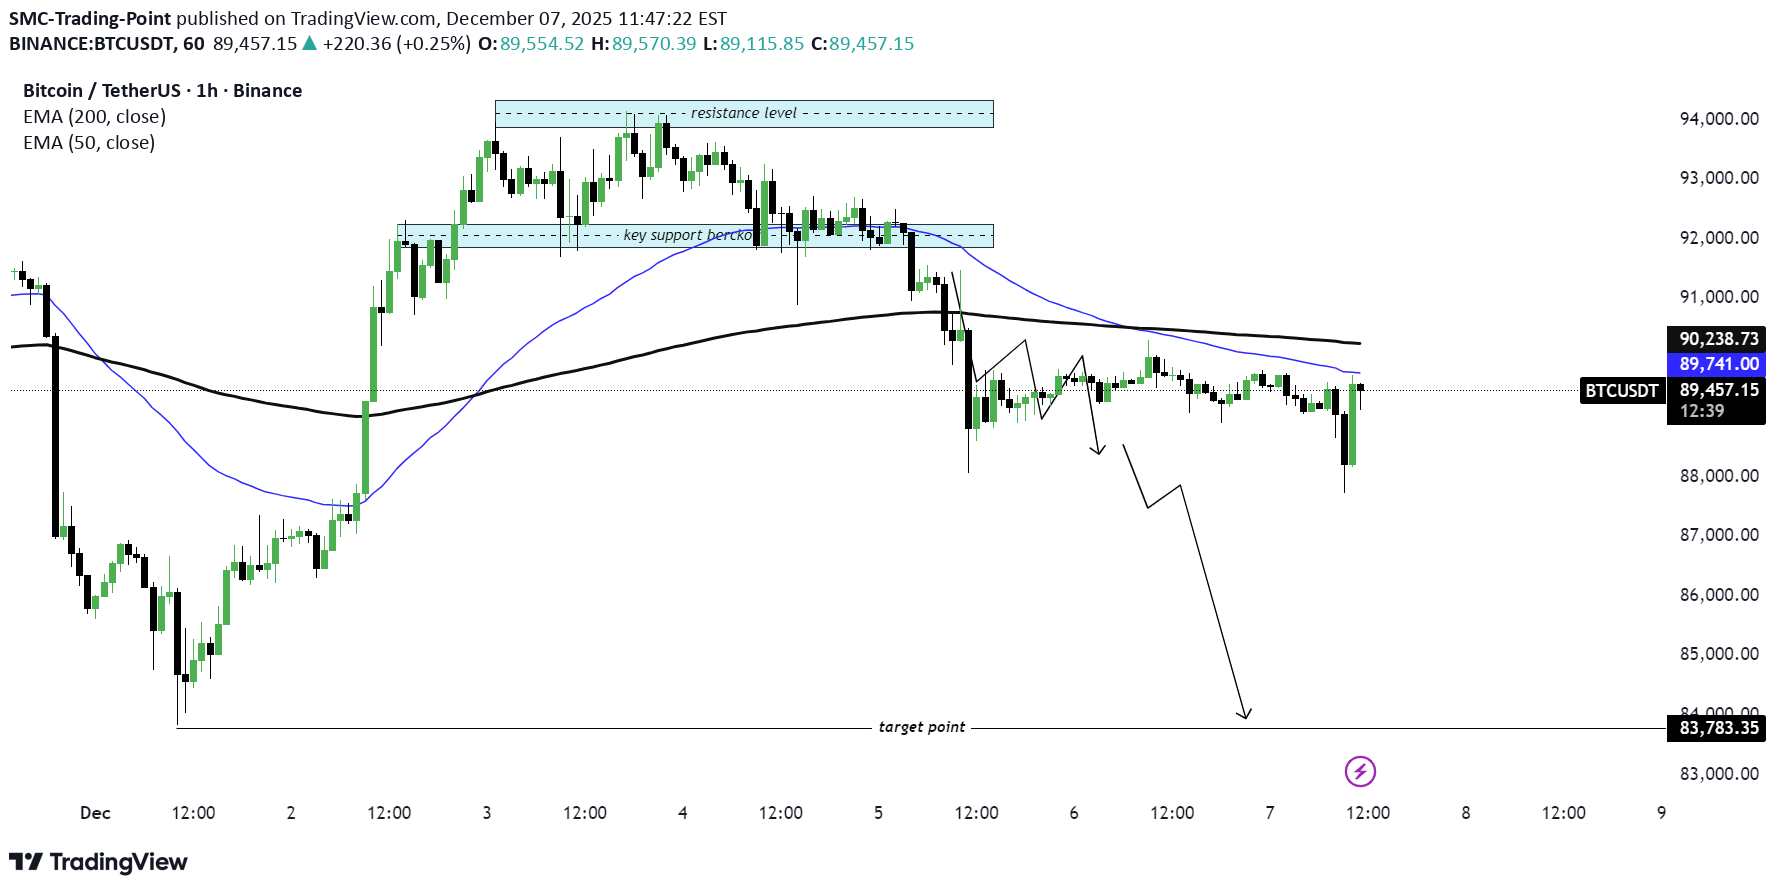
SMC Trading point update Technical analysis of Bitcoin (BTC/USDT), showing likely support/resistance zones + moving averages + a projected downside “target.” I think the analysis has merit — but it also carries risks. Here’s a breakdown of what works & what to watch out for: --- What the analysis does well (strengths) Use of support and resistance zones: The chart marks a “key support zone / breakout level” and a “resistance level.” That’s textbook technical analysis — horizontal zones where price has previously stalled or reversed tend to work as future decision points. Dynamic resistance via moving averages: The chart uses EMAs (50 and 200) — those help traders spot trend direction and possible dynamic resistance/support. When price is below a major EMA (like the 200), that EMA often acts as resistance rather than support. Clear target defined: Having a target around ~$83,783 (as drawn) gives a concrete downside level if the bearish case plays out. This is useful for planning scenarios and risk management. Logical structure: support → breakdown → target: The idea seems to be that price broke a support zone (or tested and failed), is now below important moving averages — which supports the bearish bias. If support fails, move down toward target. That’s a valid “trend + structure” bearish setup. --- What to be cautious about (weaknesses / risks / what’s uncertain) Support/resistance zones are not guarantees: As described in guides for support/resistance — these zones work because many traders place orders there, but price can ignore them, especially under high volatility or news triggers. EMAs as dynamic resistance/support are probabilistic: While 50-EMA or 200-EMA often act as resistance/support, they are not always respected — especially in volatile crypto markets. Timeframe & context matter: The chart seems 1-hour, which means the zones and signals are relatively short-term. Levels that look robust on a 1-h chart may dissolve quickly when broader contexts (daily/weekly) shift. Many TA educators stress using multiple timeframes to confirm strong levels. No certainty of target — market structure can change: The “target point” assumes continuation of bearish momentum. But if price action reverses, or some bullish catalyst emerges, the setup becomes invalid. This is true for any technical projection. --- What this setup implies — possible scenarios Bearish scenario (the chart’s base case): Since price is below both EMAs and has recently broken support, BTC could drift toward the projected target around $83,000–$84,000 if downward pressure continues, especially if sellers dominate near EMAs/resistance zones. Invalidation / bull scenario: If BTC climbs back above the 50 and 200 EMAs, or reclaims a broken support zone, that bearish thesis fails — and price may instead bounce back toward higher resistance. In that case, the target becomes irrelevant. Choppy / range-bound scenario: Price may hover between the support/resistance / EMA zones, bouncing up/down without reaching the target — which is common in crypto when there’s no strong directional catalyst. Mr SMC Trading point --- My view: Reasonable as a probabilistic bearish trade — but not a guarantee Your chart offers a plausible bearish setup. It makes sense to watch how price interacts with the EMAs and the support/resistance zones. However: because markets are never deterministic, it’s best to treat this as one possible scenario, not a sure bet. If I were trading this, I’d probably: Wait for confirmation (e.g. a breakdown + close below support, or rejection at EMA) before committing. Define risk controls: like where to set a stop-loss (maybe just above the 200-EMA or above recent consolidation), and a realistic profit target as indicated. Monitor for catalysts (volume spikes, news) — these can up-end technical setups quickly in crypto. --- Please support boost 🚀 this analysis