Technical analysis by ZareeFxTradingAac about Symbol BTC: Sell recommendation (5 hour ago)

ZareeFxTradingAac
تحلیل بیت کوین: آیا فرصت فروش (شورت) در این مقاومت حساس فرارسیده است؟
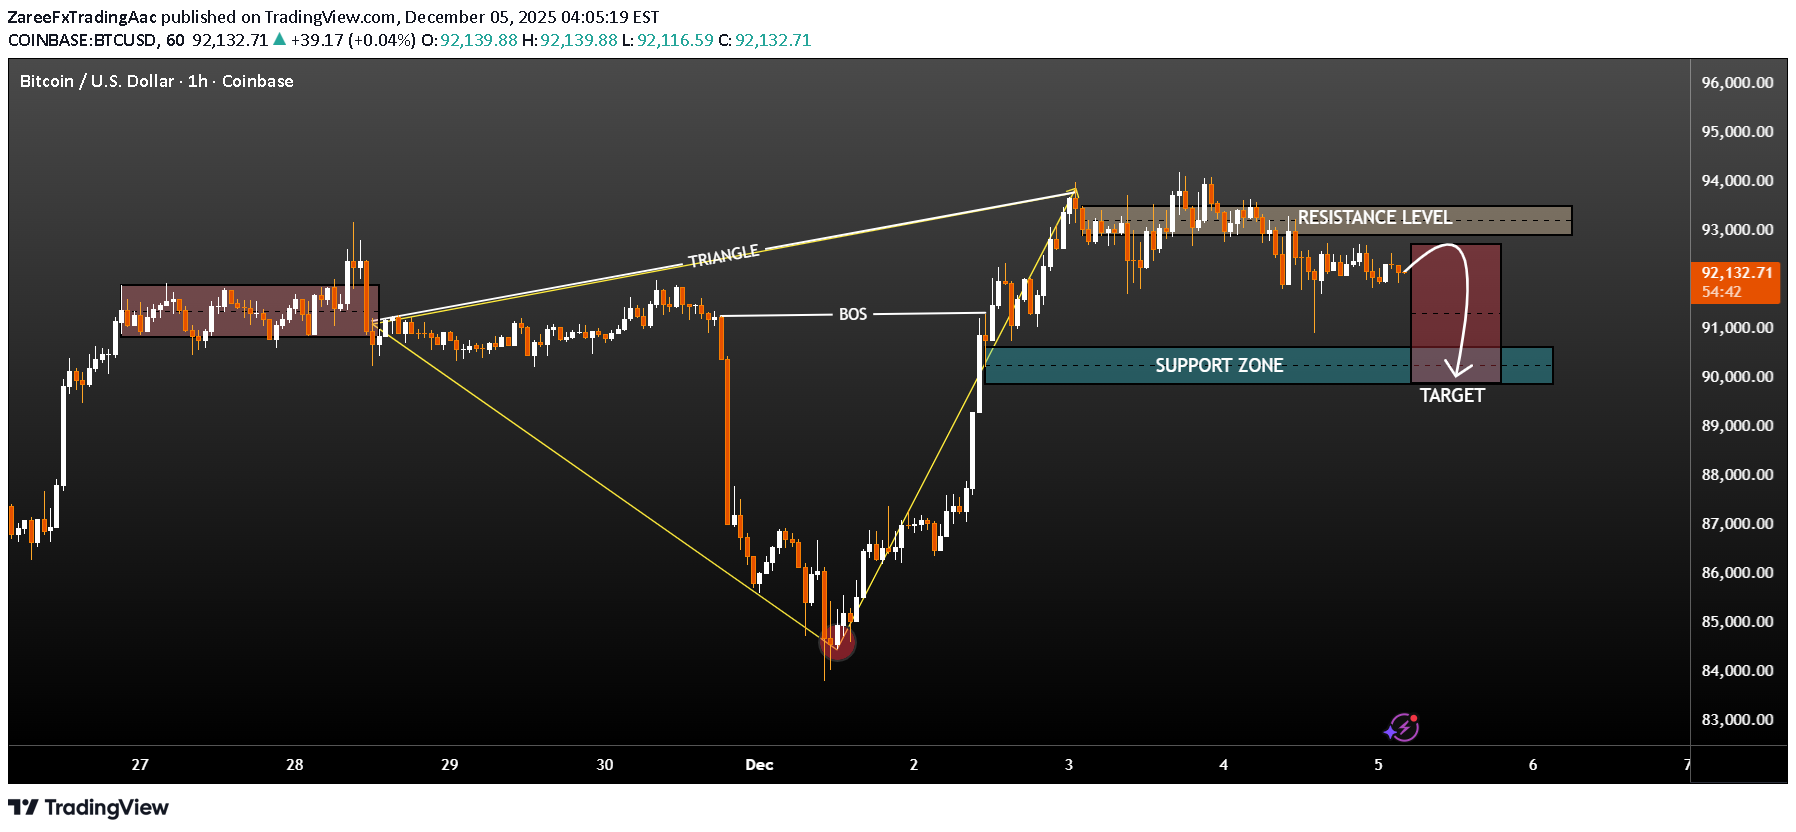
Overall Outlook The chart illustrates Bitcoin on the 1-hour timeframe, showing a transition from consolidation to a major breakdown, followed by a bullish recovery, and now the formation of a potential short setup at resistance. Key Elements in the Chart 1. Consolidation Range (Left Side) Price moves sideways in a tight range. Multiple rejections from both upper and lower boundaries. This acts as a liquidity-building zone before the breakout. 2. Triangle Formation After the range, price forms a symmetrical triangle with converging trendlines. This signals compression and upcoming volatility. Eventually, price breaks downward, confirming the bearish intent. 3. Break of Structure (BOS) The chart marks a significant BOS, meaning the market transitioned into a bearish structure. This BOS validates the previous triangle breakdown. 4. Selloff & Strong Reversal Price dumps sharply into a marked swing low (highlighted with a red circle). After forming a bottom, it rallies aggressively. This rally is a market structure shift back to bullish, retesting key areas. 5. Resistance Level (Current Area) The price consolidates again at the highlighted resistance zone (around 92.8k–93.2k). Several wicks show rejection, meaning sellers are active there. 6. Support Zone & Target Below current price, a support zone around 90k–91k is highlighted. A short position is illustrated from the resistance area toward this support. The downward arrow indicates a bearish retracement target. Interpretation This chart appears to outline a short-term bearish trade setup based on: Price stalling and rejecting resistance. Market structure weakening at the top. A clear target zone for the pullback. It suggests a potential sell opportunity at resistance, targeting the support zone around 90k–91k.