Technical analysis by GoldMasterTrades about Symbol BTC: Sell recommendation (12/4/2025)

GoldMasterTrades
تحلیل بیت کوین: شکار نقدینگی و سناریوی برگشت از ناحیه تقاضا (BTCUSD)
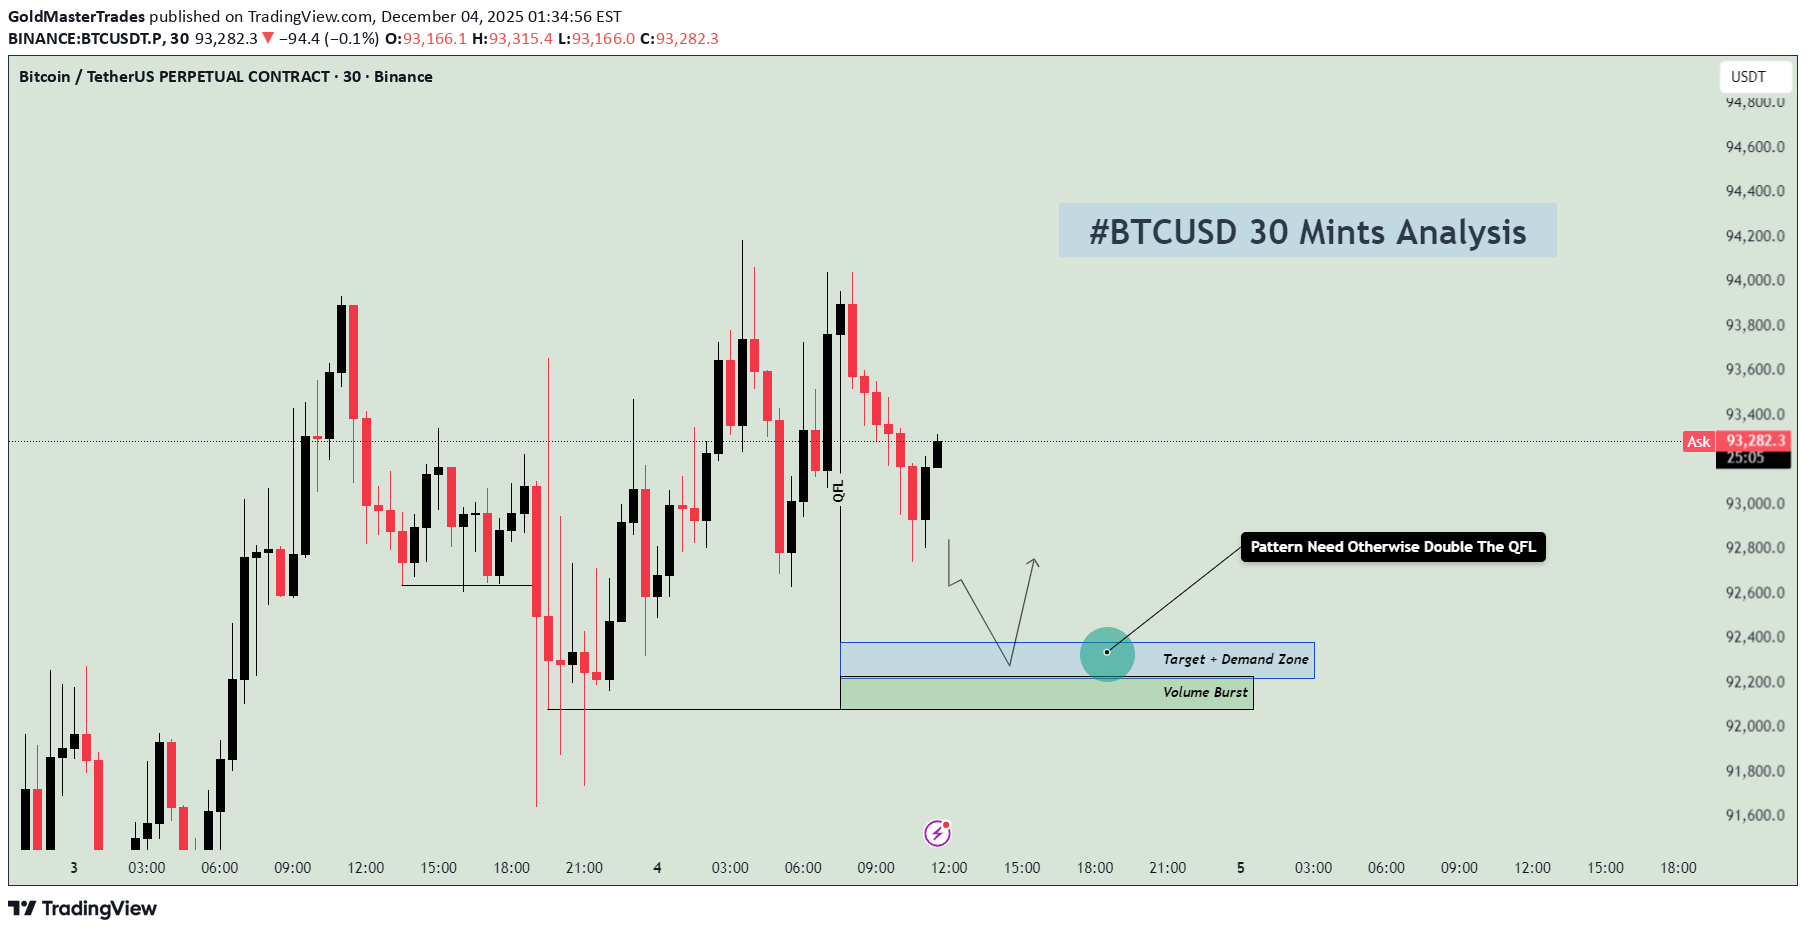
📊 BTCUSD – 30-Minute Smart Money Analysis + MMC Concept Used Demand Zone Reaction | Volume Burst | QFL Strategy 🔍 1. Market Overview Bitcoin on the 30-minute chart is currently pulling back after failing to break above the recent intraday high. Price is slowly drifting downward, showing signs of controlled seller pressure. This decline is driving BTC toward a key demand + target zone, marked in blue, with deeper liquidity resting in the green “Volume Burst” zone. This setup suggests a potential reversal opportunity, but only with confirmed price action. 📉 2. Structure Breakdown A. Decline After Swing High BTC rejected the upper levels and started forming: Lower highs Lower lows Weak bullish candles This shows sellers are still in control until price touches a stronger demand pool. B. QFL Level Marked The "QFL" marking on the chart reflects: A base level where price previously formed A zone that held liquidity and triggered a bullish bounce last time A zone that smart money may revisit to collect liquidity again If no pattern forms at the first demand box, BTC may double the QFL, meaning price can dip into the deeper liquidity pool before reversing. 🎯 3. Key Zones to Watch 🟦 Target + Demand Zone (Upper Zone) This is the first area where buyers may step in. Expect: A possible micro reversal pattern Short-term bounce opportunity Scalping potential However, you must wait for a clean bullish pattern here (engulfing, pin bar, break of minor structure). The chart clearly states: “Pattern Needed Otherwise Double The QFL” Meaning: No pattern = price moves lower. 🟩 Volume Burst Zone (Lower Liquidity Pool) This deeper zone is stronger because: It represents the previous area where a volume spike occurred Smart money positioned aggressively here before Liquidity is highly concentrated If price reaches this zone, the reversal probability becomes significantly higher. This area is ideal for high-probability long entries. 📌 4. Smart Money Logic The price movement aligns with institutional behavior: The current drop is likely a liquidity hunt BTC is moving toward unfilled demand Buyers may re-enter strongly once the market taps the liquidity pockets shown Institutions often engineer these dips before the next bullish impulse. 📈 5. Professional Trading Plan 1. Let price fall into the demand zone. Do not enter early. 2. Look for confirmation: Bullish engulfing Market structure shift Large volume candle Clean rejection wick 3. If no pattern forms in the first zone: Expect price to dip toward the lower Volume Burst Zone. 4. Main long entry interest: Lower (green) zone offers the best probability. 📝 Conclusion BTC is heading toward a well-defined demand structure. The next move depends on how price reacts in the highlighted zones. A bullish reversal is possible, but confirmation is critical. Without a pattern, BTC may dip deeper to collect liquidity—exactly as marked on the chart. This setup reflects precision-level smart money behavior, offering a clean high-probability trading opportunity for disciplined traders.