Technical analysis by Nova-Scalper about Symbol BTC: Sell recommendation (12/1/2025)

Nova-Scalper
فشار فروش بیت کوین ادامه دارد: آیا ریزش به سطوح پایینتر قطعی است؟
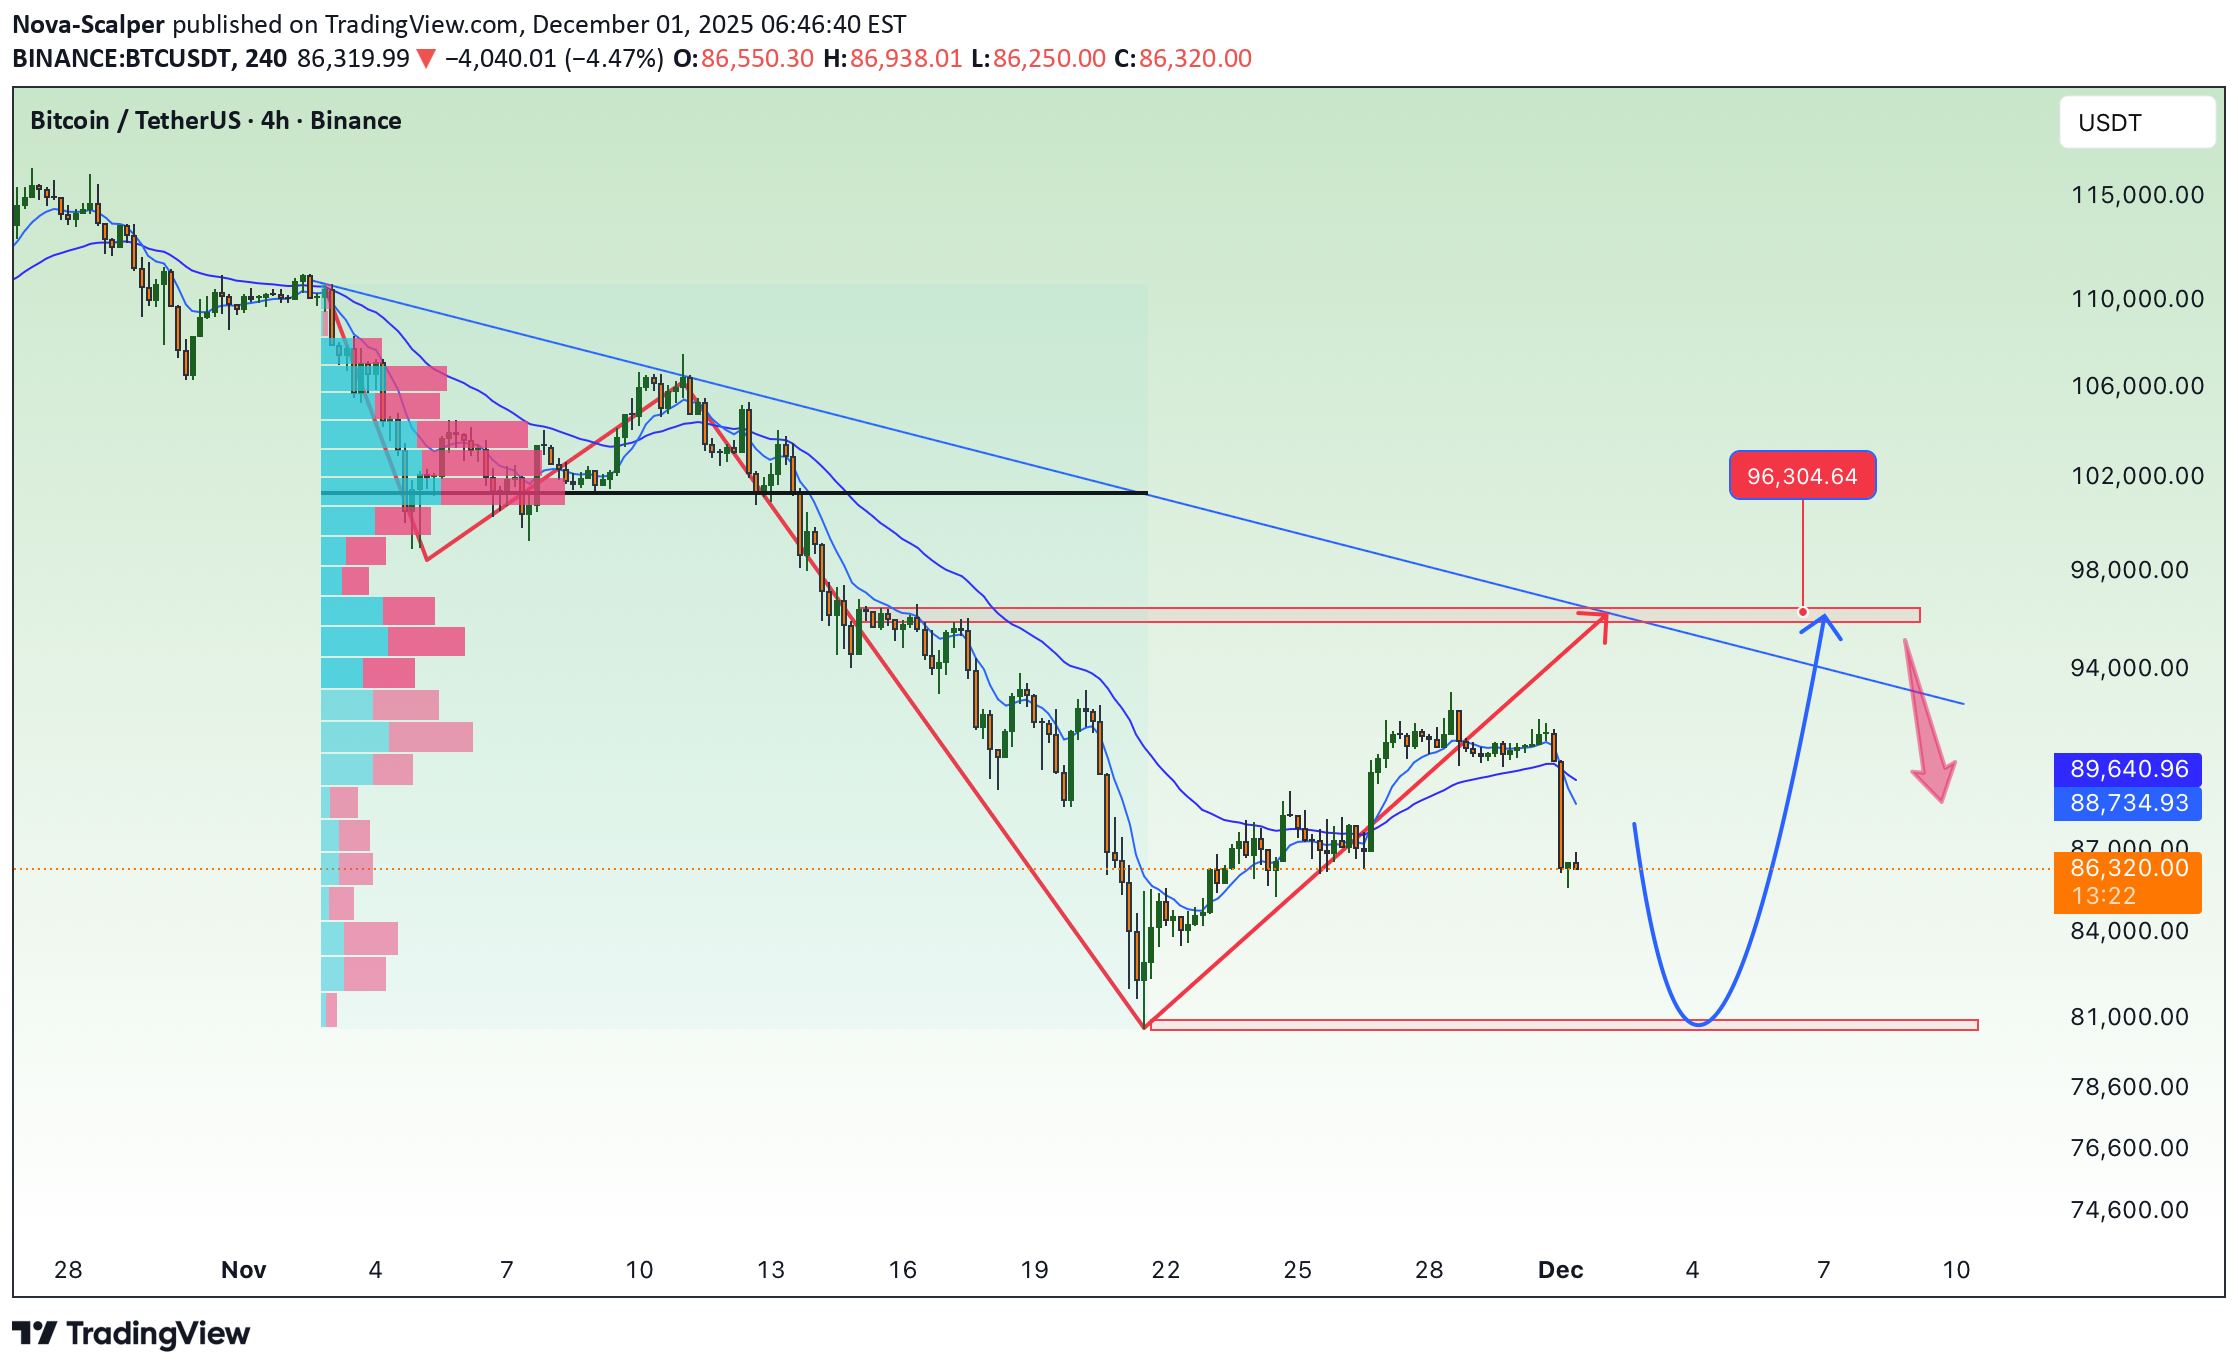
BTC H4 Chart Analysis Bitcoin on the H4 timeframe is currently showing a corrective pullback after reaching a key resistance zone around 95,500–96,300, which aligns with the descending trendline, previous supply zone, and EMA confluence (200 EMA + 300 EMA). This rejection indicates strong selling pressure and confirms the zone as a major resistance area. Key Technical Points: 🔹 Strong Rejection at Major Resistance: Price reacted sharply from the supply zone and failed to break above the descending structure, signaling sellers are still active. 🔹 Break of Short-Term Bullish Structure: The recent drop has broken the ascending trendline, showing weakness from buyers and a potential shift back to a bearish correction. 🔹 EMA Dynamic Resistance: Price remains below the 200 EMA (red) and the long-term moving average (white) — suggesting bulls still lack full control and the broader trend remains under pressure. 🔹 Volume Profile Confirmation: Most liquidity sits below current price levels, hinting the market may revisit demand zones before attempting another move higher.