
Nova-Scalper
@t_Nova-Scalper

What symbols does the trader recommend buying?
Purchase History
پیام های تریدر
Filter
Nova-Scalper
Gold prices continue to rise - heading above 4500.

⭐️GOLDEN INFORMATION: Dovish Federal Reserve expectations continue to underpin Gold, as the latest FOMC Minutes signaled that most policymakers favor further rate cuts if inflation keeps easing, lowering the opportunity cost of holding the non-yielding metal. Markets now focus on Friday’s US December jobs report, with payrolls seen rising by 55,000 and the jobless rate edging down to 4.5%; any upside surprise could lift the USD and cap near-term gains in Gold. ⭐️Personal comments NOVA: Gold prices continue their upward trend - forming a bullish Dow pattern on the H1 chart, heading above 4500. ⭐️SET UP GOLD PRICE: 🔥SELL GOLD zone: 4545 - 4547 SL 4552 TP1: $4530 TP2: $4515 TP3: $4500 🔥BUY GOLD zone: 4400 - 4398 SL 4393 TP1: $4415 TP2: $4430 TP3: $4445 ⭐️Technical analysis: Based on technical indicators EMA 34, EMA89 and support resistance areas to set up a reasonable BUY order. ⭐️NOTE: Note: Nova wishes traders to manage their capital well - take the number of lots that match your capital - Takeprofit equal to 4-6% of capital account - Stoplose equal to 2-3% of capital account
Nova-Scalper
Selling pressure - correction below 4300

✍️ NOVA hello everyone, Let's comment on gold price next week from 01/05/2026 - 01/09/2026 ⭐️GOLDEN INFORMATION: Gold (XAU/USD) accelerated its recovery on a holiday-thinned session on Friday, with markets in Japan and China closed for the New Year lantern. The precious metal is 1.75% up on the day, reaching levels near $4,400, after bouncing from $4,274 earlier this week. A combination of market expectations of lower interest rates in the US and growing geopolitical frictions has underpinned support from precious metals over the last few sessions. Russia has announced the revision of its stance at the peace talks with Ukraine, after an intentional drone attack in one of President Vladimir Putin's residences, while US President Trump has raised his tone against Iran. ⭐️Personal comments NOVA: Investor sentiment remains pressured to sell and take profits at the start of the new year - however, global military concerns continue to provide upward momentum for gold prices. 🔥 Technically: Based on the resistance and support areas of the gold price according to the H4 frame, NOVA identifies the important key areas as follows: Resistance: $4402, $4453 Support: $4274, $4237 🔥 NOTE: Note: Nova wishes traders to manage their capital well - take the number of lots that match your capital - Takeprofit equal to 4-6% of capital account - Stoplose equal to 2-3% of capital account - The winner is the one who sticks with the market the longest
Nova-Scalper
Gold prices recovered to around 4400.

⭐️GOLDEN INFORMATION: The minutes from the Federal Open Market Committee’s December 9–10 meeting revealed that most policymakers see scope for additional interest-rate cuts, contingent on inflation continuing to trend lower, though there was less consensus on the timing and magnitude of further easing. Expectations of lower policy rates tend to compress yields and reduce the opportunity cost of holding non-interest-bearing assets, providing a supportive backdrop for Gold. Beyond monetary policy, elevated geopolitical risks remain a key tailwind. The ongoing Israel–Iran conflict, alongside persistent tensions between the United States and Venezuela, continues to underpin safe-haven demand. In periods of heightened uncertainty, investors typically gravitate toward assets that can preserve value, reinforcing Gold’s role as a traditional store of wealth. ⭐️Personal comments NOVA: Gold prices are recovering at the beginning of 2026, breaking through the H1 trendline, and are recovering in the Asian session. ⭐️SET UP GOLD PRICE: 🔥SELL GOLD zone: 4443 - 4445 SL 4450 TP1: $4435 TP2: $4420 TP3: $4400 🔥BUY GOLD zone: 4276 - 4278 SL 4271 TP1: $4295 TP2: $4310 TP3: $4330 ⭐️Technical analysis: Based on technical indicators EMA 34, EMA89 and support resistance areas to set up a reasonable BUY order. ⭐️NOTE: Note: Nova wishes traders to manage their capital well - take the number of lots that match your capital - Takeprofit equal to 4-6% of capital account - Stoplose equal to 2-3% of capital account
Nova-Scalper
Selling pressure on BTC - 2026
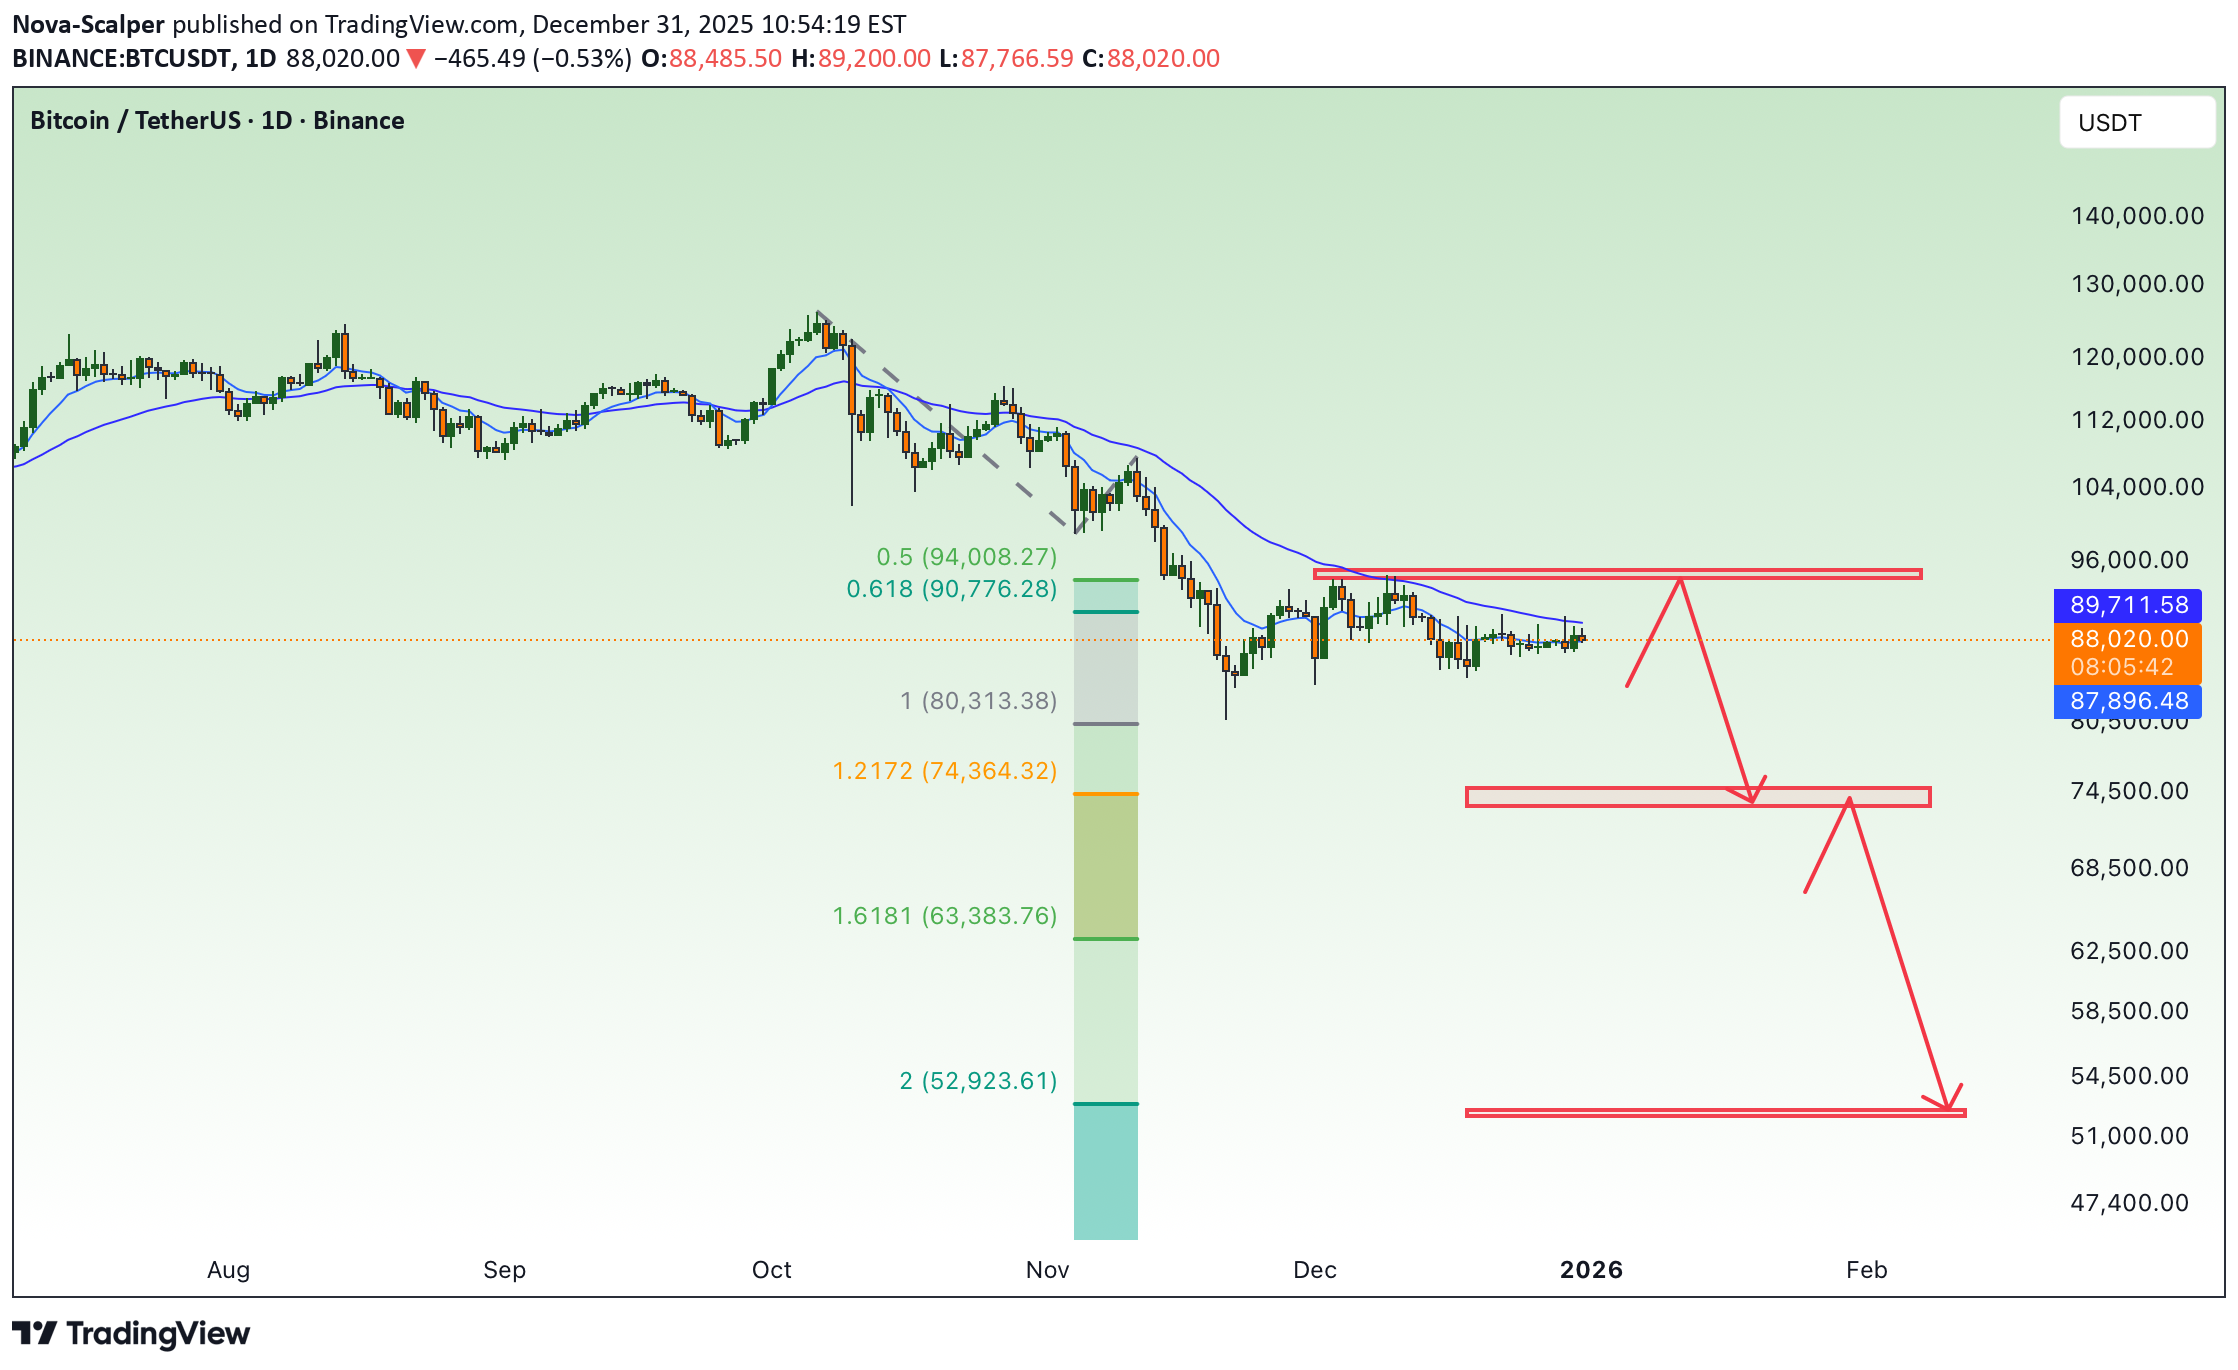
Bitcoin (BTC/USD) – End-of-Year Outlook (D1) As we move toward the end of the year, Bitcoin is showing a clear shift from uptrend to corrective / bearish structure on the daily timeframe. 1. Market Structure BTC has broken below the rising channel and failed to reclaim it, confirming a loss of bullish control. Price is now trading below EMA 34 and EMA 89, while EMA 200 remains far above — a classic sign of a medium-term downtrend. 2. Key Resistance Zone The 95,000–96,000 area (purple zone) is a strong supply / sell zone, aligned with: Previous support turned resistance EMA confluence Any pullback into this zone is likely to attract sellers rather than buyers. 3. Support & Downside Scenarios First downside target: ~76,700 This is a major demand zone and the 1.618 Fibonacci extension. If this level breaks: Price could extend further toward 52,000–53,000, which is a long-term demand area and strong historical support. 4. Year-End Expectation Without a strong reclaim above 96,000, BTC is more likely to: Continue sideways to bearish movement, or Form a bearish pullback before another leg down
Nova-Scalper
Downtrend towards the end of the year, below 4300
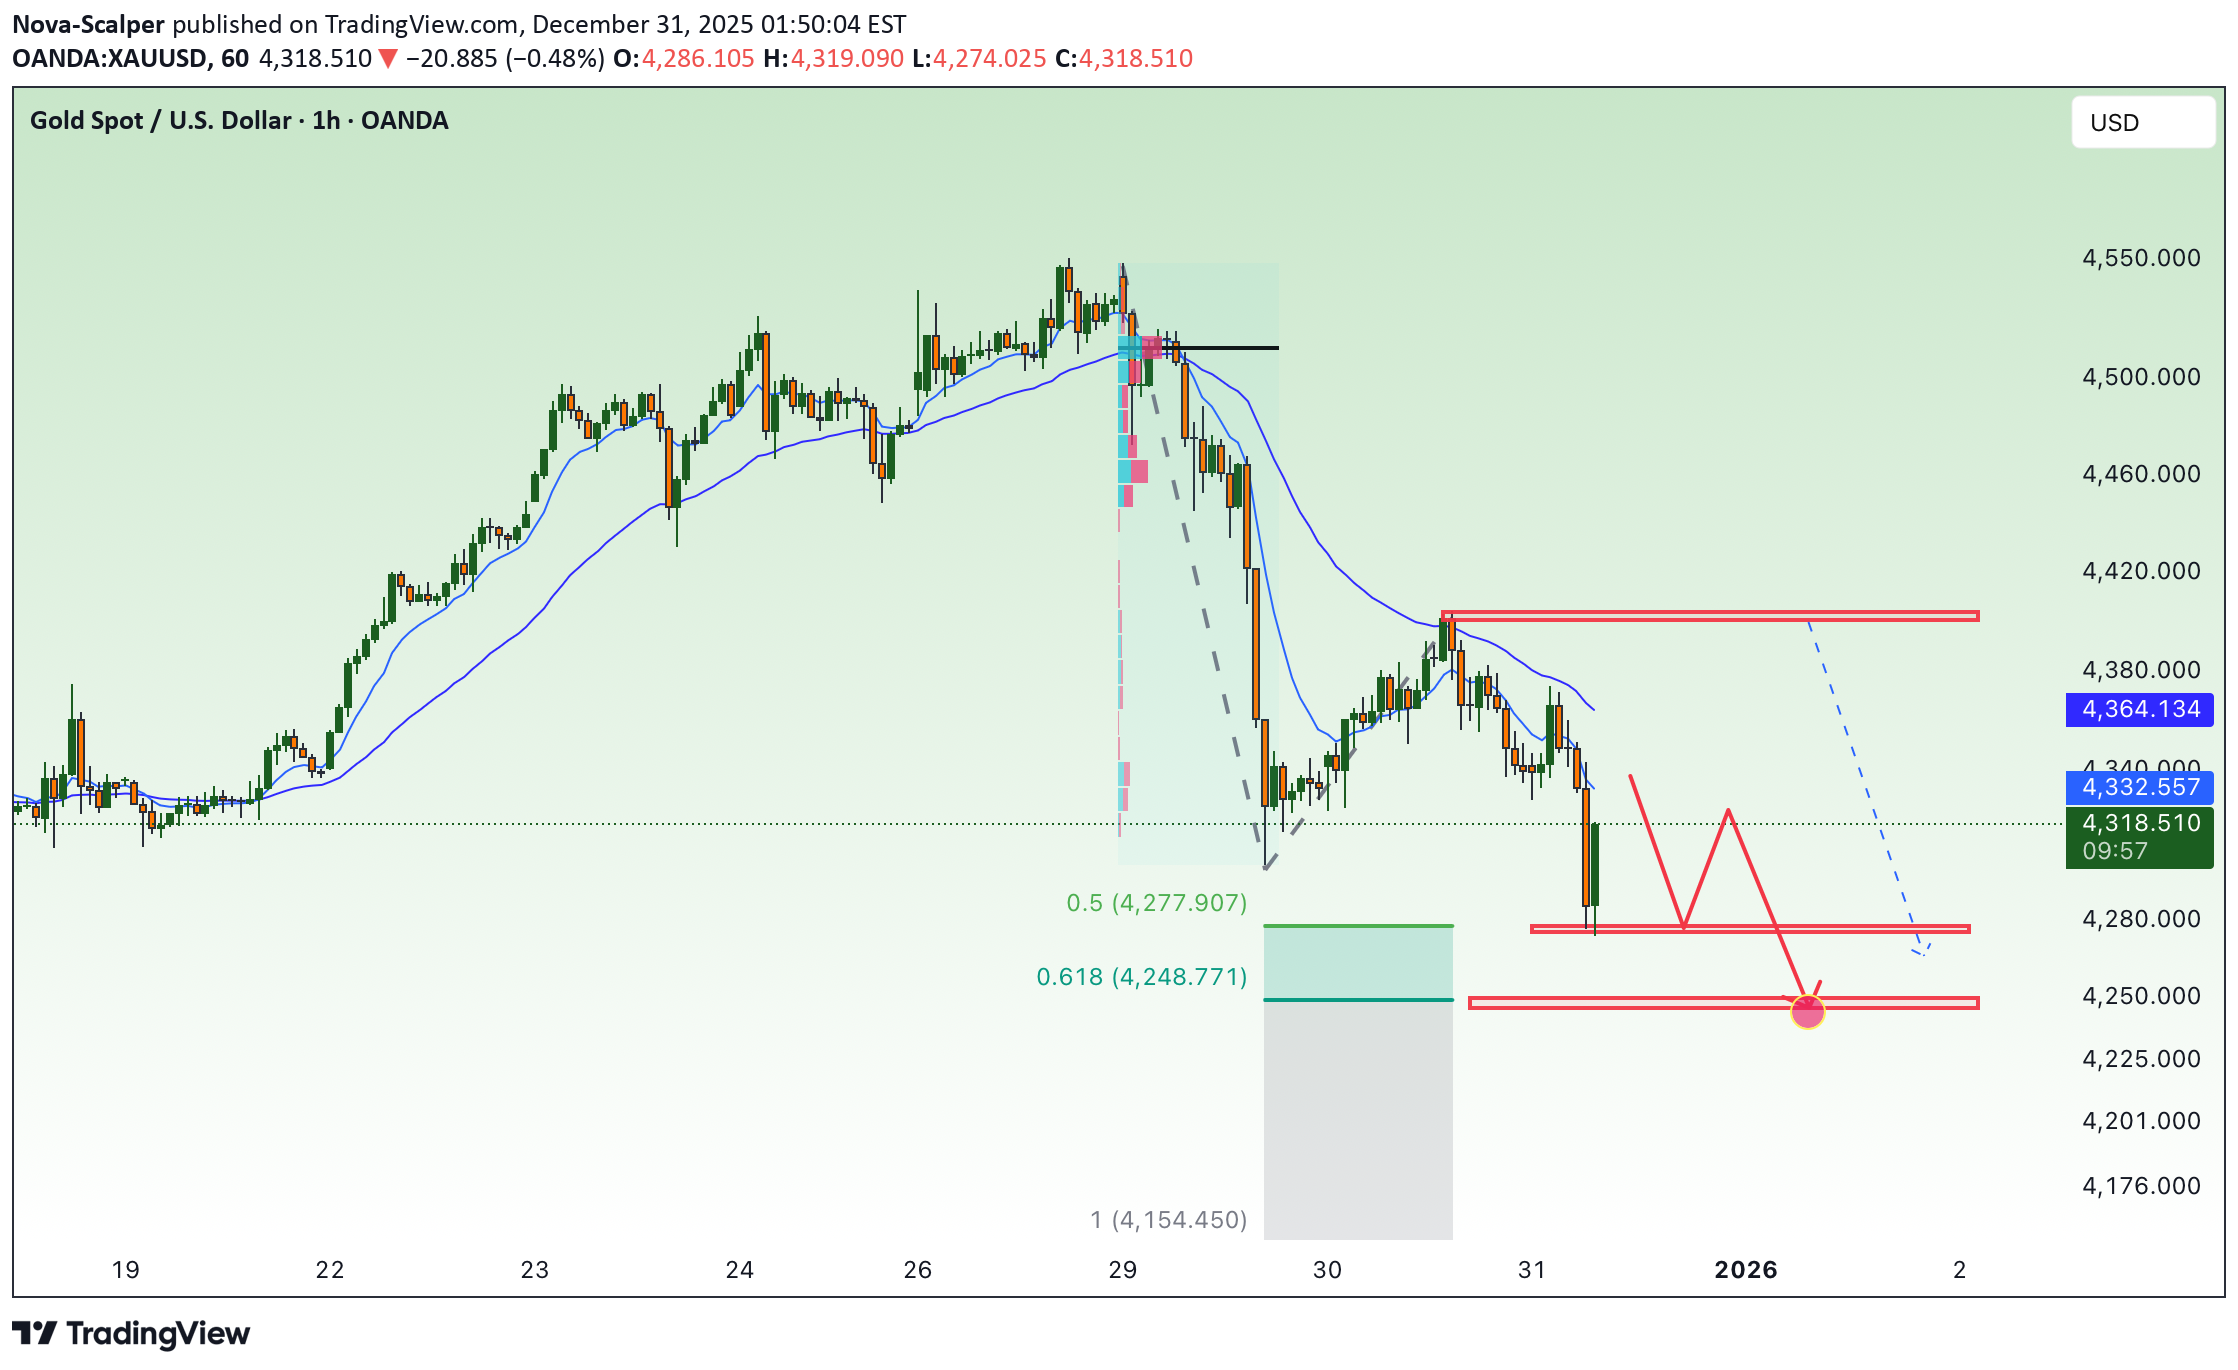
⭐️GOLDEN INFORMATION: In the wake of the FOMC Minutes release, market-implied expectations for a rate cut at the January meeting edged lower, with federal funds futures now assigning roughly a 15% probability to an easing move, according to the CME FedWatch tool. The shift suggests a modest recalibration of near-term policy expectations among traders. Separately, the Chicago Mercantile Exchange (CME) Group—one of the world’s largest commodity trading venues—announced an increase in margin requirements for gold, silver, and other metal contracts, as outlined in a notice published on its website last week. The higher margins compel traders to post additional collateral to cover positions, aiming to mitigate counterparty risk in the event of delivery and often prompting position adjustments across the metals complex. ⭐️Personal comments NOVA: Gold prices are under selling pressure at the end of the year, with a major decline potentially returning below 4300. ⭐️SET UP GOLD PRICE: 🔥SELL GOLD zone: 4401 - 4403 SL 4408 TP1: $4390 TP2: $4380 TP3: $4365 🔥BUY GOLD zone: 4249 - 4246 SL 4242 TP1: $4260 TP2: $4275 TP3: $4290 ⭐️Technical analysis: Based on technical indicators EMA 34, EMA89 and support resistance areas to set up a reasonable SELL order. ⭐️NOTE: Note: Nova wishes traders to manage their capital well - take the number of lots that match your capital - Takeprofit equal to 4-6% of capital account - Stoplose equal to 2-3% of capital account
Nova-Scalper
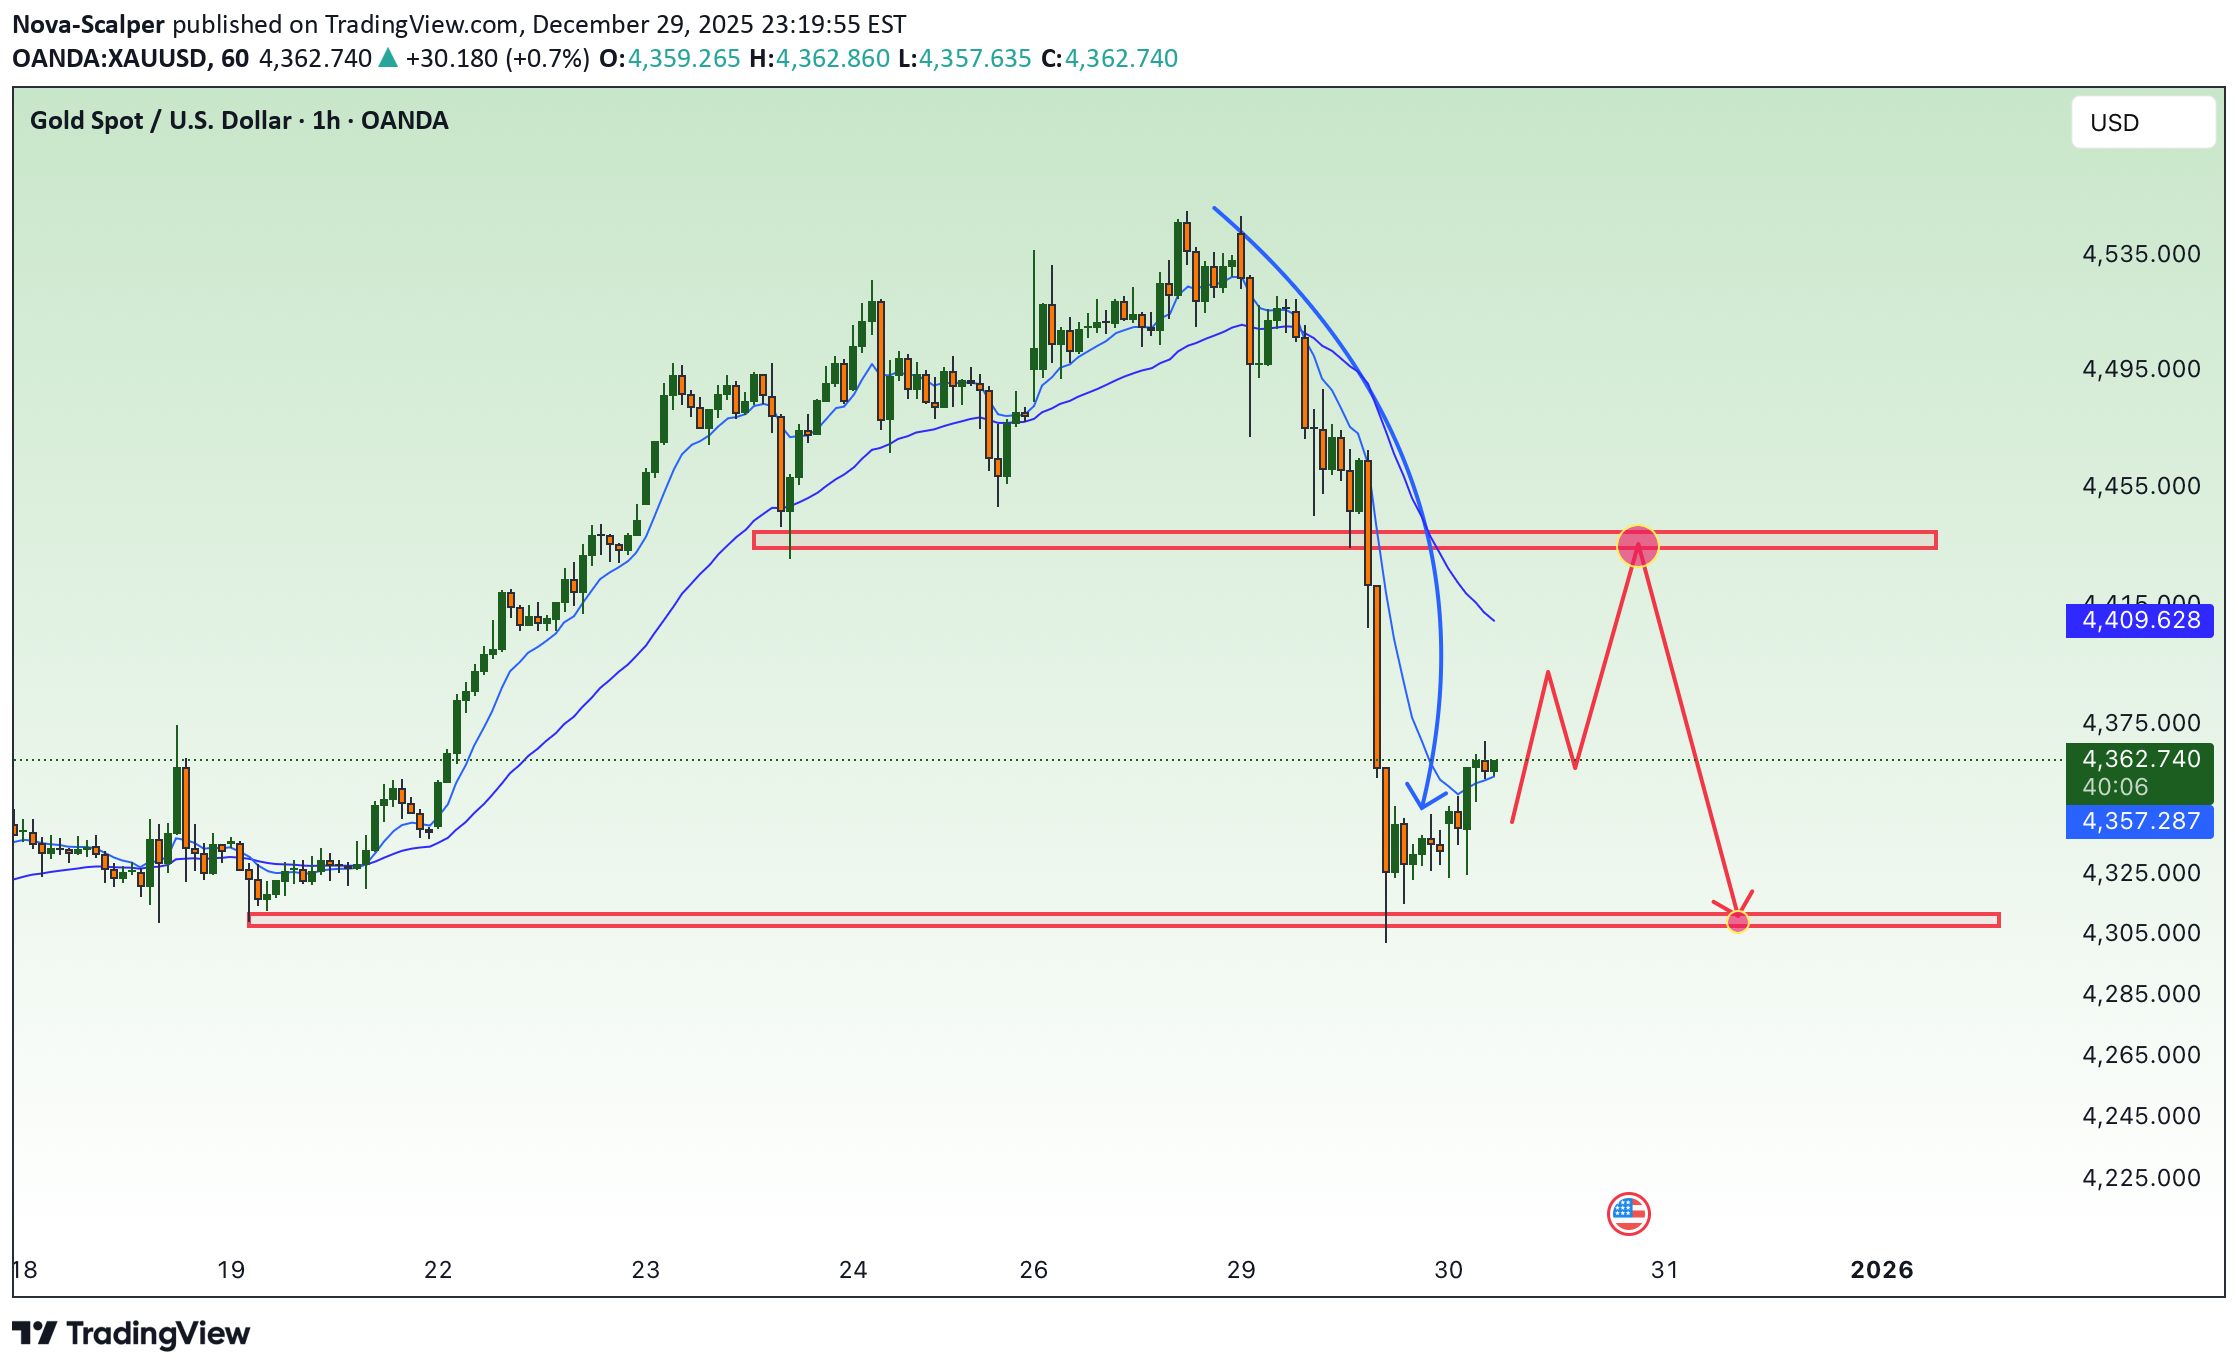
Gold prices remain above 4300 at the end of the year.

⭐️GOLDEN INFORMATION: The US Federal Reserve moved to lower its policy rate by 25 basis points, setting the federal funds target range at 3.50%–3.75%. Policymakers backing the decision pointed to rising downside risks to the labor market alongside easing inflation dynamics as justification for the adjustment. The vote, however, revealed notable divisions within the Committee. Fed Governor Stephen Miran dissented in favor of a larger, “jumbo” rate cut, while Chicago Fed President Austan Goolsbee and Kansas City Fed President Jeff Schmid opposed the move, preferring to keep interest rates unchanged. ⭐️Personal comments NOVA: Gold prices are trading sideways within the year-end correction range of 4300 - 4400. ⭐️SET UP GOLD PRICE: 🔥SELL GOLD zone: 4401 - 4403 SL 4408 TP1: $4390 TP2: $4380 TP3: $4365 🔥BUY GOLD zone: 4304 - 4302 SL 4297 TP1: $4315 TP2: $4330 TP3: $4345 ⭐️Technical analysis: Based on technical indicators EMA 34, EMA89 and support resistance areas to set up a reasonable SELL order. ⭐️NOTE: Note: Nova wishes traders to manage their capital well - take the number of lots that match your capital - Takeprofit equal to 4-6% of capital account - Stoplose equal to 2-3% of capital account
Nova-Scalper
سقوط طلا در پایان سال: چرا سرمایهگذاران سودها را قفل کردند؟
⭐️GOLDEN INFORMATION: Gold (XAU/USD) ticks higher during the Asian session on Tuesday, reclaiming ground above the $4,350 level after suffering a sharp 4.5% decline in the previous session—its steepest single-day drop since October. The modest rebound comes as selling pressure eases following aggressive liquidation triggered by higher margin requirements on gold and silver futures imposed by the Chicago Mercantile Exchange (CME) Group, one of the world’s largest commodities trading venues. ⭐️Personal comments NOVA: Gold prices began to fall at the end of the year - investors closed their positions. Gold started a major downward correction. ⭐️SET UP GOLD PRICE: 🔥SELL GOLD zone: 4434 - 4436 SL 4441 TP1: $4420 TP2: $4405 TP3: $4390 🔥BUY GOLD zone: 4301 - 4303 SL 4296 TP1: $4315 TP2: $4330 TP3: $4345 ⭐️Technical analysis: Based on technical indicators EMA 34, EMA89 and support resistance areas to set up a reasonable SELL order. ⭐️NOTE: Note: Nova wishes traders to manage their capital well - take the number of lots that match your capital - Takeprofit equal to 4-6% of capital account - Stoplose equal to 2-3% of capital account
Nova-Scalper
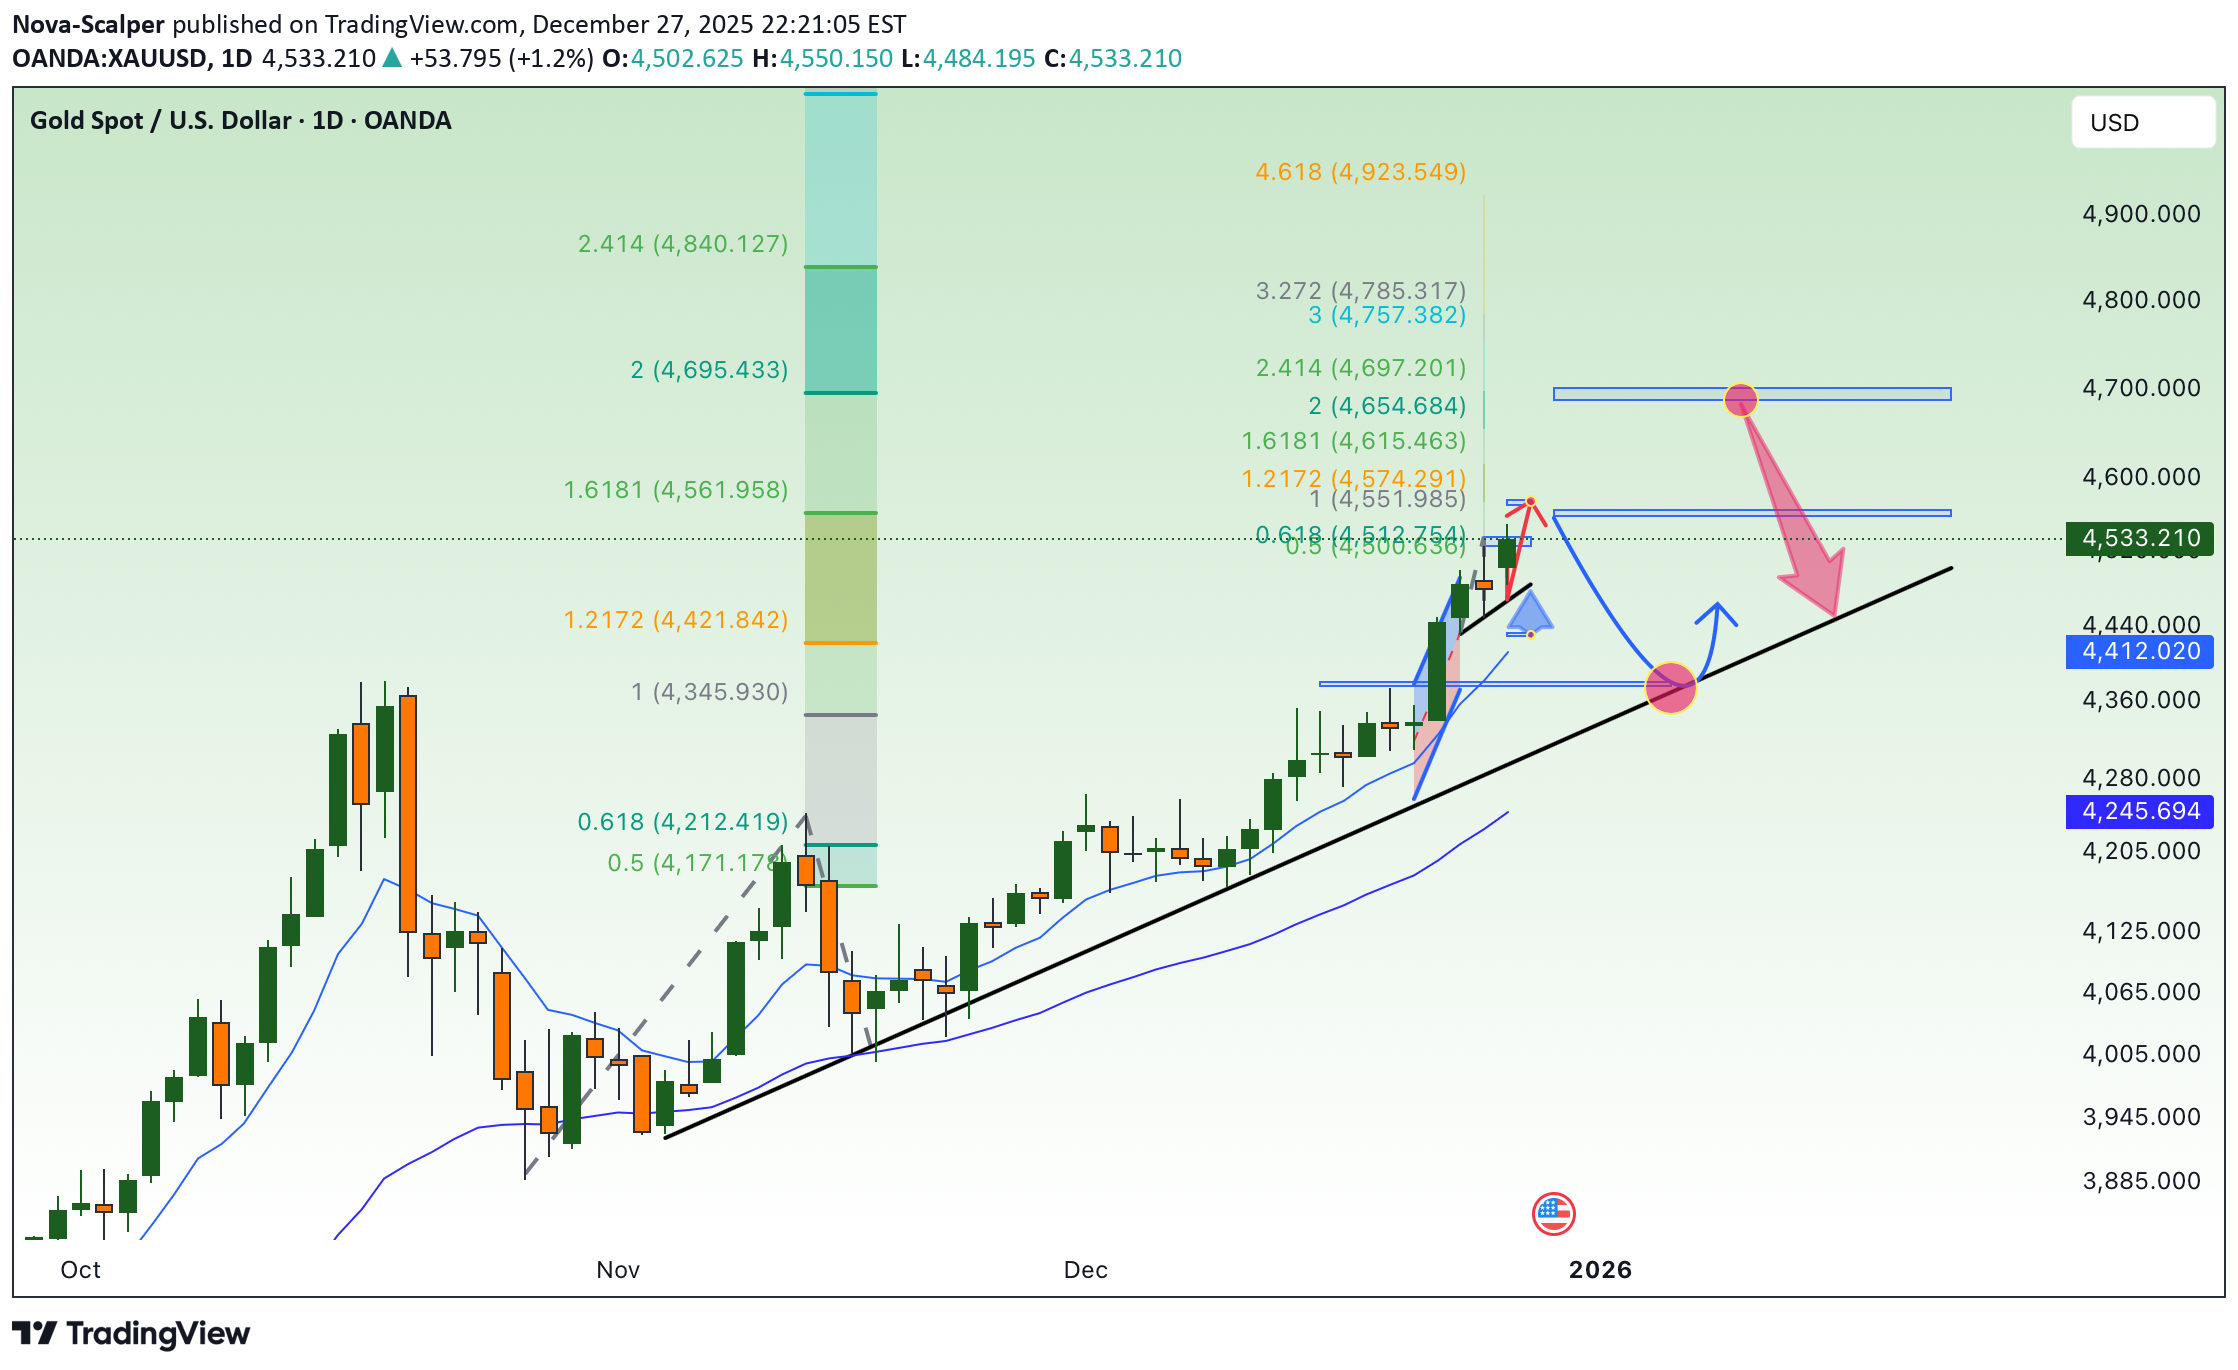
Upward trend following the trendline - 4568
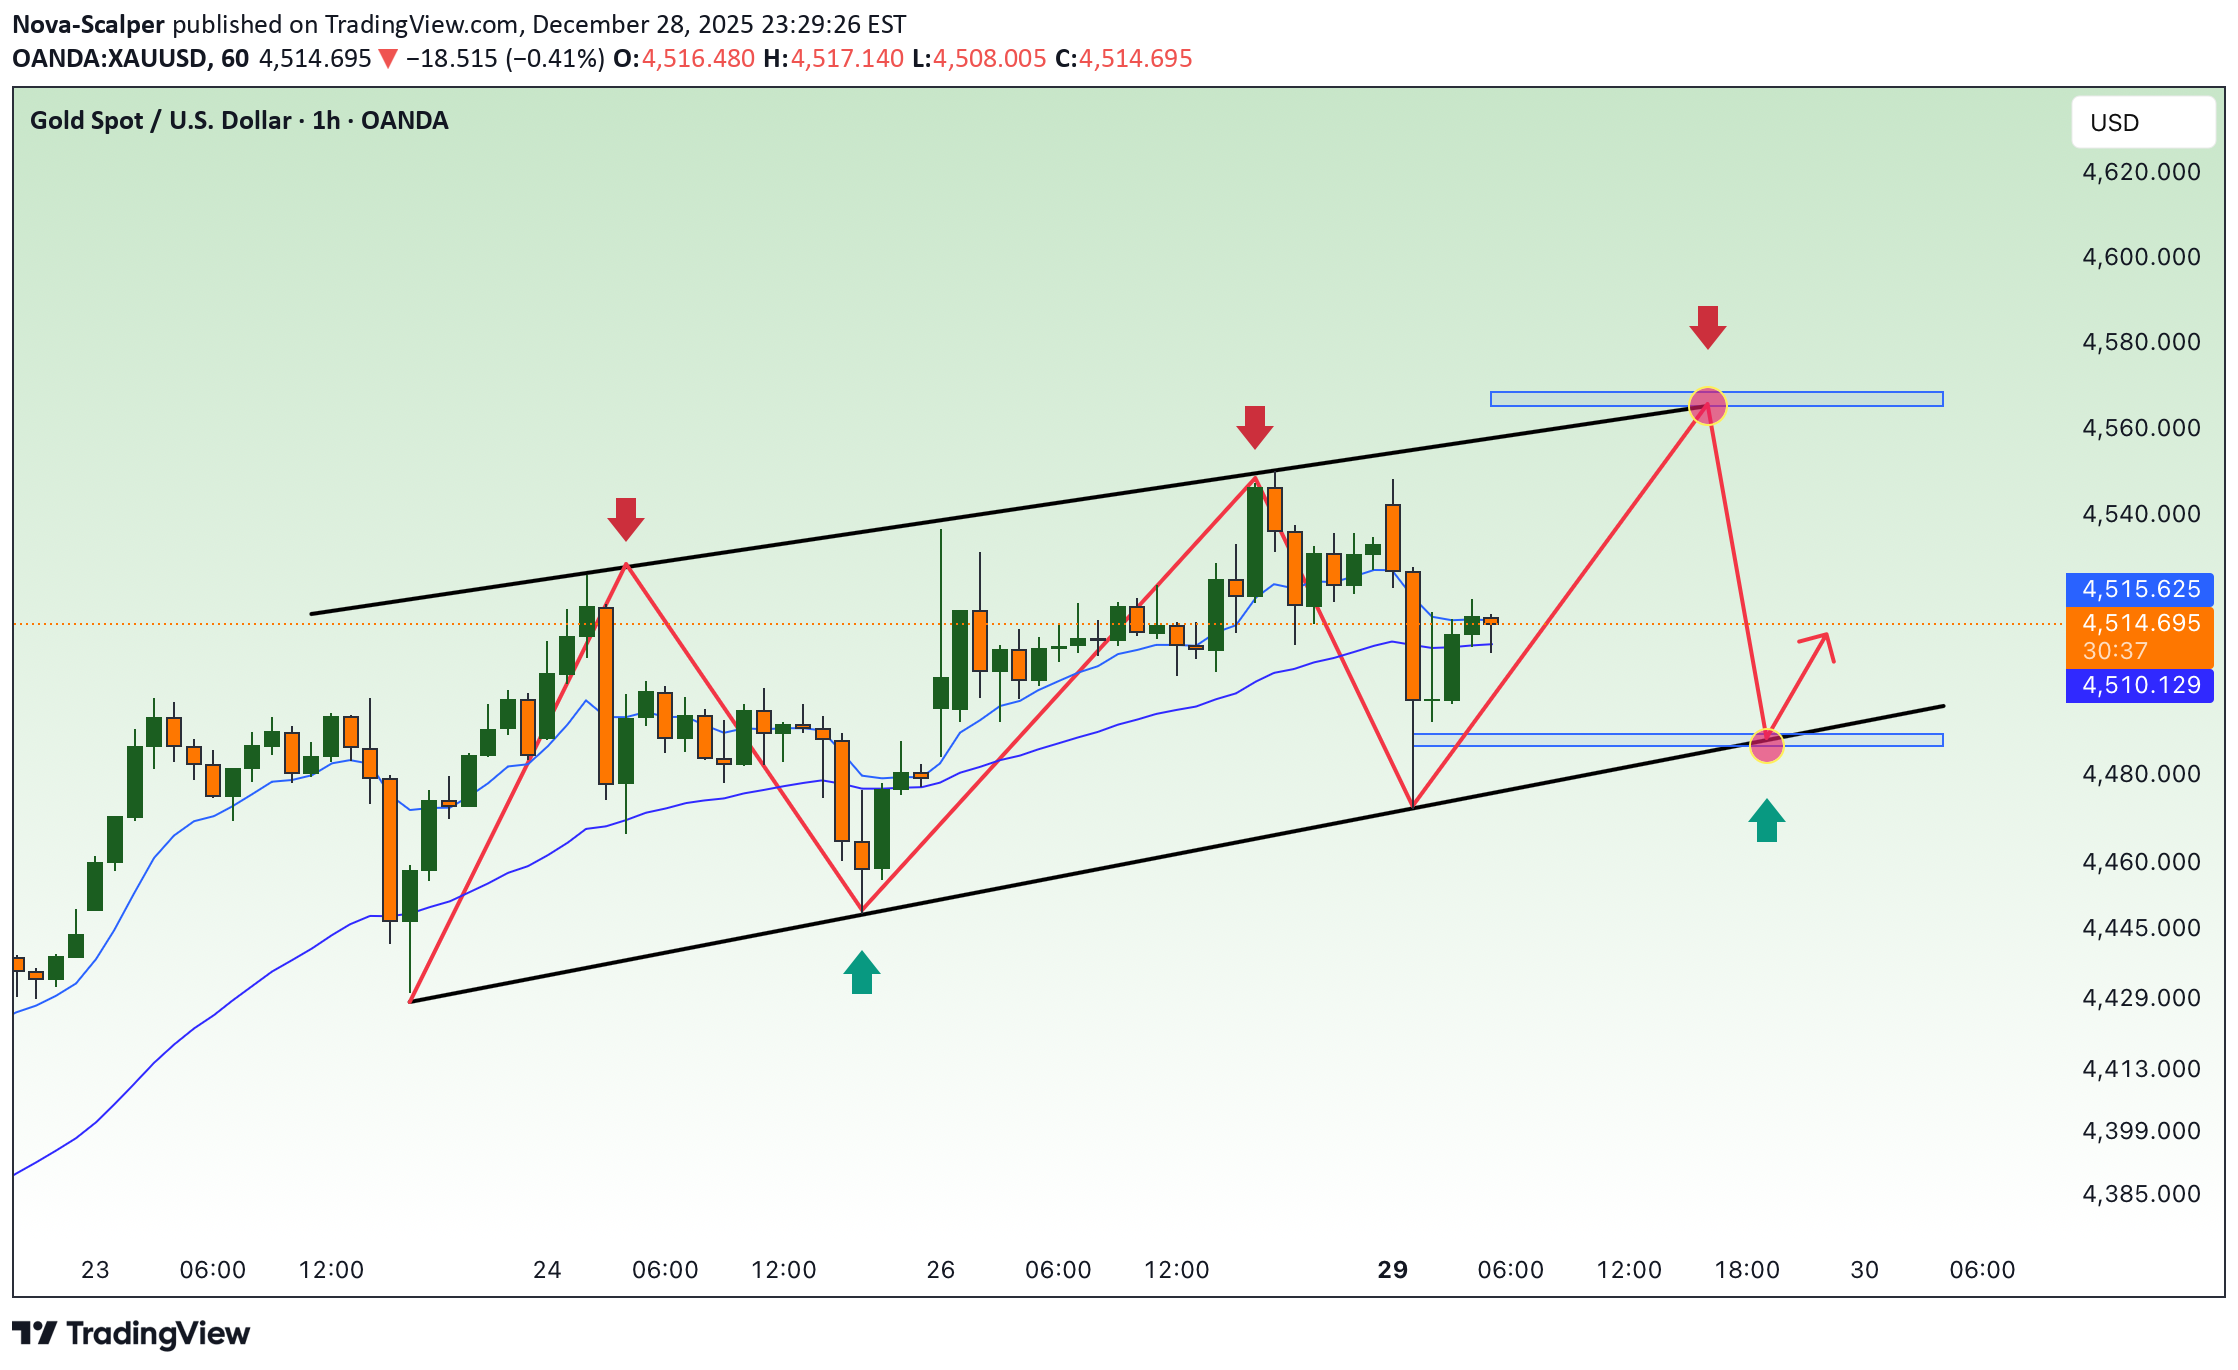
⭐️GOLDEN INFORMATION: Gold (XAU/USD) eases back from a fresh record peak near the $4,550 mark during Asian trading on Monday, as market participants lock in profits ahead of the holiday period. The pullback is further reinforced by a firmer US Dollar, which tends to create headwinds for the precious metal by increasing its cost for non-US investors. Even so, the broader bullish narrative remains firmly intact. Gold has rallied nearly 70% so far in 2025—marking its strongest annual performance since 1979—and downside risks appear limited. Markets continue to anticipate a more accommodative Federal Reserve policy stance in 2026, with lower interest rates reducing the opportunity cost of holding non-yielding assets such as Gold. In addition, persistent geopolitical tensions are likely to sustain safe-haven demand, providing an ongoing structural tailwind for the yellow metal. ⭐️Personal comments NOVA: Upward trend - gold is moving towards 4568 along the upper trendline. ⭐️SET UP GOLD PRICE: 🔥SELL GOLD zone: 4568 - 4570 SL 4575 TP1: $4550 TP2: $4535 TP3: $4520 🔥BUY GOLD zone: 4487 - 4485 SL 4480 TP1: $4498 TP2: $4512 TP3: $4528 ⭐️Technical analysis: Based on technical indicators EMA 34, EMA89 and support resistance areas to set up a reasonable BUY order. ⭐️NOTE: Note: Nova wishes traders to manage their capital well - take the number of lots that match your capital - Takeprofit equal to 4-6% of capital account - Stoplose equal to 2-3% of capital account
Nova-Scalper
طلا در آستانه شکستن سقف تاریخی جدید: پیشبینی هفته آخر ۲۰۲۵
✍️ NOVA hello everyone, Let's comment on gold price next week from 12/29/2025 - 01/02/2026 ⭐️GOLDEN INFORMATION: Gold (XAU/USD) trades on the back foot on Wednesday after surging to a fresh all-time high near $4,526 earlier in the day. Volatility picked up amid thin holiday liquidity ahead of Christmas, encouraging mild profit-taking at elevated levels. At the time of writing, XAU/USD trades around $4,470, up nearly 3% this week. Bullion’s historic rally this year has been nothing short of remarkable, with prices up more than 70% year to date, putting Gold on track for its strongest annual performance since 1979. The rally has been driven by strong safe-haven demand amid persistent geopolitical risks and economic uncertainties, as well as robust institutional and investment flows. ⭐️Personal comments NOVA: Uptrend continues towards the end of 2025, with bulls reaching new all-time highs above 4600. 🔥 Technically: Based on the resistance and support areas of the gold price according to the H4 frame, NOVA identifies the important key areas as follows: Resistance: $4561, $4695 Support: $4448, $4376 🔥 NOTE: Note: Nova wishes traders to manage their capital well - take the number of lots that match your capital - Takeprofit equal to 4-6% of capital account - Stoplose equal to 2-3% of capital account - The winner is the one who sticks with the market the longest
Nova-Scalper
پیشبینی شگفتانگیز: طلا تا پایان ۲۰۲۵ از ۴۵۰۰ دلار عبور میکند؟

⭐️GOLDEN INFORMATION: The stronger-than-expected GDP print stood in contrast to a broader set of softer US macro indicators. Durable Goods Orders declined by 2.2% in October, while Industrial Production slipped 0.1% month-on-month in October before staging only a modest rebound of 0.2% in November. At the same time, Conference Board Consumer Confidence fell to 89.1 in December from an upwardly revised 92.9 in November, collectively keeping the US Dollar under pressure. Against this backdrop, the US Dollar Index (DXY), which measures the Greenback against a basket of six major currencies, is trading near 97.96, lingering just above its lowest level since October 3 and reflecting persistent bearish sentiment toward the currency. ⭐️Personal comments NOVA: Gold prices continue to reach new all-time highs after Christmas, maintaining strong buying pressure and continuing their upward trend towards the end of 2025. ⭐️SET UP GOLD PRICE: 🔥SELL GOLD zone: 4574 - 4576 SL 4581 TP1: $4560 TP2: $4545 TP3: $4530 🔥BUY GOLD zone: 4432 - 4430 SL 4425 TP1: $4445 TP2: $4460 TP3: $4475 ⭐️Technical analysis: Based on technical indicators EMA 34, EMA89 and support resistance areas to set up a reasonable BUY order. ⭐️NOTE: Note: Nova wishes traders to manage their capital well - take the number of lots that match your capital - Takeprofit equal to 4-6% of capital account - Stoplose equal to 2-3% of capital account
Disclaimer
Any content and materials included in Sahmeto's website and official communication channels are a compilation of personal opinions and analyses and are not binding. They do not constitute any recommendation for buying, selling, entering or exiting the stock market and cryptocurrency market. Also, all news and analyses included in the website and channels are merely republished information from official and unofficial domestic and foreign sources, and it is obvious that users of the said content are responsible for following up and ensuring the authenticity and accuracy of the materials. Therefore, while disclaiming responsibility, it is declared that the responsibility for any decision-making, action, and potential profit and loss in the capital market and cryptocurrency market lies with the trader.