Technical analysis by cryptodailyuk about Symbol BTC on 11/29/2025

cryptodailyuk
تحلیل تکنیکال بیت کوین (15 دقیقهای): سطوح کلیدی و سناریوهای کوتاه مدت
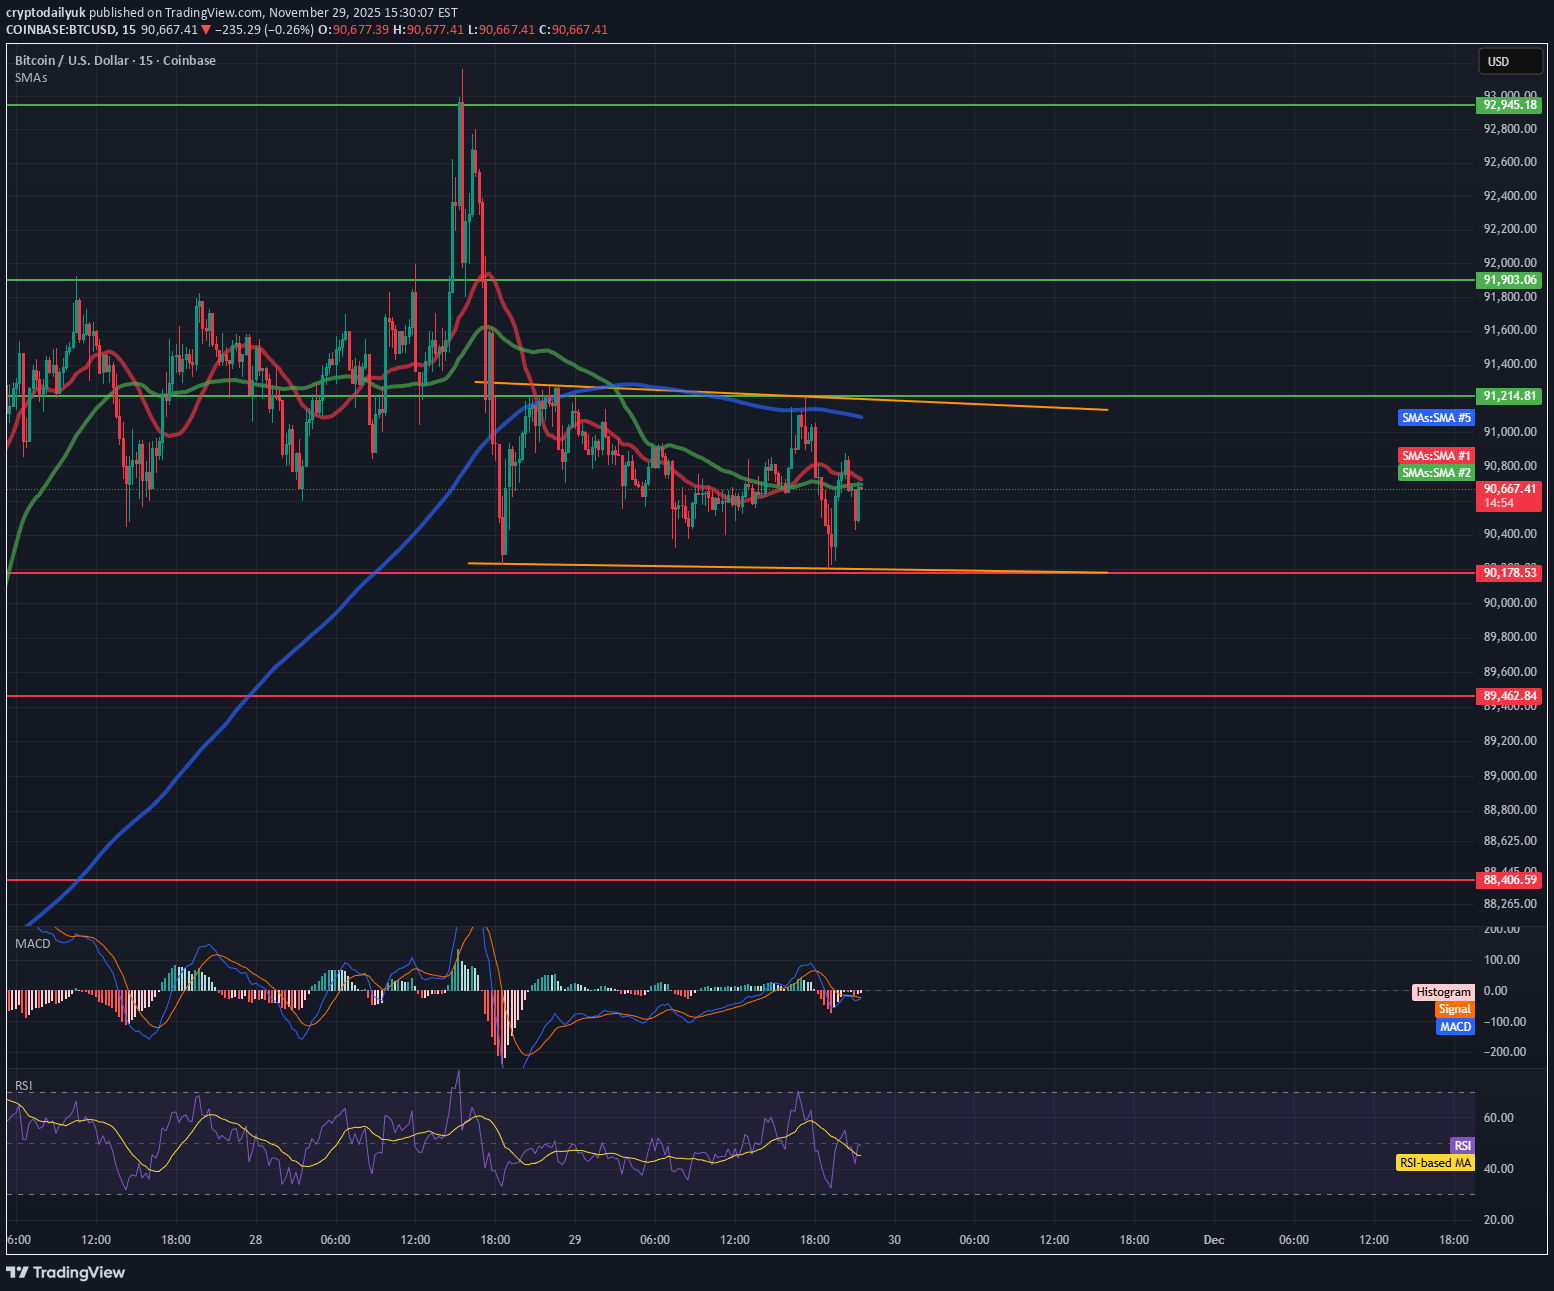
📉 BTC 15M — Short-Term Analysis 1. Key Levels from the Chart Support $90,400–$90,450 – strong, repeatedly tested (orange zone). $90,178 – lower support (thin red line). $89,460 – deeper daily support. Resistance $90,900–$91,000 – local resistance zone. $91,214–$91,545 – SMA 72 / SMA 200 (yellow and blue) = strong dynamic resistance. $91,800–$92,200 – higher structural resistance. 🧠 2. Market Structure Short-term trend (15m) Price remains below the SMA 200 and SMA 72 → bearish momentum. Lower highs and lower lows are visible → bearish structure. Narrower range: 90,400 – 90,900 → price compression / consolidation. 📊 3. Indicators MACD – neutral / slightly bearish Histogram hovers around zero → lack of strong momentum. Recent downward crossover → downward pressure. RSI – 48 (neutral) Not oversold yet, but: RSI is forming a bearish divergence from previous highs. RSI often bounces from 50 in a downtrend → confirms bearish pressure. 🔎 4. What's happening now? The price is retesting the $90,400 zone, a key defensive level for bulls. The structure indicates: supply pressure, buyers exhausting themselves below the 200 SMA, possible breakout below if 90,400 breaks. 🎯 5. Short-Term Scenarios (15m) 🔻 Bearish Scenario (more likely) If 90,400 falls: Target 1: 90,180 Target 2: 89,460 Target 3: 88,960 The structure strongly suggests this because: Price below the 200 SMA Weak momentum No strong rebound from the lows 🔼 Bullish Scenario (only after breaking 90,900) If the market rebounds from 90,400 and breaks 90,900: Target 1: 91,200 (SMA 72 + 200) Target 2: 91,550 Target 3: 91 800