Technical analysis by ZareeFxTradingAac about Symbol BTC: Buy recommendation (2 hour ago)

ZareeFxTradingAac
بیت کوین به کجا میرود؟ حمله نهایی به مقاومت ۹۴ هزار دلاری!
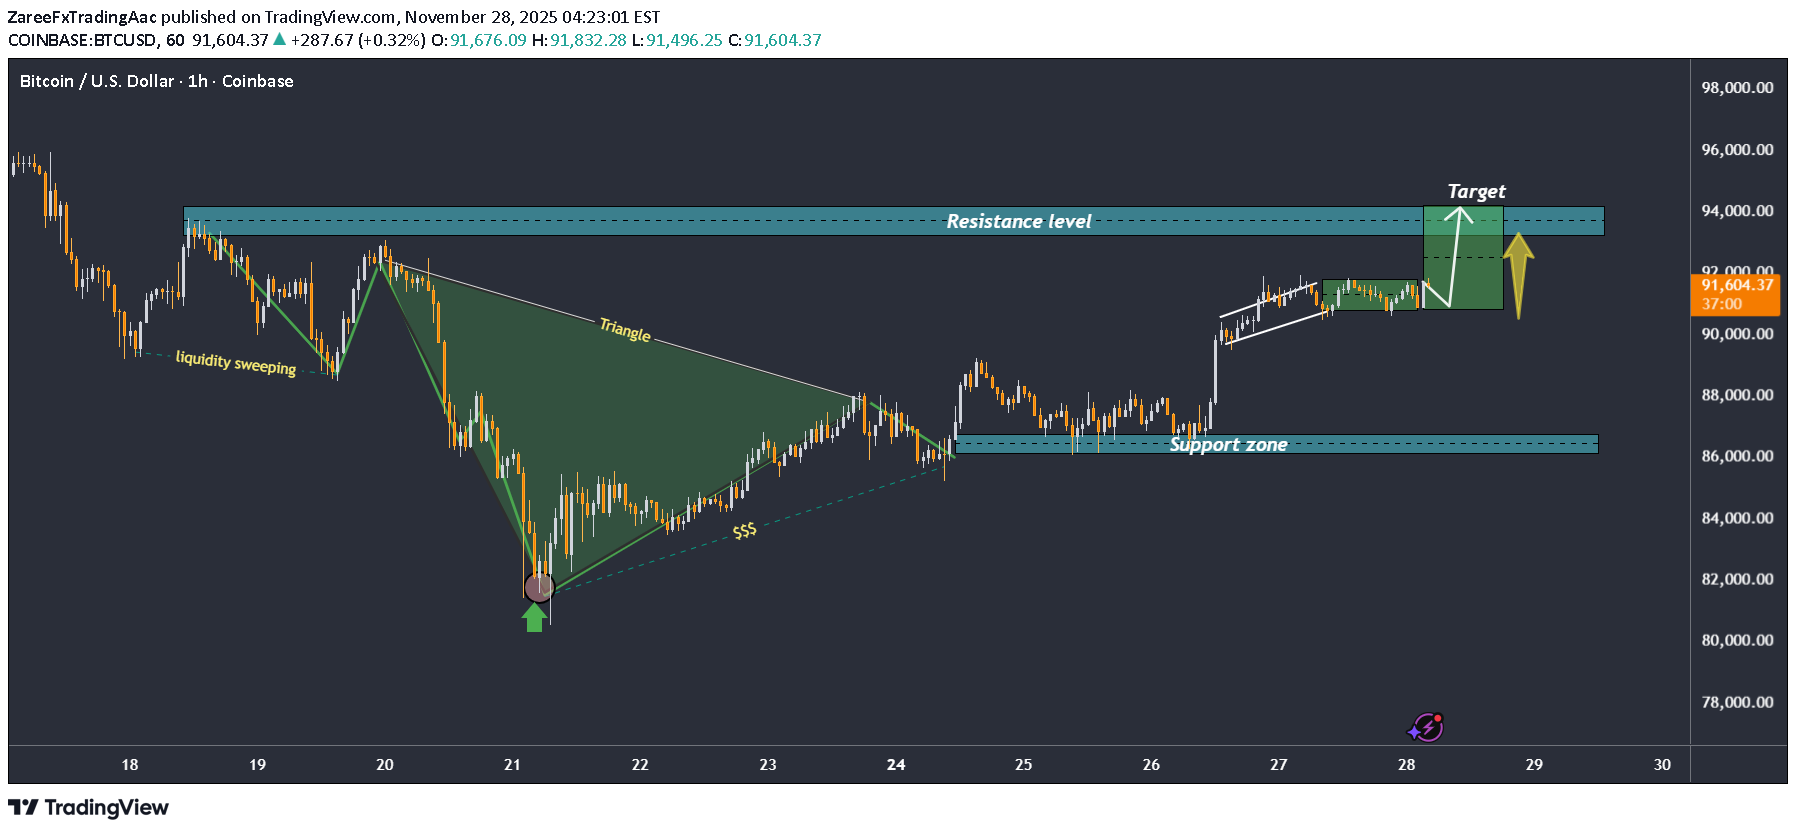
(Chart Analysis) Market Structure Overview The chart displays Bitcoin (BTC/USD) on the 1-hour timeframe, showing a transition from a bearish decline into a bullish recovery. Price action includes a liquidity sweep, a triangle breakout, formation of a support zone, and a current bullish consolidation approaching a key resistance. 1. Liquidity Sweep & Triangle Reversal On the left side of the chart, price swept liquidity below a prior low before forming a large descending triangle. Once the triangle broke to the upside, it signaled: Exhaustion of selling pressure Entry of buyers from lower liquidity levels Shift toward bullish market structure This marks the beginning of the uptrend visible in the chart. 2. Establishing the Support Zone (≈ $86K–$87.5K) Price formed a well-defined horizontal support zone following the breakout. This zone shows: Multiple strong rejections Buyer presence A reliable base for further upward continuation Each retest of this area produced a higher move, reinforcing it as major demand. 3. Bullish Channel / Flag Formation Price is currently trading within a bullish ascending channel (flag-like structure). This typically represents: Short-term consolidation Market compression Preparation for the next leg up Maintaining this channel is a positive sign for continued upside momentum. 4. Targeting Major Resistance (≈ $93.5K–$94.5K) The chart highlights a large resistance zone overhead, shown in blue. This zone is the likely destination of the next bullish move. The marked green “Target” box reflects: Expected liquidity fill Key supply area Probable short-term price objective A wick into this zone or a temporary rejection is likely before any sustained breakout above it. 5. Bullish Scenario If price holds above the rising channel support: Break above current consolidation Move directly into $93.5K–$94.5K Potential liquidity sweep above resistance Possible retest afterward This is the most probable scenario based on current structure. 6. Bearish Invalidations A bearish breakdown would occur if BTC loses: Channel support $90K short-term structure $87K major support zone Below these levels, momentum shifts back to sellers. Conclusion The chart indicates a Bullish Continuation Pattern with a strong probability of Bitcoin targeting the $93.5K–$94.5K resistance zone next. The market currently rests in a constructive consolidation, and as long as support holds, the uptrend remains intact.