Technical analysis by SiDec about Symbol BTC: Sell recommendation (11/23/2025)

SiDec
هشدار زمستان بیت کوین: سقوط 36 درصدی؛ آیا زمان فروش فرا رسیده است؟
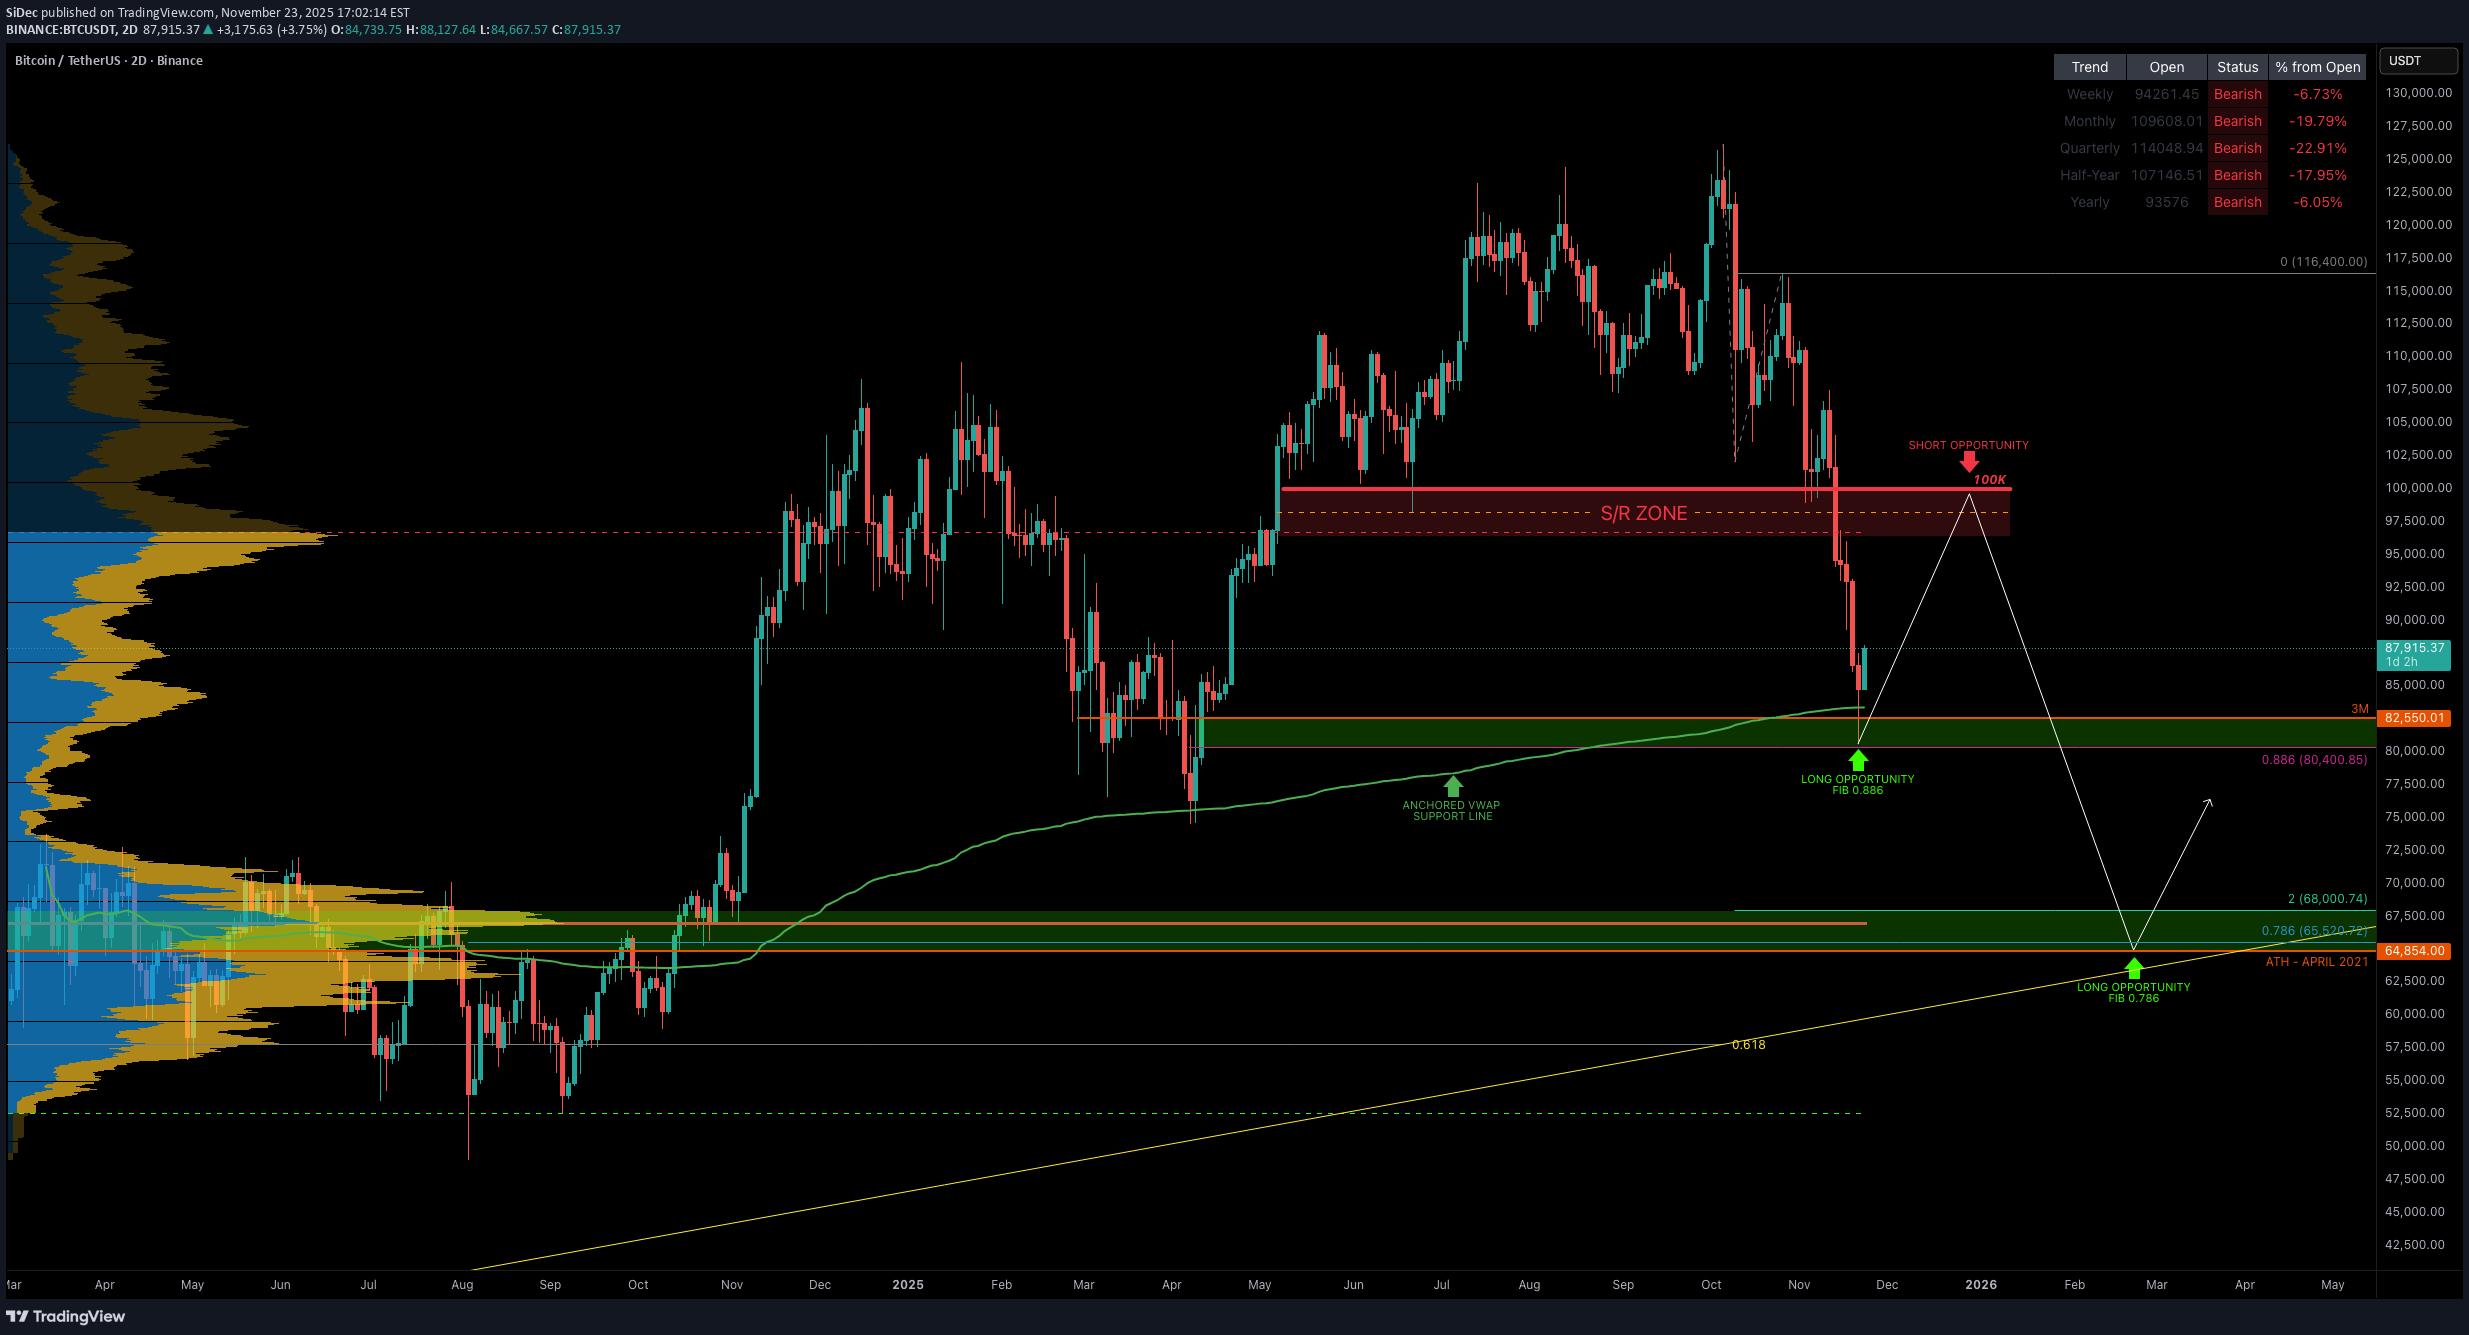
Is the Bitcoin bear market here? A deep dive Into cycles, tech risks & what comes next. Bitcoin has now dropped –36% from its all-time high in just 46 days, and naturally the big questions emerge: Has the bear market officially begun? How long could it last? And what catalysts could accelerate it? Let’s break this down from cycle structure to macro-technological risks. BTC Has Turned Bearish Across All Major Timeframes Bitcoin is now trading below the yearly open at $93,576, flipping all major timeframes into bearish alignment (from the daily to the yearly). Monthly MACD Bearish Cross Incoming The monthly MACD is set to print a bearish crossover this month. The last bullish MACD phase lasted 28 months, which has now ended → a strong macro signal. Cycle Timing: What History Says Historically, Bitcoin bottoms approximately one year after the top: 2017 → 2018: 363 days 2021 → 2022: 376 days If the current cycle repeats, the macro bottom may form around: October 2026 The previous bull market lasted 1061 days, this one 1050 days → almost identical. This strongly supports the thesis that the cycle has already peaked. How Low Could Bitcoin Go? Macro target: 0.786 Fibonacci Retracement → $39,173 Aligning with: Half-year 21 EMA confluence Macro corrective structures Prior cycle bear market depth Historical Precedent: The 2022 Bottom Zone Back in 2022, Bitcoin spent 210 days (over 7 months) consolidating at the bottom of the bear market. This was especially clear on the weekly timeframe, where price formed a clean multi-month accumulation range. Weekly TF: Daily TF: This is crucial context: 👉 The market gave more than half a year to load up at the bottom. No chasing, no rushing → anyone paying attention had time to scale into positions for the next cycle. The 2025 Macro Top Landed Perfectly in the 1.618–1.666 Fib Target Fib 1.618–1.666 → $122,056 – $125,218 This area was the ideal sell zone, and Bitcoin respected it perfectly. What happened after hitting the Fib target? The market entered a 3-month distribution phase, giving plenty of time to: scale out take profit derisk rotate into stablecoins or simplified portfolios Then came the aggressive sell-off → classic macro cycle behavior. Macro Catalysts That Could Drive the Bear Market Deeper 1️⃣ Quantum Computing Acceleration A credible quantum breakthrough (or even a strong rumor) could trigger systemic fear. Bitcoin’s ECDSA signatures are theoretically vulnerable to quantum attack models. 2️⃣ Fast-Paced AI Threats AI is accelerating: algorithmic optimization cryptographic analysis zero-day discovery hardware design The risk matrix is evolving faster than coding standards can update. 3️⃣ Regulatory Momentum Expect: stablecoin restrictions exchange tightening AML/KYC global enforcement This would accelerate risk-off behavior. Technical Confluence: Where BTC Is Now Monthly 21 EMA/SMA → 86.6K Current support test. Quarterly (3M) 21 EMA/SMA EMA: $58.5K SMA: $53.5K Strong structural support zone. Half-Year (6M) 21 EMA/SMA EMA: $39.5K SMA: $29.8K The EMA aligns perfectly with the 0.786 retracement → $39,173. Remember that the EMA/SMA levels mentioned are dynamic and will continue to shift over time as new price data comes in, so these confluence zones will gradually adjust. Additional Confluence: Potential Head & Shoulders (Bars Pattern Symmetry) A potential Head & Shoulders Pattern is forming in symmetry with the previous bull market top, as shown through the bars pattern overlay. Trading Playbook: Short the Bull Trap The most likely scenario: BTC bounces into $95K–$100K → traps late bulls → rejects → cascade lower Targets: TP1: $76K TP2: $70K Remaining: trail into $65K → $58K → $39K Final Outlook Bitcoin is now deeply aligned with a macro reversal: Perfect Fib 1.618–1.666 top Break of yearly open Cycle timing consistent Monthly MACD turning bearish Quantum + AI risk factors accelerating Structural confluence targets $70K → $40K Pattern mirroring the previous cycle top _________________________________ 💬 If you found this helpful, drop a like and comment!100K level matches up well with both monthly and yearly VWAP (mVWAP/yVWAP):