Technical analysis by ZareeFxTradingAac about Symbol BTC: Sell recommendation (11/23/2025)

ZareeFxTradingAac
تحلیل بیت کوین: آیا گوه صعودی در مقاومت مهم، سقوط بزرگ در راه است؟
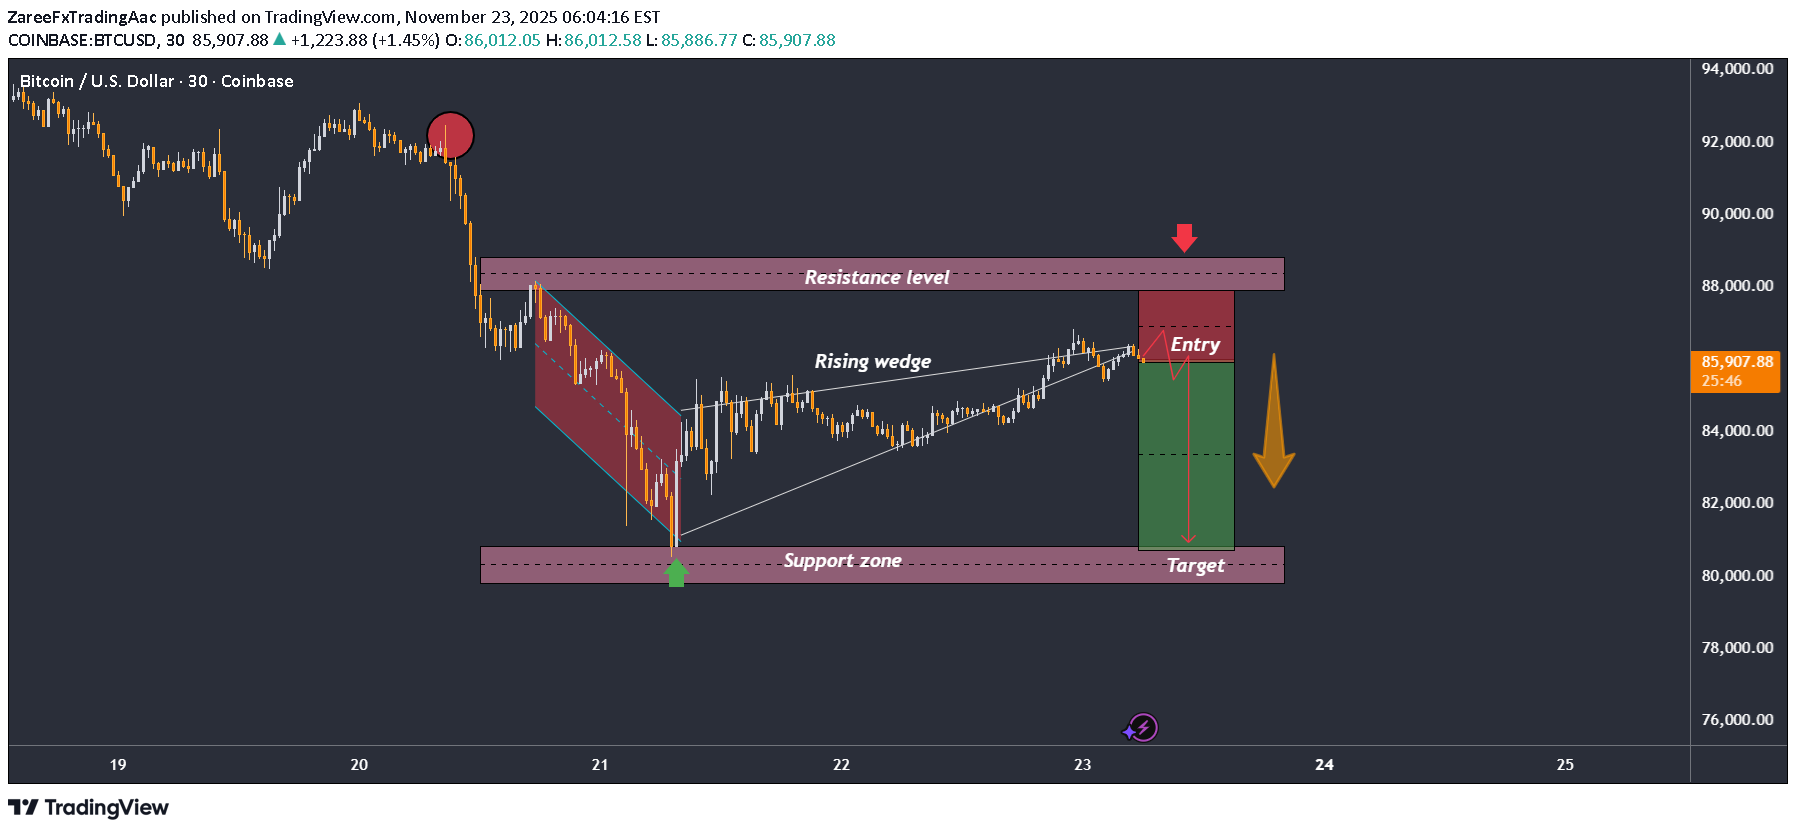
Chart Analysis The chart shows Bitcoin trading within a rising wedge, a pattern that typically signals weakening bullish momentum and a potential bearish reversal. Price is approaching a major resistance level, where previous selling pressure caused a sharp drop (highlighted with the red circle). Key observations: 1. Major Resistance Zone The upper shaded band marks a strong resistance area, previously rejected with high volatility. Price is now retesting this zone, increasing the likelihood of another rejection. 2. Rising Wedge Formation BTC has climbed in a narrowing upward structure, indicating slowing momentum. Rising wedges often break downward, especially when they form below strong resistance. 3. Bearish Entry Region The red/green box marks a short entry area positioned directly at resistance. A break below the wedge’s lower trendline would confirm bearish momentum. 4. Downward Target Zone The shaded lower zone is labeled as the support zone / target. This aligns with the previous demand area where buyers stepped in. 5. Expected Move If price fails to break resistance, a wedge breakdown could send BTC toward the support zone. The orange downward arrow illustrates this expected move.