Technical analysis by Houseofcryptokings about Symbol BTC on 11/22/2025

Houseofcryptokings
پیشبینی کف بیت کوین در سال 2026: آیا منتظر سقوط تا 40 هزار دلار باشیم؟
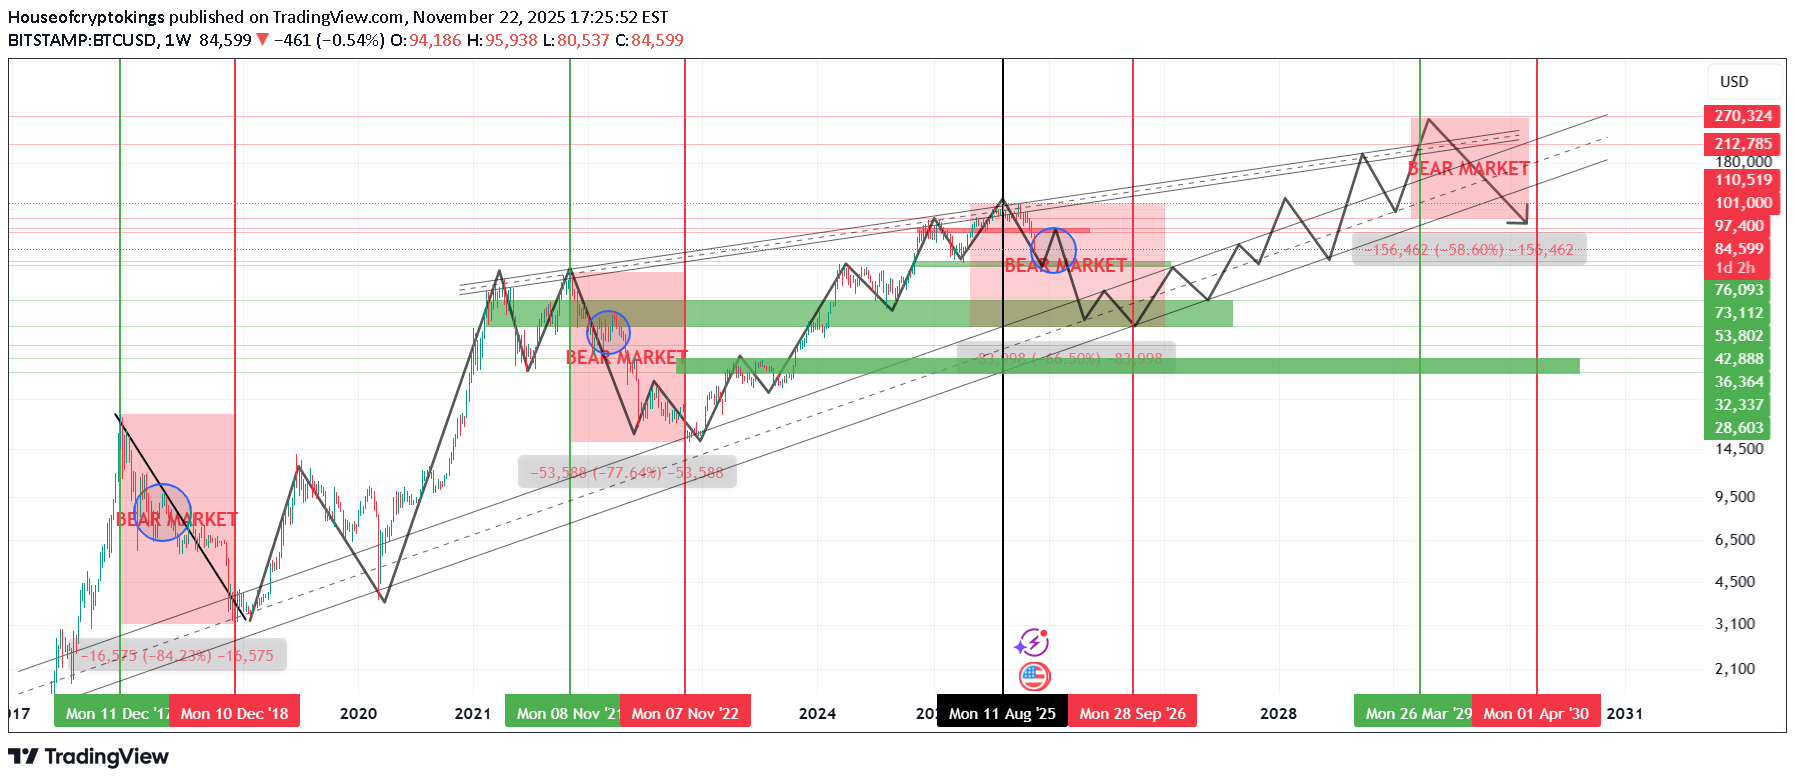
Bitcoin Macro Cycle Analysis (2013–2029) | Rising Wedge Breakdown • 2026 Bear Market Targets • Historical % Drops & Next Accumulation Zone Bitcoin historical data strongly follows multi-year macro cycles , where each bull market has been followed by a deep bear market correction: 📉 2nd Cycle (2017–2018) Top: 19,666 (17 Dec 2017) Bottom: 3,122 (15 Dec 2018) Correction: –84.23% 📉 3rd Cycle (2021–2022) Top: 68,997 (8 Nov 2021) Bottom: 15,479 (9 Nov 2022) Correction: –76.64% 📉 4th Cycle (2025–2026 – Ongoing) Top: 126,272 (6 Oct 2025) Rising Wedge + Distribution Phase breakdown confirms bearish structure shift Based on historical cycle behavior and on-chain indicators, Bitcoin has entered the 4th major bear market 📍 Projected Bottom Zone (2026) Primary Support Zone: ➡️ $40,000 – $42,000 – $45,382 (Aligned with Wedge Breakdown + Macro Support) Percentage-Based Targets: –68.16% drop: → ≈ $40,000 –74% historical drop scenario: → ≈ $31,000 (max capitulation zone) 📅 Expected Bottom Window: September – October 2026 → Historically the strongest long-term buying opportunity . 📈 5th Cycle Expectations (2026–2029) Bitcoin has been following a Long-Term Rising Wedge (Bearish Continuation / Reversal Pattern) since 2021. This pattern is expected to fully complete by April 2029 → leading into a new long-term top and then the 5th bear market . ⭐ Why This Analysis Matters Combines **cycle history**, **on-chain metrics**, **pattern analysis**, and **macro support zones** Helps identify high-probability long-term Bitcoin accumulation levels Useful for swing traders, long-term investors, and cycle-based portfolio strategies 🔔 If You Find This Analysis Helpful 👍 Like • 💬 Comment • ⭐ Save It motivates me to share more high-quality Bitcoin cycle research!