Technical analysis by WhiteBIT about Symbol BTC on 11/21/2025
شکار نهنگها: راز نقدینگی و تلههای بازار که نباید در آنها گیر کنید!
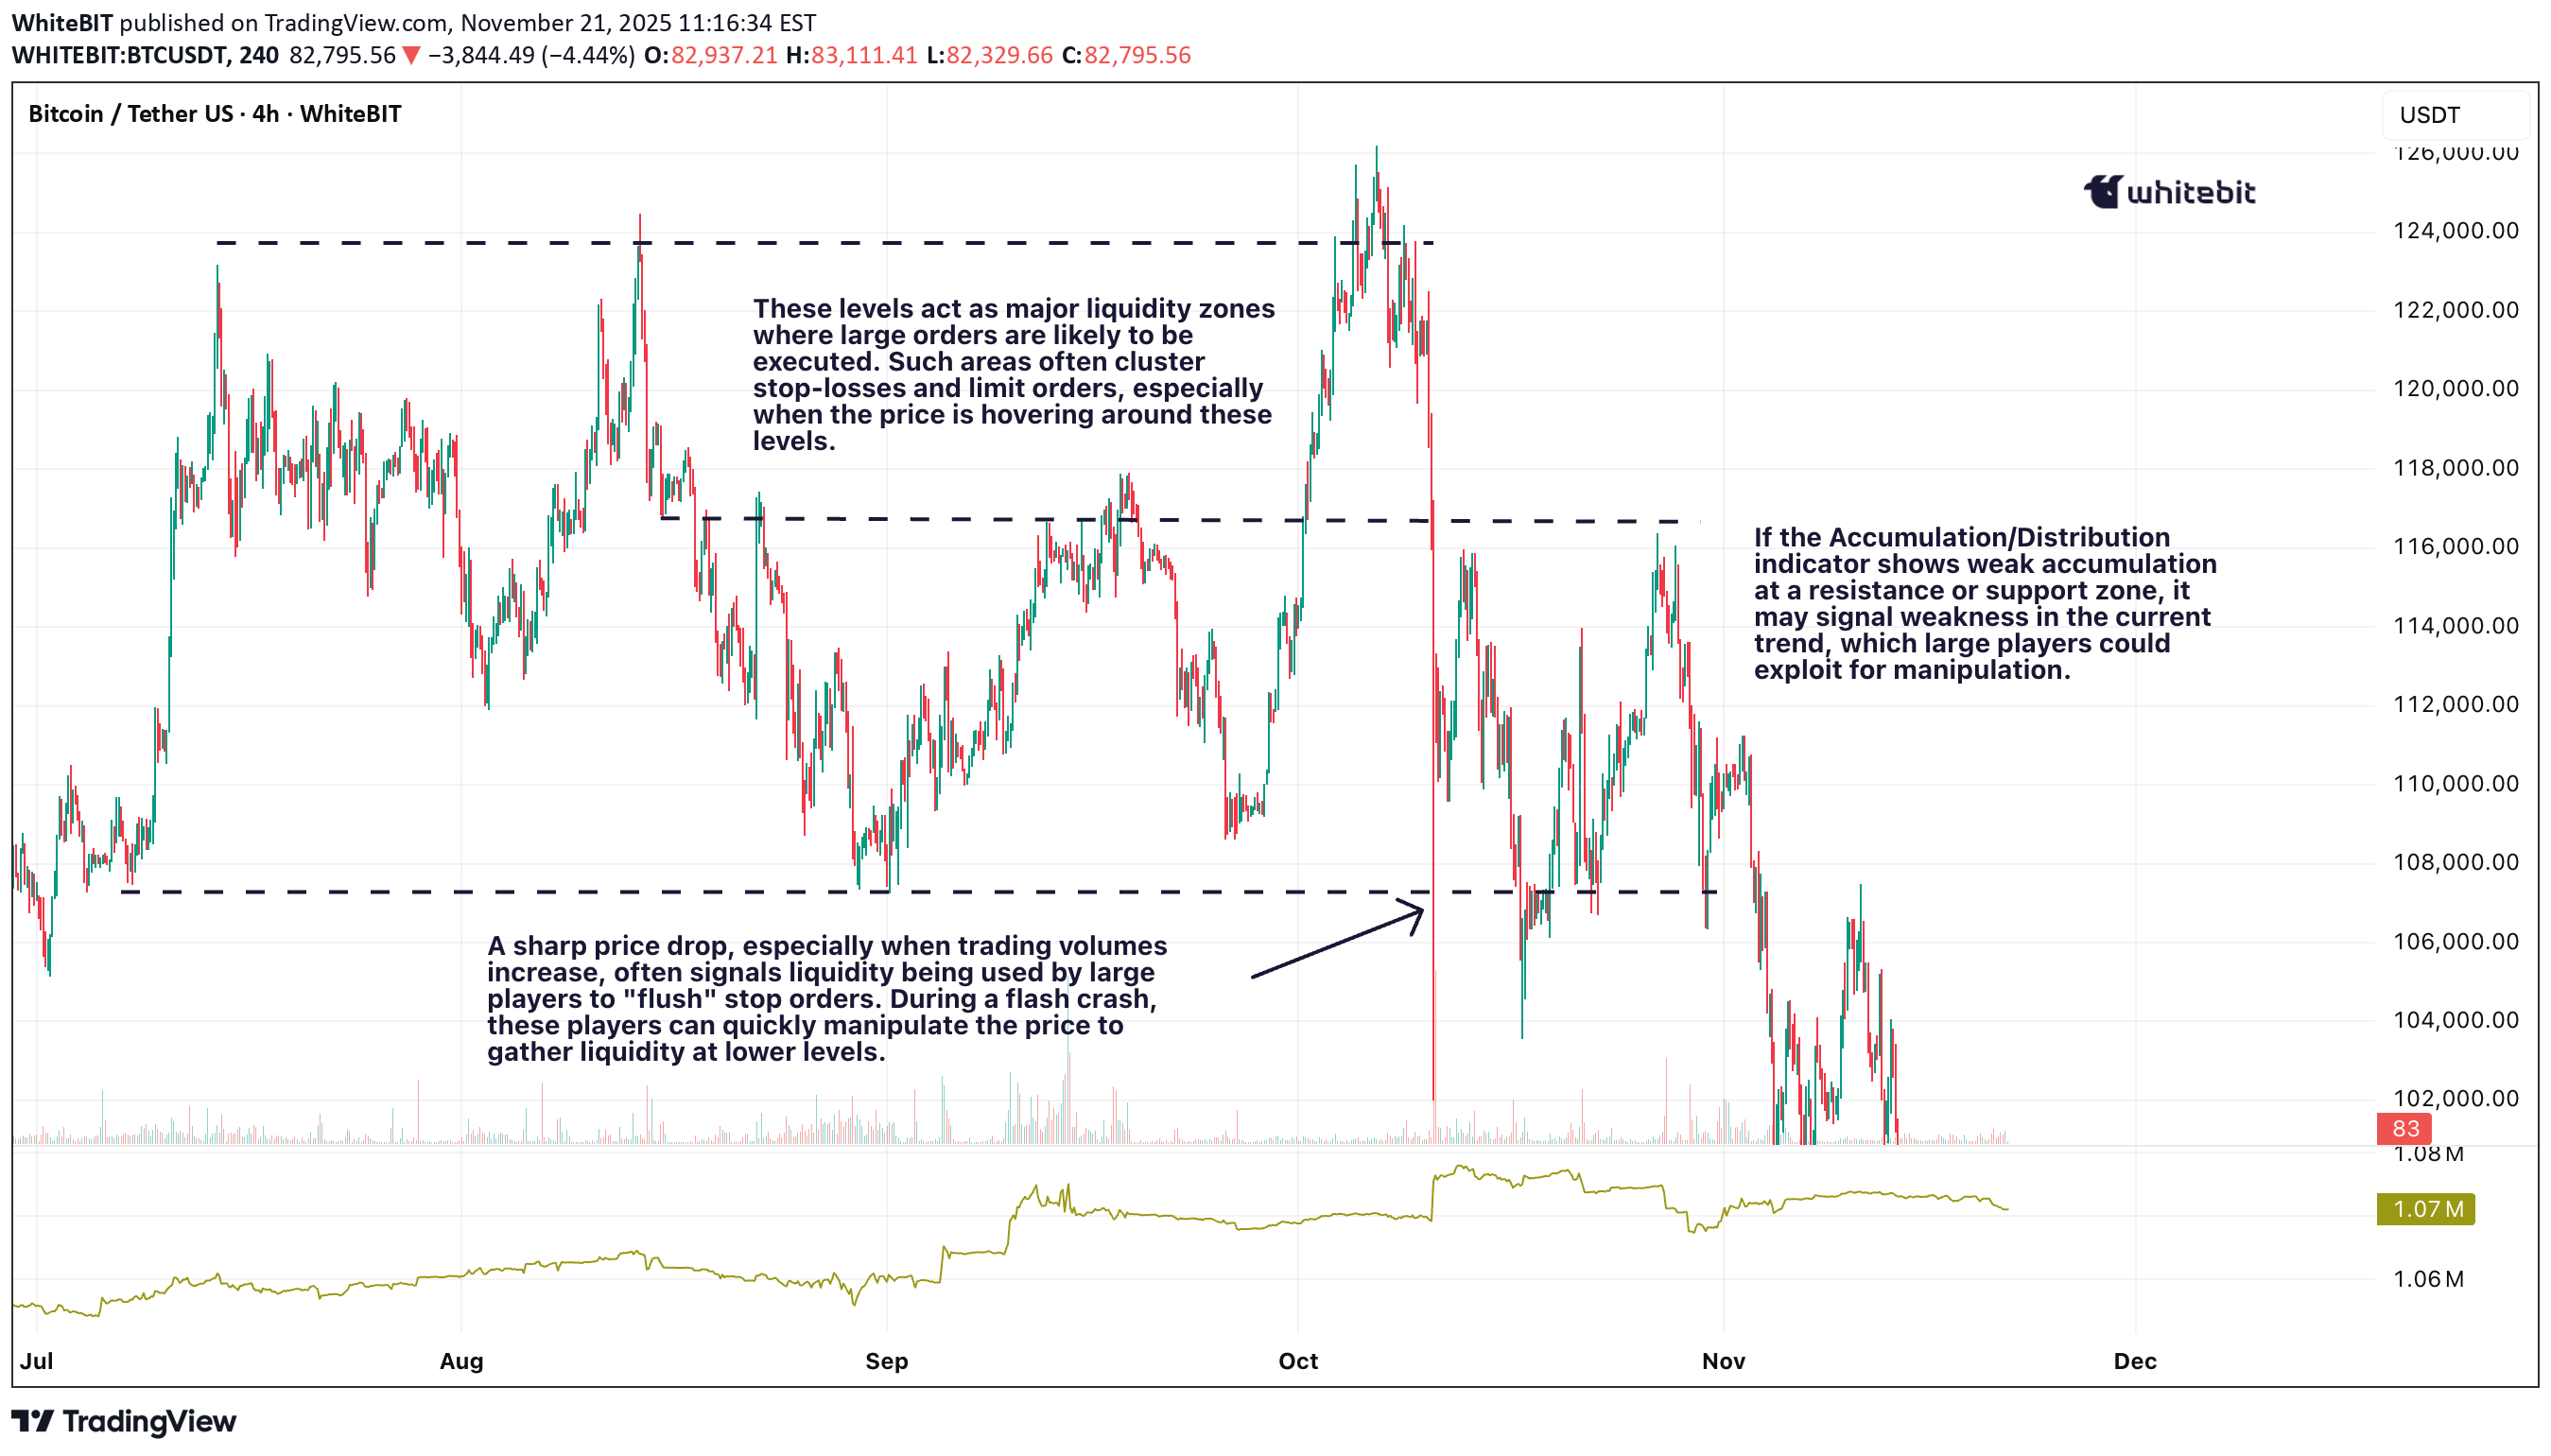
Ever wonder why prices always seem to drop just below your stop loss before bouncing back? It’s not bad luck; it’s liquidity in action. The big players are prowling, hunting for stops, and if you don't understand where they’re lurking, you might just be their next target. Liquidity definition refers to how easily an asset can be bought or sold without significantly affecting its price, and in the world of crypto, this dynamic can make or break your trade. Let’s dig into how these whales work the market and how you can avoid becoming their prey. What is Liquidity? Liquidity meaning refers to how easily an asset can be bought or sold without affecting its price. In the context of crypto, it's crucial to know that high liquidity means less slippage, while low liquidity can lead to sharp price moves. Market liquidity is essential for smooth trading, but it also creates opportunities for big players to manipulate price action by targeting stop losses. Liquidity Risk and Big Players Liquidity risk arises when there's not enough liquidity to execute trades efficiently, especially during volatile periods. Big players exploit these conditions by pushing prices through key support and resistance levels, triggering stop orders and capturing liquidity. This is why it’s vital to be aware of where liquidity is concentrated — big players often target areas with many stop losses, trapping retail traders in the process. Tools to Analyze Liquidity Volume Indicators: Use tools like Accumulation/Distribution or On-Balance Volume (OBV) to spot surges in volume that may indicate manipulation or big players entering the market. Bitcoin Liquidity Heatmap: A Bitcoin liquidity heatmap shows where large buy and sell orders are placed, helping you avoid areas where liquidity is likely to be targeted by whales. Liquidity Ratio Formula: Another great tool which helps measure market depth and liquidity. You can calculate it as: A higher ratio indicates that there is more buying pressure, suggesting the market is more liquid and less prone to manipulation. On the other hand, a lower ratio signals more sell orders, which could expose you to increased liquidity risk and higher chances of price manipulation by big players. Price Action: Watch for candlestick patterns like pin bars or engulfing candles near key support or resistance levels to anticipate price reversals after stop hunts. Conclusion While tools like volume indicators and Bitcoin liquidity heatmaps can help, always stay vigilant. Use wider stop losses to avoid getting trapped at key levels, and stay cautious during periods of low liquidity when whales are most active. This article isn’t trading advice — always DYOR and trade responsibly.