Technical analysis by behdark about Symbol BTC on 11/21/2025

behdark
آیا بیت کوین واقعاً به یک میلیون دلار میرسد؟ تحلیل موجی راز آینده قیمت!
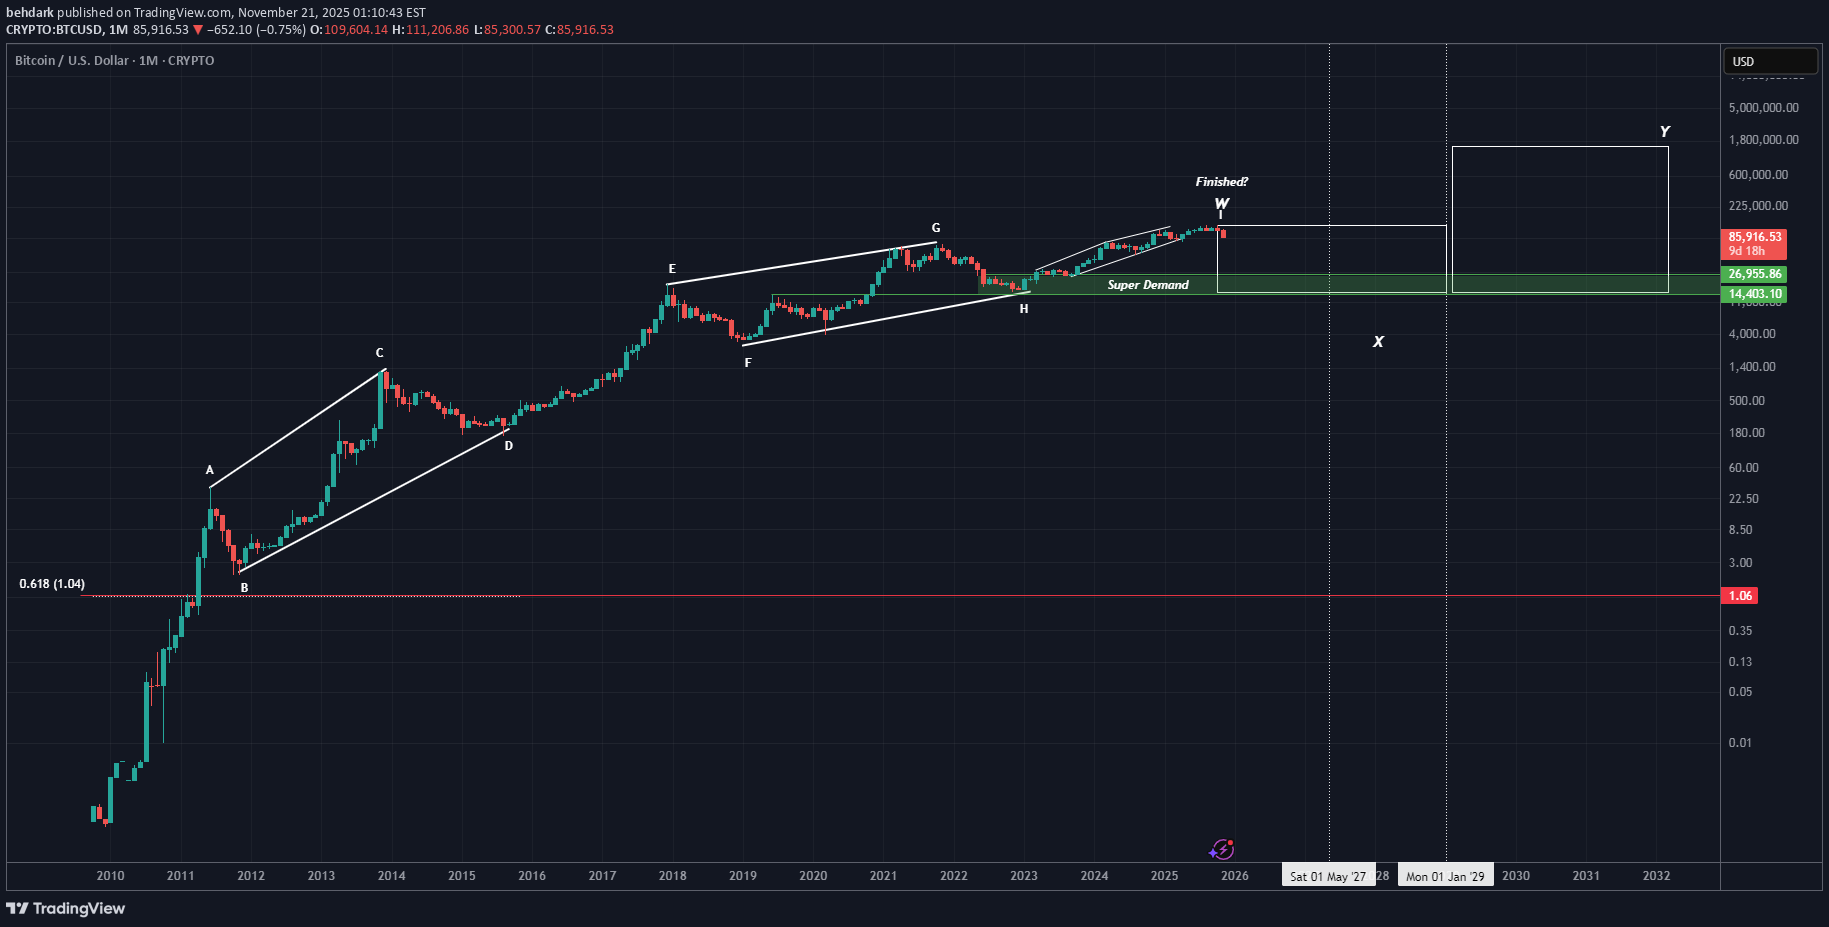
Is it really possible for Bitcoin to reach one million dollars? This is the complete Bitcoin data | from when it was $0.01 up to the last all-time high of $125K. Whether we like it or not, a large-degree pattern on Bitcoin is reaching completion, and we are looking at the chart without bias, purely through wave theory. The symmetrical pattern you see on the chart is on the monthly or 2-week timeframe. We are currently in the final wave, wave i of W. Wave i of W itself is a diagonal or symmetrical pattern (which we discussed in THIS POST (tradingview.com/chart/BTCUSDT/GrOlpNXE-Has-The-BITCOIN-Bear-Cycle-Started-1W/) |this post only concerns branch i of W of this pattern). When such a large pattern completes, there are two possibilities: A counter cycle of the same degree begins , or An X wave forms. First scenario: forming a new pattern is very unlikely because if it happens, the Fibonacci 0.618 target of this pattern would be reached | around $4–$10 for Bitcoin. If this happens, the entire crypto market would effectively become a scam. This scenario is highly improbable and currently illogical. Second scenario: the formation of an X wave. It’s worth explaining X waves: X waves connect patterns of the same degree without requiring large time-price corrections relative to the previous pattern, allowing a phase | whether bullish or bearish | to extend. Here, since the first phase is bullish, the pattern after the X wave will also be bullish. For Bitcoin, if an X wave forms, the best range for it to end is $32K–$14K, and the X wave could last until 2027–2028. The two time lines indicate where the X wave could end. When a new cycle begins, it is of the same degree as the previous pattern. This means we will have years of bullish phases with corrections, similar to the first phase W, which is represented on the chart from wave A to I. The target of the second pattern, Y, after the X wave, can realistically reach $1 million! The estimated time frame for reaching this target is 2031–2039, but why the 8-year tolerance? This accounts for the pattern type: if it’s a triangle, these targets could be reached faster, but if it’s another multi-branch pattern, the timing may extend. From a technical and wave-theory perspective, this is indeed possible. This is our broad 10-year outlook on Bitcoin. ❤️ Stay with us updates will be provided in the future with support and resistance zones plotted on the chart. Do you really think Bitcoin can reach $1 million?