Technical analysis by ArmanShabanTrading about Symbol BTC: Sell recommendation (11/18/2025)

ArmanShabanTrading
سقوط شدید بیت کوین: آیا سطوح تقاضای کلیدی مانع ریزش بیشتر میشوند؟
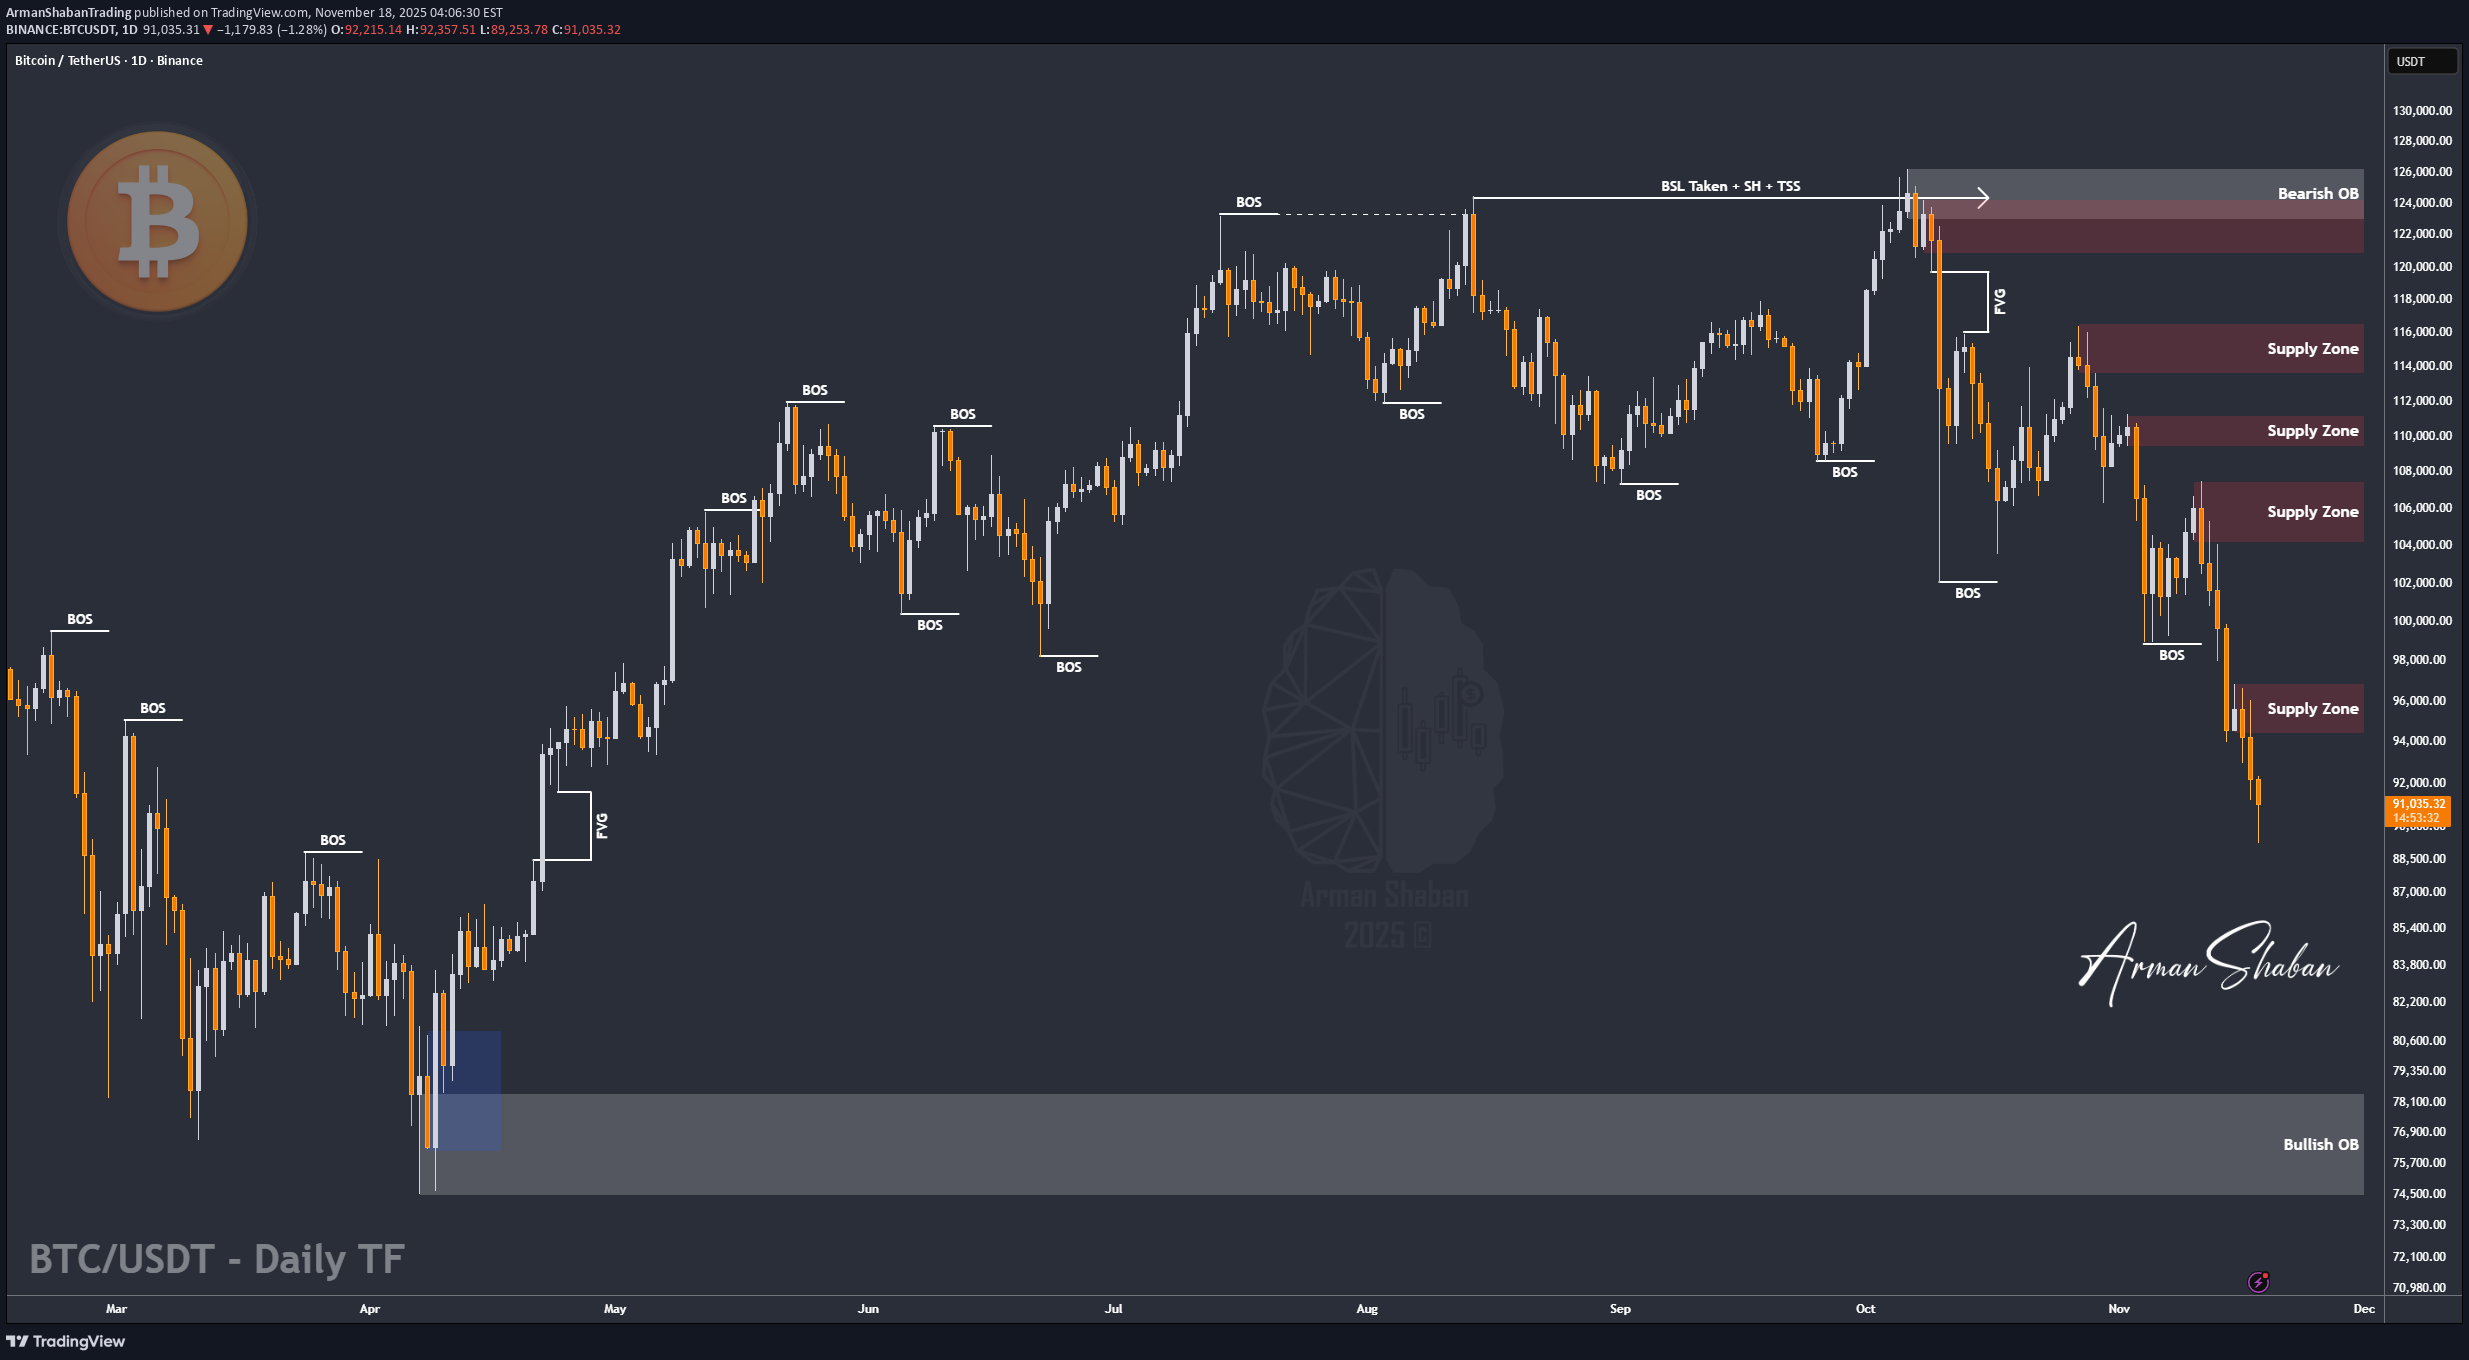
By analyzing the #Bitcoin chart on the daily timeframe, we can see that BTC failed to hold above $104,700, and as expected, this led to a heavy sell-off. First, the price dropped to $94,000, and then a second strong wave pushed it down to $89,000. Bitcoin is now trading around $91,000. Key supply zones and demand zones are marked on the chart. Important demand levels sit at $88,000, $84,000, and the larger zone at $74,000–$78,000. Watch how the price reacts to these areas. If Bitcoin wants to recover, it must first hold above these key zones. But if BTC breaks below $74,000, it could open the door for a deeper drop toward $50,000. For now, focus on price reactions at the marked demand levels. Please support me with your likes and comments to motivate me to share more analysis with you and share your opinion about the possible trend of this chart with me ! Best Regards , Arman Shaban