
ArmanShabanTrading
@t_ArmanShabanTrading

What symbols does the trader recommend buying?
Purchase History
پیام های تریدر
Filter
ArmanShabanTrading
رالی خیرهکننده تون کوین (TON): آیا صعود 20 درصدی ادامه دارد؟ (تحلیل و اهداف بعدی)

TON has surged from $1.65 to $1.95, delivering over 20% return since our last analysis. Price has held above the key $1.58 level and is now pushing aggressively higher, confirming short-term bullish momentum. If strength continues, next bullish targets to watch are $2.07, $2.22, $2.38, and $2.60. Please support me with your likes and comments to motivate me to share more analysis with you and share your opinion about the possible trend of this chart with me ! Best Regards , Arman ShabanTON is currently trading around $1.85 after reaching a local high of $1.95, maintaining over 12% gains since the last update. The main bullish structure remains intact, and price is still holding above the key $1.58–$1.65 support range. A short-term correction is possible, but as long as price stays above $1.74, the bullish bias remains valid. If strength resumes, next upside targets are $2.07, $2.22, $2.38, and $2.60.
ArmanShabanTrading
XAU/USD | Bullish Structure Remains Intact (READ THE CAPTION)

By analyzing the #Gold chart on the 4-hour timeframe, we can see that price first made a clean pullback to $4274, then strong demand stepped in and pushed gold sharply higher to $4440. After reaching this key psychological resistance, price corrected and is now trading around $4414. If gold can close and hold above $4404, we can expect further upside. That said, a short-term pullback toward the $4334–$4346 zone is still possible. With ongoing geopolitical risks, gold could even push toward levels above $4550 in the short term. Let’s see how the market reacts next. Please support me with your likes and comments to motivate me to share more analysis with you and share your opinion about the possible trend of this chart with me ! Best Regards , Arman ShabanBy analyzing the #Gold chart on the 4 hour timeframe, we can see that price moved exactly as expected. After correcting to $4396, gold started a new bullish move and delivered more than 950 pips, pushing above $4490. Right now, gold is trading around $4483, and with rising geopolitical tensions, this rally could continue without a deep correction. If momentum stays strong, upside targets above $4500 and even $4550 are on the table. All major supply and demand zones are marked on the chart. Keep a close eye on price reaction around these levels.
ArmanShabanTrading
Silver Already Showed The Playbook – Bitcoin Might Be Next!

When you compare XAGUSD and BTCUSD side by side, the similarity in structure is hard to ignore. Silver spent time consolidating, respected its higher lows, absorbed supply, and then expanded aggressively once the structure was confirmed. Bitcoin now appears to be in a very similar phase. At the moment, Bitcoin is trading around $88,000. The previous all-time high sits near $126,000. The most recent major November low was formed around $80,700. Importantly, price has not violated the $74,000 macro support, which remains a key level. This alone keeps the higher-timeframe structure intact and bullish. What we are seeing right now is not panic or distribution. Pullbacks are corrective, momentum remains controlled, and price continues to hold above key demand zones. This behavior suggests compression and energy build-up, not exhaustion. Silver already executed this sequence cleanly. Bitcoin has not broken down yet, and structurally, it is still behaving like an asset preparing for continuation rather than reversal. There is, however, a macro risk that cannot be ignored. Rising geopolitical tensions, especially the risk of escalation between Iran and Israel with potential U.S. involvement, could change market dynamics very quickly. Events like these can override any technical structure. That said, this analysis is based strictly on current price action and confirmed data, not on hypothetical scenarios. As long as price respects structure, the technical bias remains valid. From a long-term perspective, if Bitcoin continues to respect its macro supports and resumes expansion, the broader upside zone I am watching lies between $200,000 and $280,000. This is not a buy or sell signal. This is a structural comparison and a technical roadmap. The market often looks uncertain right before the next major leg begins. The real question is simple: Does Bitcoin follow Silver’s playbook, or does macro risk step in first? Let me know your view below.
ArmanShabanTrading
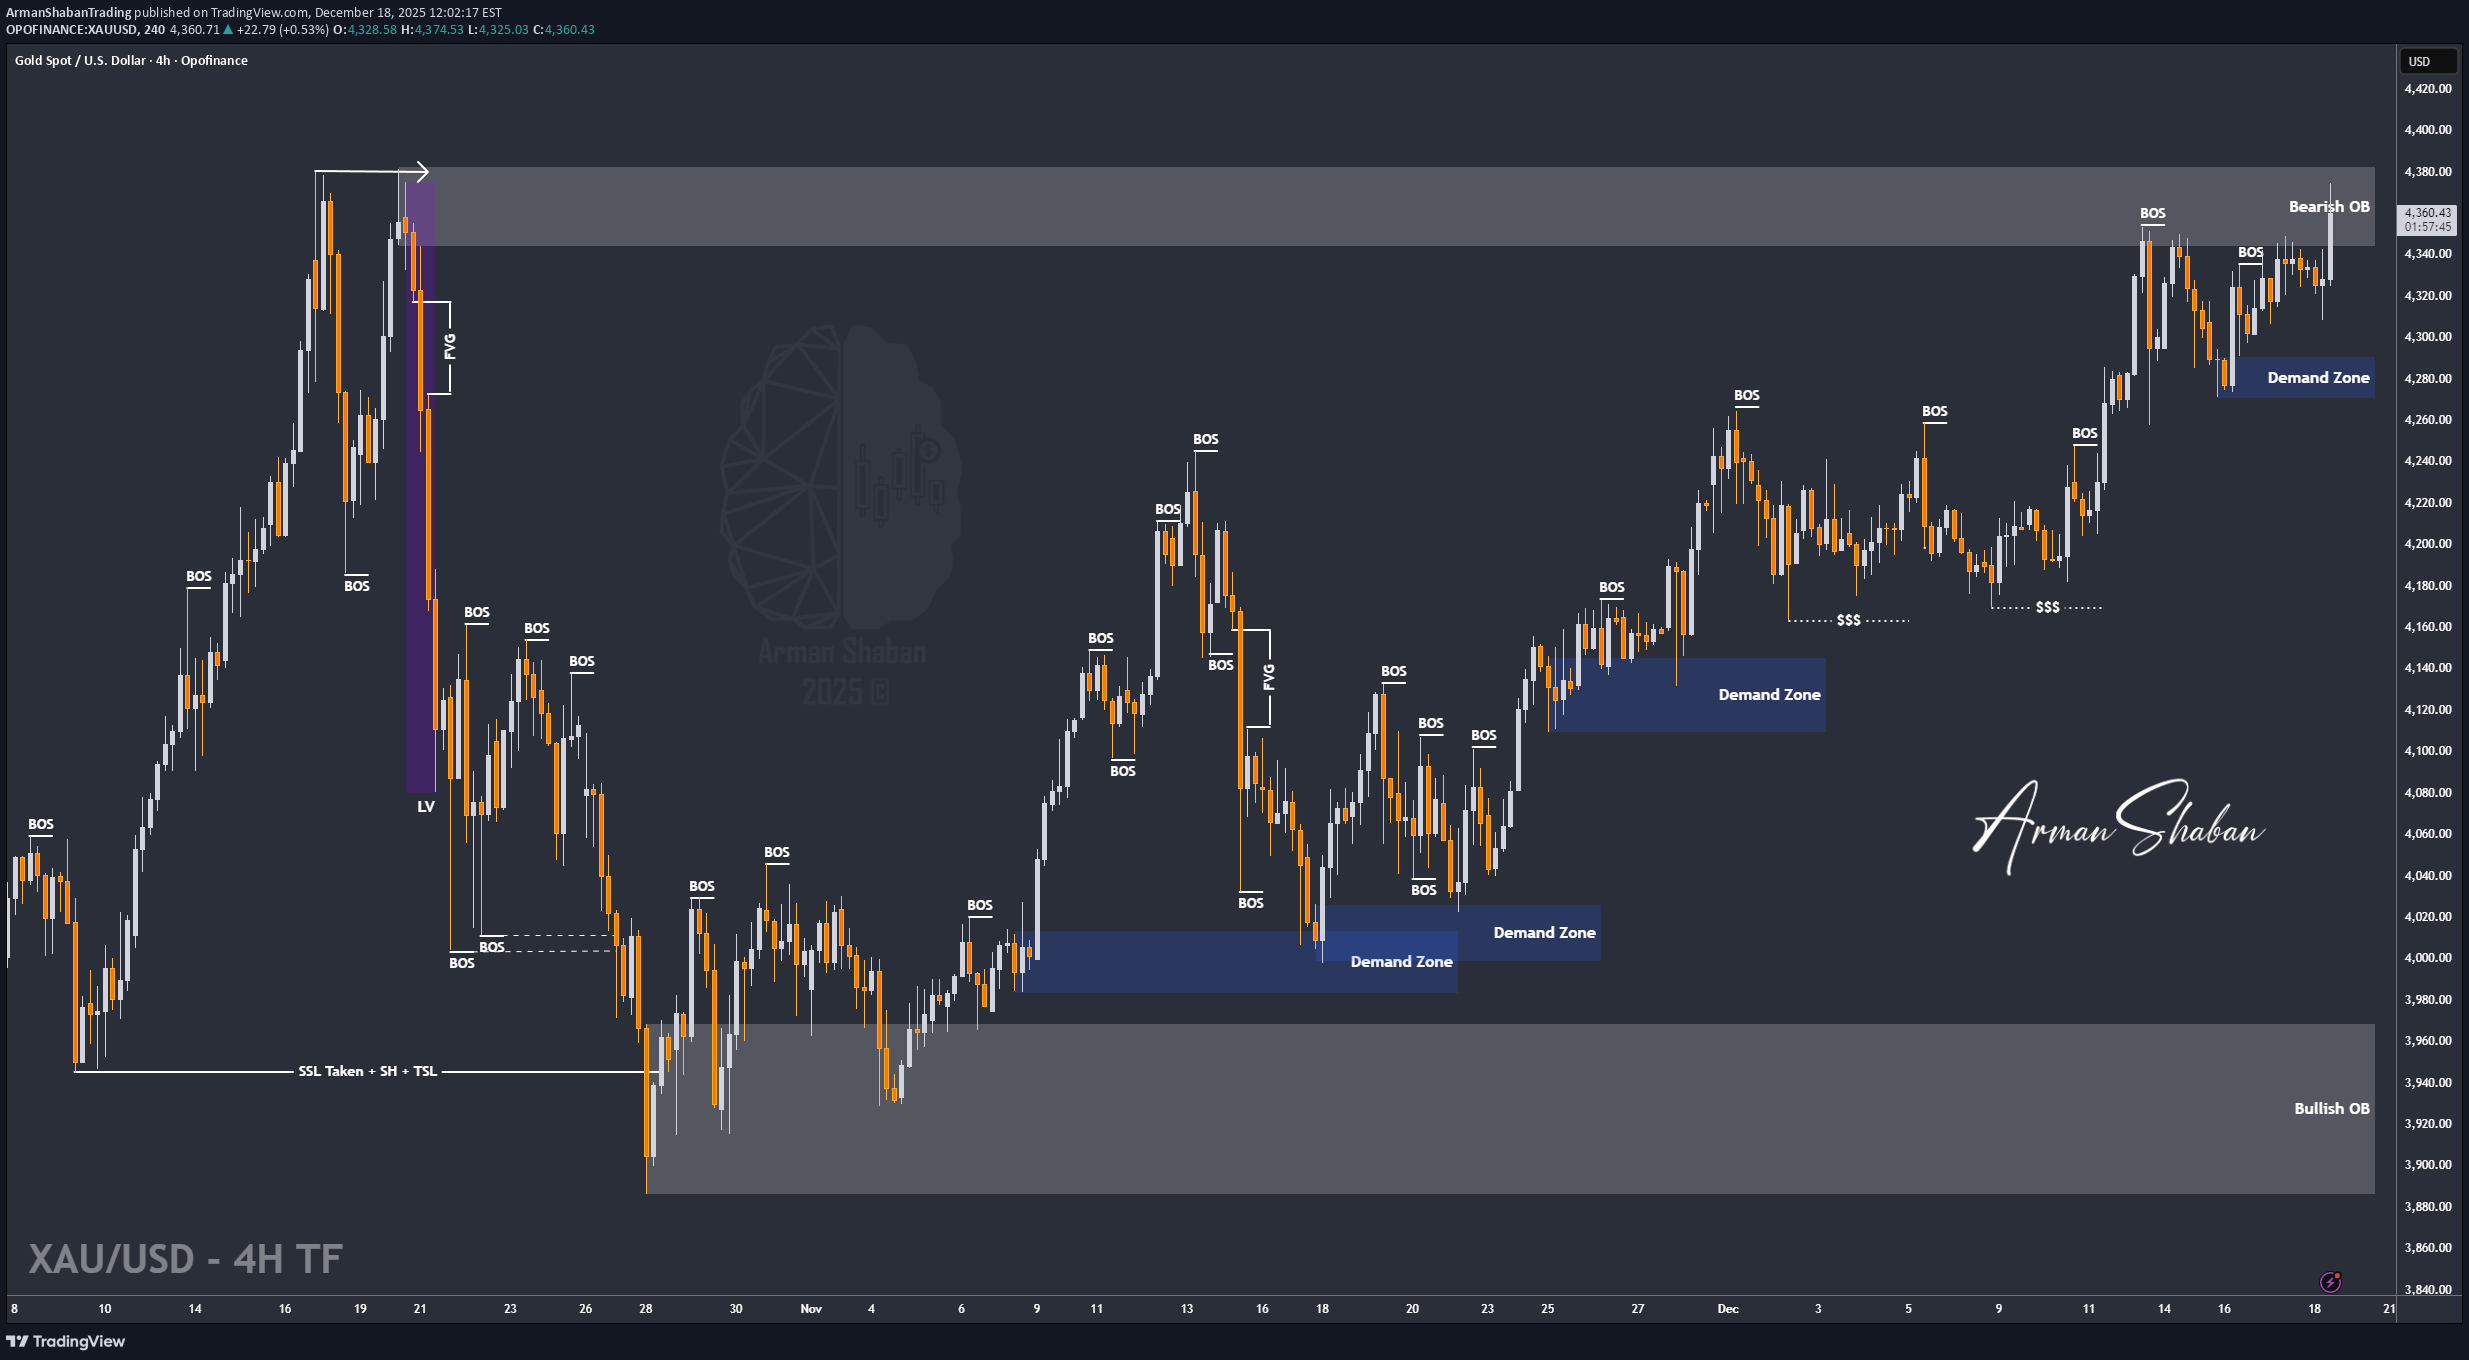
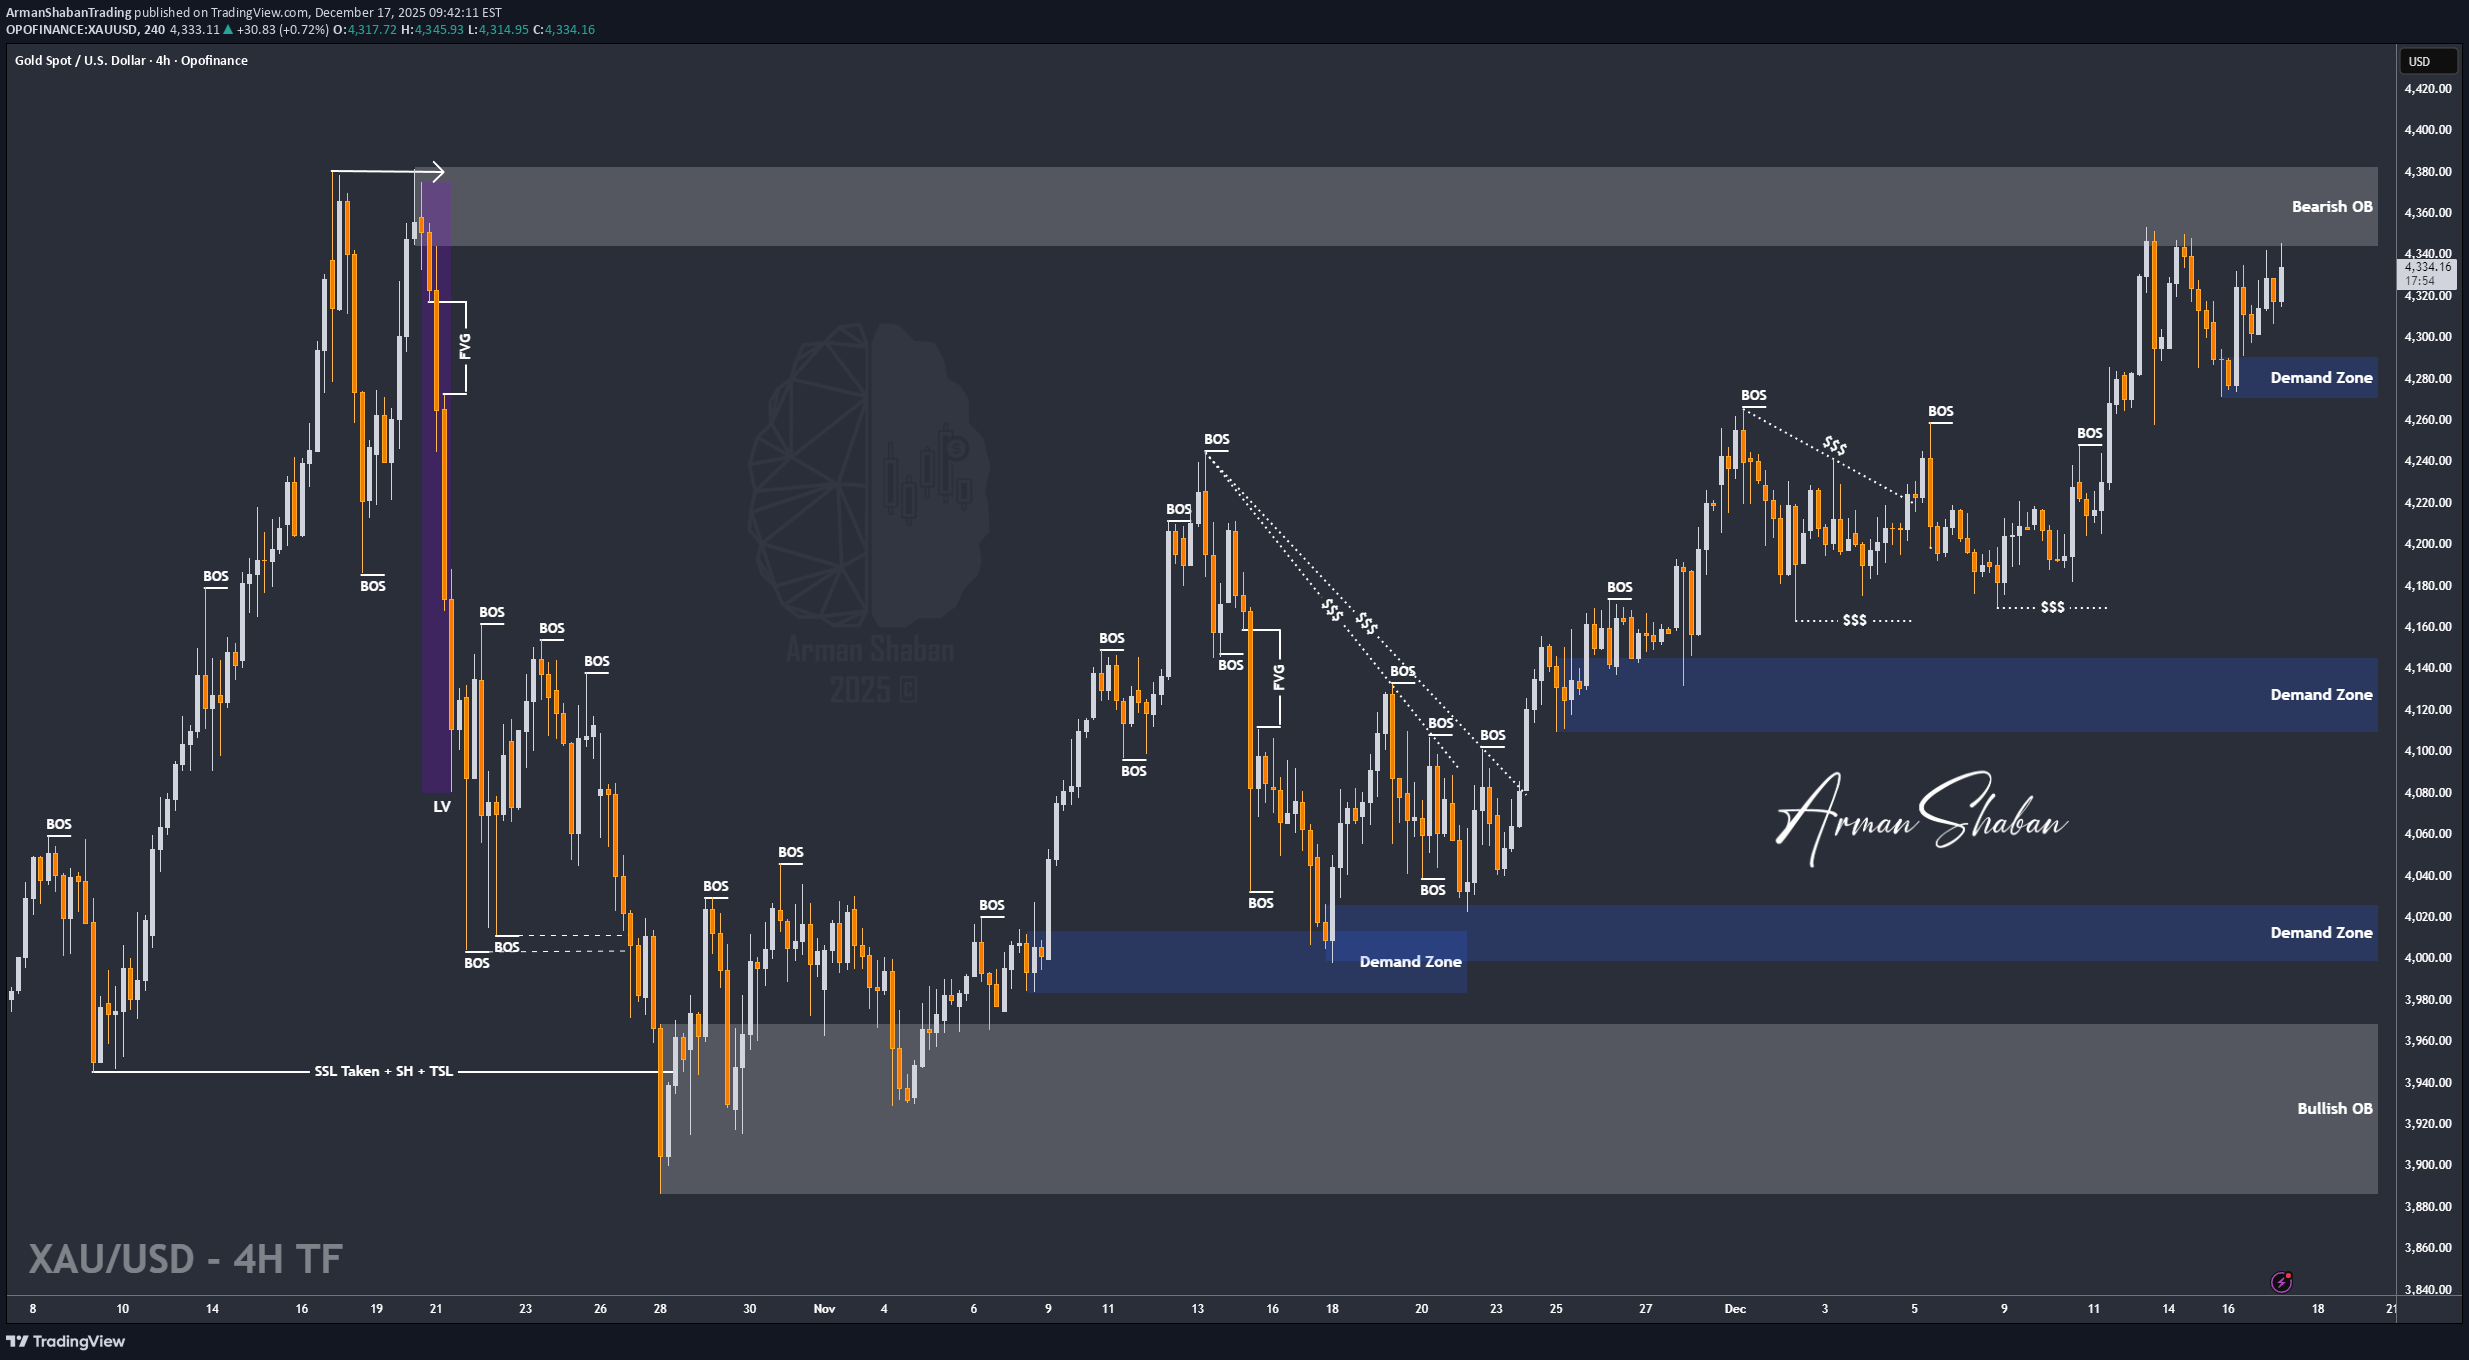
XAU/USD | Gold Sharp Sell-Off After ATH, Liquidity Void in Play!

By analyzing the #Gold chart on the 4H timeframe, we can see that after our last analysis, price rallied to $4550 and delivered over 700 more pips of profit. After that strong move, gold entered a very aggressive correction. In less than 16 hours, price dropped from $4550 to $4300, which means a $250 or 2500 pips heavy sell-off. Right now, gold is trading around $4329. This sharp drop has created a very large liquidity void, and I expect this gap to be filled in the short term with a bullish rebound. The expected short-term upside is around 300 to 800 pips, while the medium-term potential could reach 1500 to 2500 pips. The key medium-term demand zone to watch is $4210 to $4269.This analysis will be updated. Please support me with your likes and comments to motivate me to share more analysis with you and share your opinion about the possible trend of this chart with me ! Best Regards , Arman ShabanBy analyzing the #Gold chart on the 4H timeframe, we can see that right after our last analysis, selling pressure faded and price started to move higher, exactly as expected. Gold delivered over 1000 pips and hit its short-term target. After reaching $4404, price faced selling pressure again and is now trading around $4389. The main bias is still bullish, and I expect further upside overall. However, there are several important supply levels ahead, and each time price reaches these areas, a short-term pullback is likely. These zones can offer good SELL opportunities for day traders and scalpers. Key supply levels to watch are $4425, $4455, $4476, and $4497.
ArmanShabanTrading
TON/USDT | TON Holding Support, Watching for a Stronger Push!

By analyzing the #TON chart on the weekly timeframe, we can see that after dropping to $1.40, price attracted demand again and is now trading around $1.65. If TON Coin can hold and stabilize above $1.58, we can expect more upside in the short term. The bullish momentum is present but still weak, so we need to see stronger moves from TON. The next upside targets are $1.74, $2.00, and $2.22. Please support me with your likes and comments to motivate me to share more analysis with you and share your opinion about the possible trend of this chart with me ! Best Regards , Arman Shaban
ArmanShabanTrading
XAU/USD | Gold Breaks $4500 , Get Ready for $4600! (READ THE TA)

By analyzing the #Gold chart on the 4H timeframe, we can see that price moved exactly as expected. Gold pushed into the $4440 to $4444 zone, faced selling pressure there, but only corrected to $4412 before strong demand stepped in again. Yesterday, gold rallied sharply and printed a new ATH at $4497. After that move, price corrected again to $4430, but demand was so strong that the entire drop was recovered within four hours. Gold then broke above $4500 and is now trading around $4525, marking another new ATH. At the moment, I do not see a clear reason for a heavy correction. From a mid-term view, I consider $4330 as a key price floor. The main demand zones to watch are $4330 to $4350, $4406 to $4419, and $4484 to $4500. As long as gold holds above $4500, my short-term upside targets are $4550, $4575, and $4600. Please support me with your likes and comments to motivate me to share more analysis with you and share your opinion about the possible trend of this chart with me ! Best Regards , Arman ShabanBy analyzing the #Gold chart on the 4H timeframe, we can see that after rising to $4525, price corrected and dropped to $4471. After that drop, strong demand stepped in again and gold is now trading around $4488. If price can stabilize above $4479, I expect further upside in gold. Based on the main analysis, the next upside targets are $4499, $4525, $4550, and $4575. This analysis will be updated.
ArmanShabanTrading
ETH/USDT | Ethereum Weekly Update Key Demand Zone Still in Play

Ethereum rallied up to $3,450, but failed to hold and is now trading near $2,900. This correction could deepen, and I’m watching the $2,100–$2,700 demand zone closely. It remains one of the strongest institutional zones on the chart. If price returns there, a sharp bullish reaction is highly likely. Please support me with your likes and comments to motivate me to share more analysis with you and share your opinion about the possible trend of this chart with me ! Best Regards , Arman Shaban
ArmanShabanTrading
BTC/USDT | More Downside Ahead? Let's Discuss in the Comments!

Bitcoin climbed back to $90,500, tapped resistance, and is now trading around $87,800. This bounce looks more like a classic liquidity grab than a trend reversal. I’m still leaning bearish. As long as $90,000 doesn’t flip into solid support, we’re likely heading lower. My next downside targets: $85,000 → $82,700 → $80,500 Nothing’s changed, structure is still weak, and the pressure’s on the bulls. Please support me with your likes and comments to motivate me to share more analysis with you and share your opinion about the possible trend of this chart with me ! Best Regards , Arman ShabanBy analyzing the #BTC chart on the Daily timeframe, we can see that Bitcoin is still hovering around $87,600, and the previous analysis remains valid. The $89,000–$91,900 area continues to act as a strong supply zone, capping any upward attempts. As long as $90,000 doesn’t flip into support, the bias remains bearish and lower targets stay in focus.
ArmanShabanTrading
XAU/USD | Gold Near Previous ATH, Next Breakout in Focus!
By analyzing the #Gold chart on the 4 hour timeframe, we can see that price moved exactly as expected and continued higher. Gold successfully hit the $4351 and $4359 targets and even pushed up to $4375. Based on the main analysis, the next key target is a new all time high above $4382. Since gold has reached the very strong supply area around the previous ATH, the pullback we are seeing now is normal and has brought price back to around $4359. I expect a small correction first, followed by another bullish move and a fresh high. Targets above $4400 are clearly not out of reach. Please support me with your likes and comments to motivate me to share more analysis with you and share your opinion about the possible trend of this chart with me ! Best Regards , Arman Shaban The Related Analysis :
ArmanShabanTrading
XAU/USD | Get Ready for $4400 Target and Beyond! (READ)
By analyzing the #Gold chart on the 4 hour timeframe, we can see that price moved exactly as expected. Gold first made a small pullback and dropped to the $4290 demand zone. As soon as price reached this key area, strong buying pressure came in and gold successfully hit the first target at $4343. So far, this analysis has delivered more than 500 pips in profit. I expect gold to continue moving higher. Even though price is currently inside a supply zone, the strong momentum suggests a possible breakout. The next upside targets are $4351, $4359, and $4382. the last TA on GOLD : Please support me with your likes and comments to motivate me to share more analysis with you and share your opinion about the possible trend of this chart with me ! Best Regards , Arman Shaban
Disclaimer
Any content and materials included in Sahmeto's website and official communication channels are a compilation of personal opinions and analyses and are not binding. They do not constitute any recommendation for buying, selling, entering or exiting the stock market and cryptocurrency market. Also, all news and analyses included in the website and channels are merely republished information from official and unofficial domestic and foreign sources, and it is obvious that users of the said content are responsible for following up and ensuring the authenticity and accuracy of the materials. Therefore, while disclaiming responsibility, it is declared that the responsibility for any decision-making, action, and potential profit and loss in the capital market and cryptocurrency market lies with the trader.