Technical analysis by cryptodailyuk about Symbol BTC on 11/11/2025

cryptodailyuk
بیت کوین در دوراهی سرنوشت ساز: آیا کانال نزولی میشکند یا سقوط ادامه دارد؟
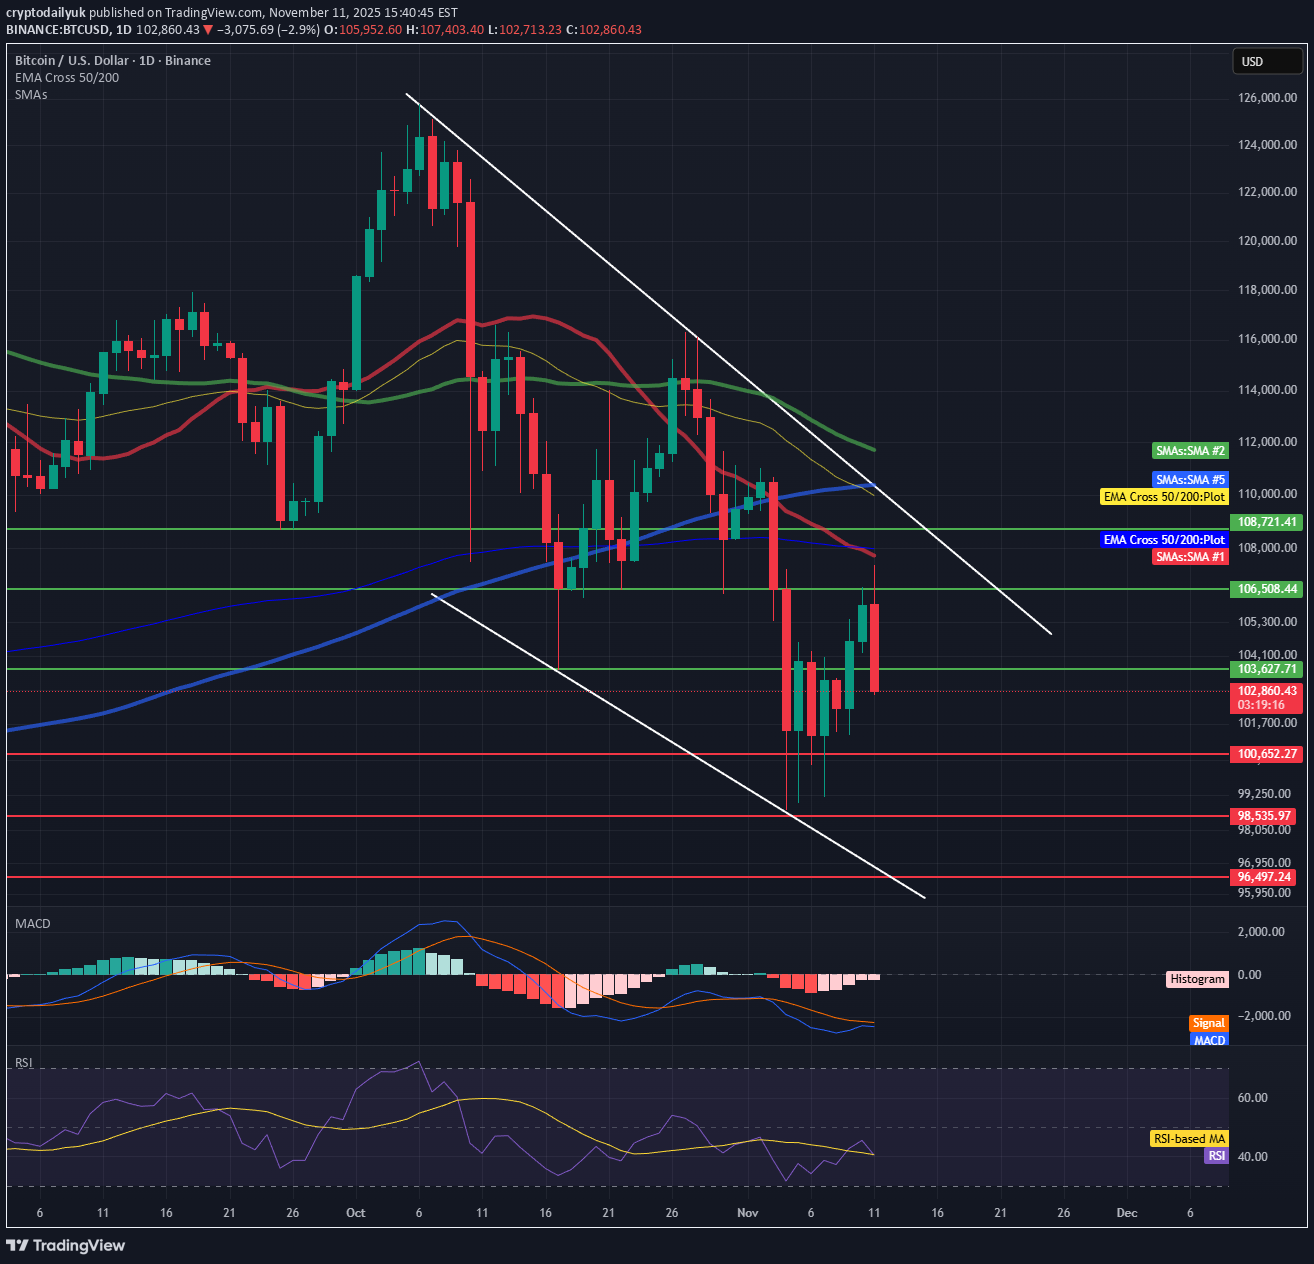
🧭 Overall Market Picture Bitcoin is in a medium-term downtrend, as confirmed by: a descending channel (marked with white lines), lower highs and lower lows, price below the key EMA and SMA. The price is currently testing the upper boundary of this channel, so it will be crucial whether it manages to break out of it to the upside or rebounds further down. 🔹 Key Price Levels Support: $100,650 — short-term support, previously seen price reactions. $98,550 — next demand level from late October. $96,950 — lower boundary of the descending channel, potential target for continued declines. Resistance: $106,300–$106,500 — current resistance (upper boundary of the channel + SMA100). $109,700–$110,000 — strong resistance converging with the EMA200 and SMA200. $112,000+ — channel breakout and trend change. 🔸 Technical Indicators 1. MACD The histogram is starting to turn positive (descending red). The MACD line is attempting to cross the signal from below — a potential bullish signal, but not yet confirmed. ➡️ Indicates a possible short-term upward correction within a downtrend. 2. RSI (14) Value: ~40.5 — low, but has rebounded from oversold levels. No bullish divergence, but the RSI is rising from below, suggesting a potential technical bounce. ➡️ Still more upside than downside before entering the overbought zone. 🔹 Moving Averages EMA50 (~109,970 USD) and EMA200 (~110,380 USD) are above the price, confirming the downtrend. The EMA50 < EMA200 cross holds – a classic death cross. SMA100 (~106,300 USD) has just been tested – a key level that could determine the direction of the coming days. 🔸 Short-Term Scenarios 🟩 Bullish (30–40% chance) Breakthrough of the upper channel line (~106.5k USD) + daily close above 107k USD. Confirmation of the MACD and RSI signal > 50. Targets: 109,700 → 111,500 → 113,800 USD. ➡️ A medium-term trend reversal is then possible. 🟥 Bearish (60–70% chance) Bounce from the upper channel line and fall below 102k–101k. Continuation of the downtrend. Targets: 100,600 → 98,500 → 96,900 USD. ➡️ In this scenario, the market will maintain a lower high/lower low structure. ⚙️ Summary Trend: Down, but with a short-term rebound attempt. Key moment: reaction to the 106k–107k USD level. If the channel with volume breaks, a bullish reversal. If a rebound, a new low around 97k–99k USD is very possible.