Technical analysis by Kriptovole about Symbol BTC: Buy recommendation (10 hour ago)

Kriptovole
بیت کوین در چنگال مثلث گسترده: مقصد بعدی ۸۰ هزار دلار یا انفجار بزرگ؟
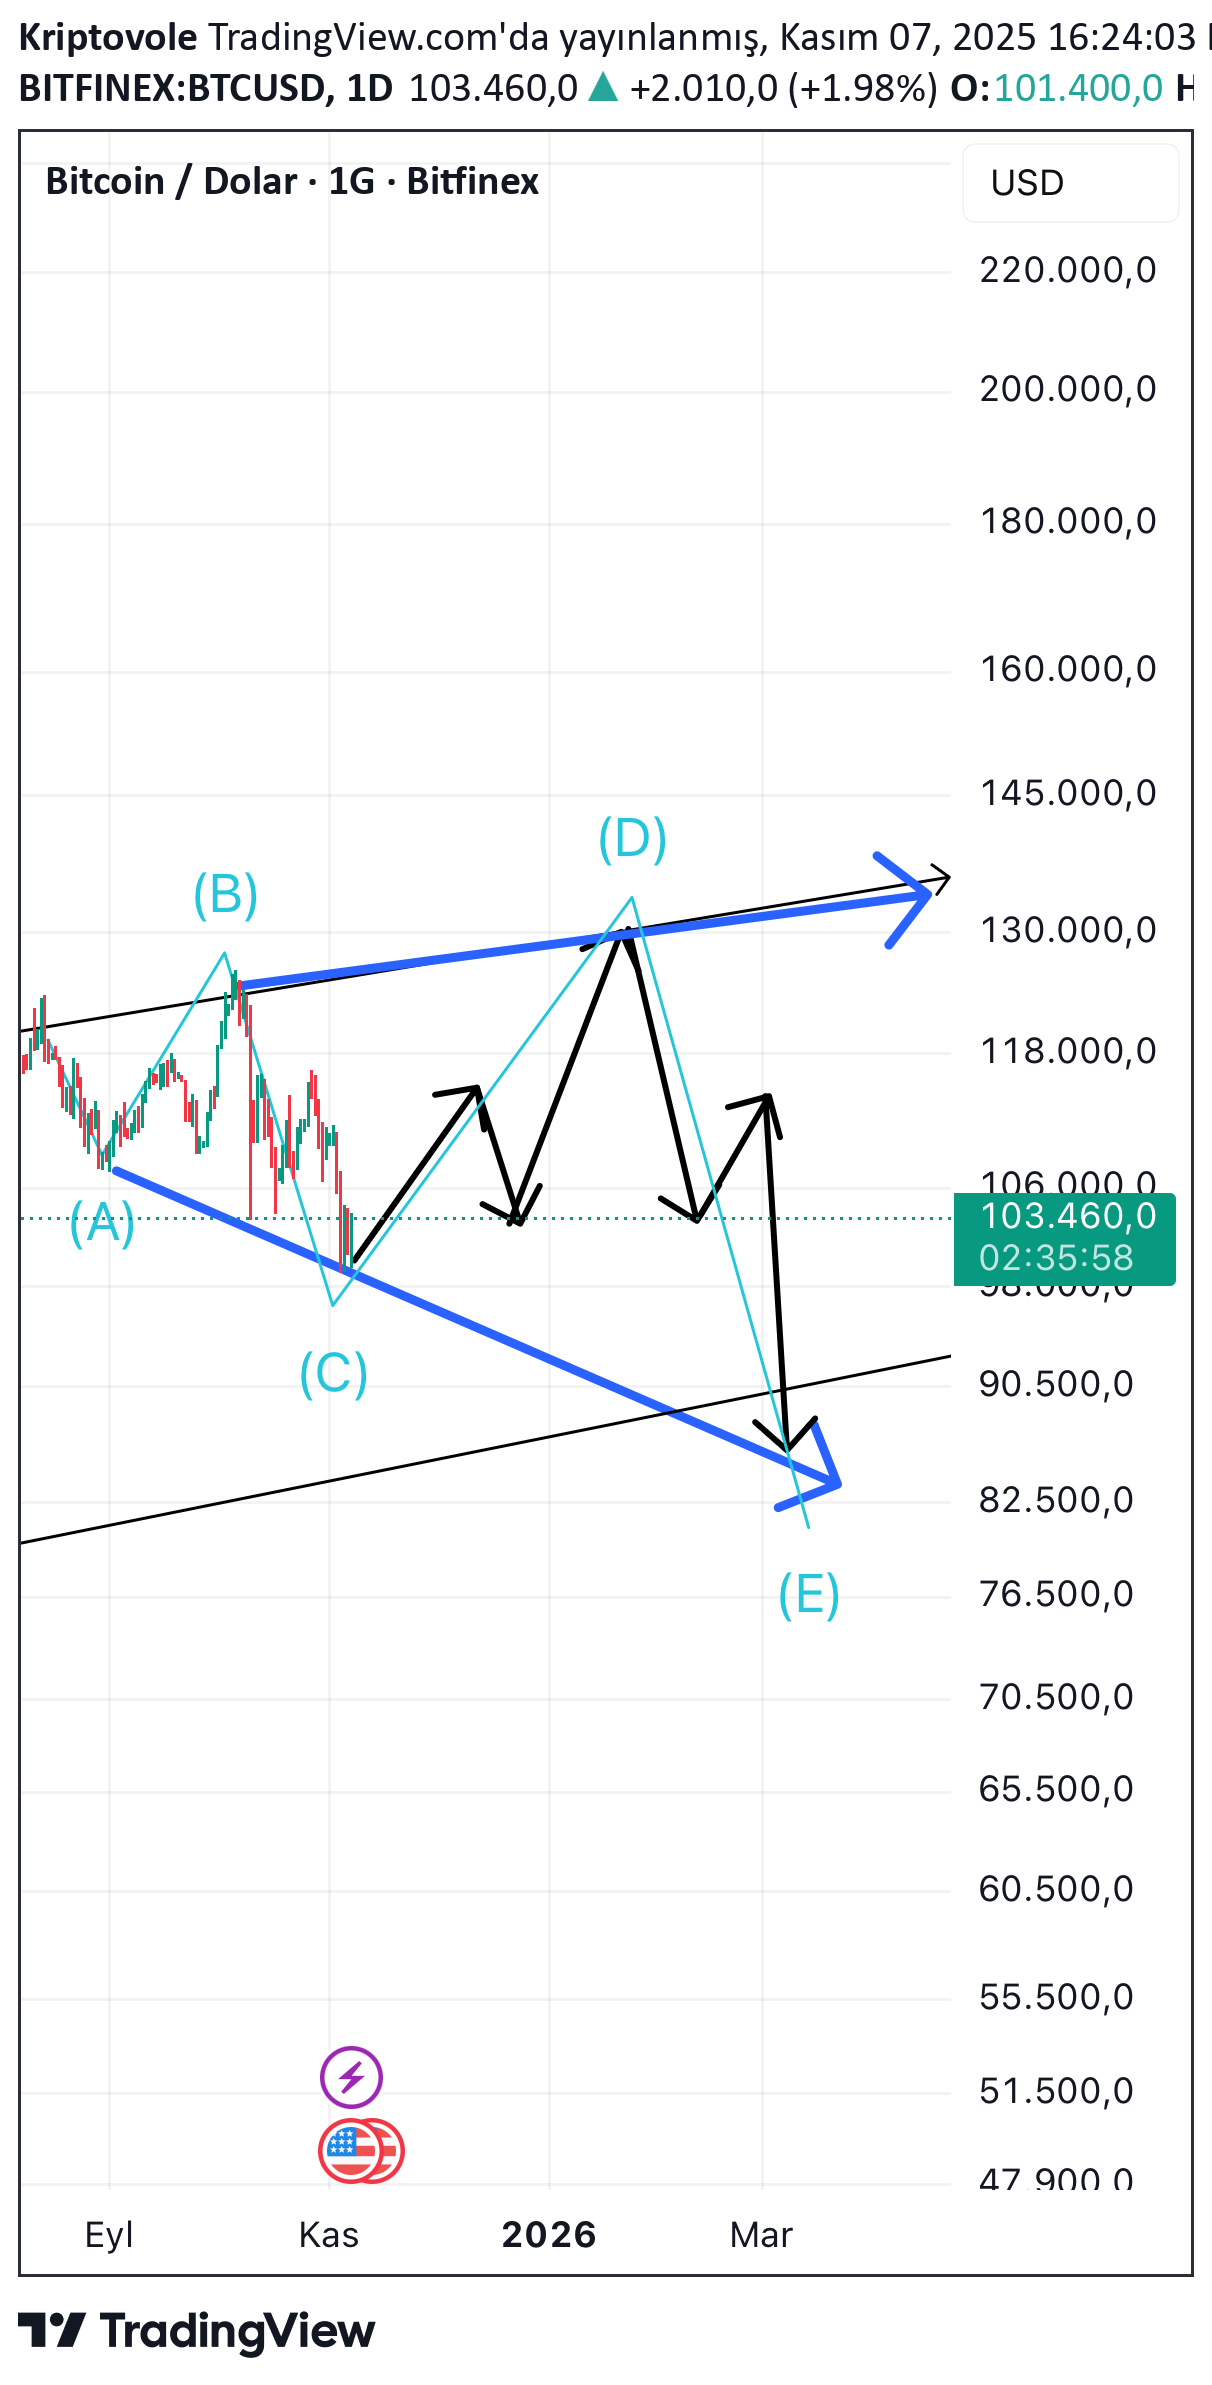
The chart shows that Bitcoin has formed an expanding triangle formation on the daily time frame. This structure usually develops in the form of waves (A)-(B)-(C)-(D)-(E) and causes the price to make widening oscillations with high volatility. 🔹 Current Situation The price is currently around USD 103,500 and it seems to be moving in the direction of wave (D) followed by wave (C). On the upside, a potential target is the upper trend line near USD 133,000, which is also the resistance for wave (D). 🔹 Possible Scenario •After the (D) wave is completed, the price can be expected to turn down again and create an (E) wave up to the 88,000 – 81,000 USD band. •This move may result in a strong trend break after testing the alt limit of the expanding triangle. •When the (E) wave is completed, the beginning of a new major trend is usually seen. 🔹 Technical Observations •The wave structure of the price is widening, which indicates that the market is in an unstable period and open to manipulation. •Decreasing-increasing imbalances on the volume side may be a signal to pay attention to as the formation approaches its end. •If divergences occur in indicators such as RSI or OBV, it produces a strong signal to confirm the break after the (E) wave. 🔹 Summary The (D) wave of the expanding triangle can be completed in the upward direction, then the 80-85 thousand band can be tested with a final retreat (E) wave. After this level, a sharp break in the direction of the long-term trend can be expected.