Technical analysis by Youriverse about Symbol BTC on 10/29/2025

Youriverse
بیت کوین در دام افتاد: شکار نقدینگی و سقوط احتمالی تا ۱۰۳ هزار دلار!
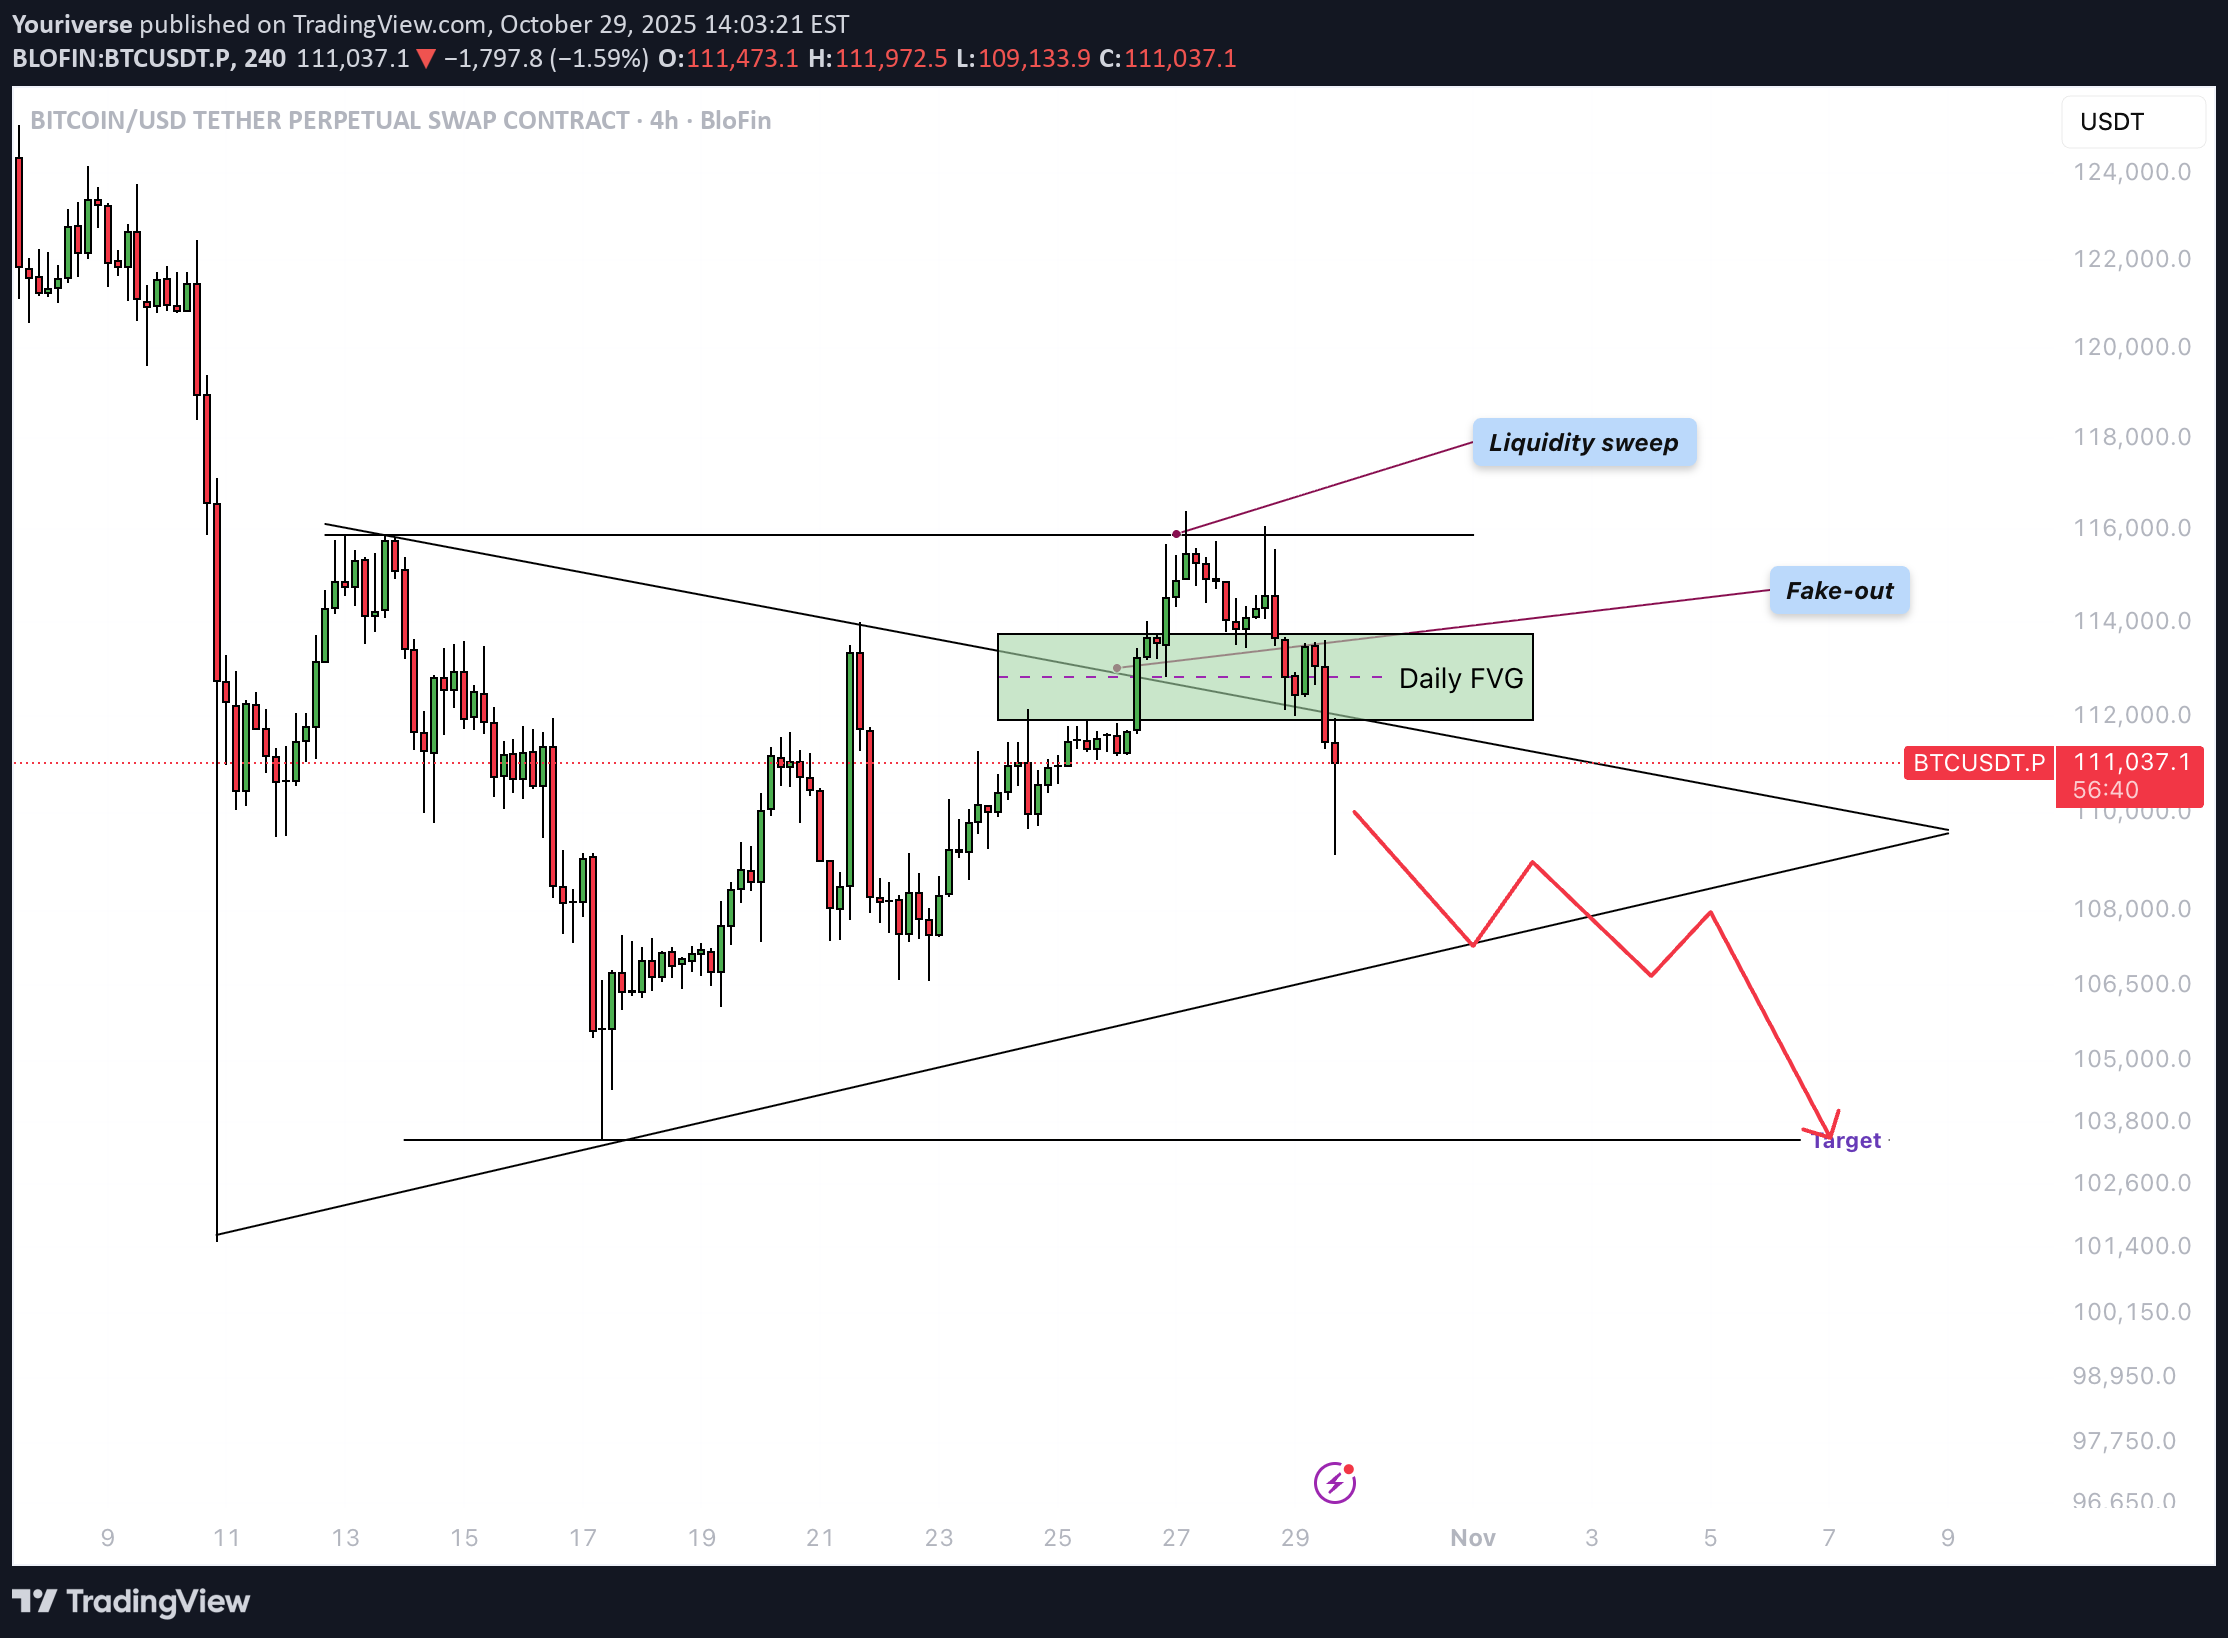
Bitcoin (BTC) is currently in a crucial phase within a broader consolidation structure. After a strong upward move, the price has encountered significant resistance and is showing signs of weakening buying pressure. On the daily chart, it is clear that the price has re-entered the triangle structure after a brief breakout above resistance. Liquidity Grab Around $116,000, a clear liquidity sweep can be observed. Above this level, many stop orders and short-position liquidity were clustered. After this liquidity was taken, the price reversed sharply downward — indicating that large market players likely used this move to take profits or open short positions. Fake-Out from the Triangle Pattern The breakout above the triangle structure turned out to be a fake-out. Instead of holding above the trendline for confirmation, the price quickly fell back within the formation. This indicates buyer weakness and strengthens the bearish scenario. A fake-out above a consolidation pattern often leads to a move in the opposite direction — toward the lower boundary of the structure. Daily FVG The current candle is positioned within an important daily Fair Value Gap (FVG). If the daily close remains as it is, this bullish FVG will convert into a bearish FVG, meaning the area will now act as resistance. This suggests that bears are taking control and further downward price action is likely. Target After an upward fake-out that collects liquidity, price often moves to the opposite side of the pattern. In this case, that would be the lower side of the triangle. A drop toward $103,000–$104,000 is therefore the most likely scenario. This zone aligns with previous structural support and can serve as a logical target area. Conclusion Bitcoin is showing clear signs of exhaustion near the top of the range. The liquidity grab and fake-out from the triangle reinforce the bearish outlook. With the daily FVG flipping bearish and bullish momentum fading, a move down toward the $103,000–$104,000 zone appears to be the most probable next step — unless BTC unexpectedly manages to close above the FVG. ------------------------- Thanks for your support. If you enjoyed this analysis, make sure to follow me so you don't miss the next one. And if you found it helpful, feel free to drop a like 👍 and leave a comment 💬, I’d love to hear your thoughts!The price of BTC has closed below the daily FVG. since then it has find its way down. lets see if we close around $104k soon.