Technical analysis by Trade_Hive_Signals about Symbol BTC: Buy recommendation (10/26/2025)

Trade_Hive_Signals
تحلیل بیت کوین (BTC/USD): آیا موج نهایی صعودی در راه است یا زنگ خطر اصلاح؟
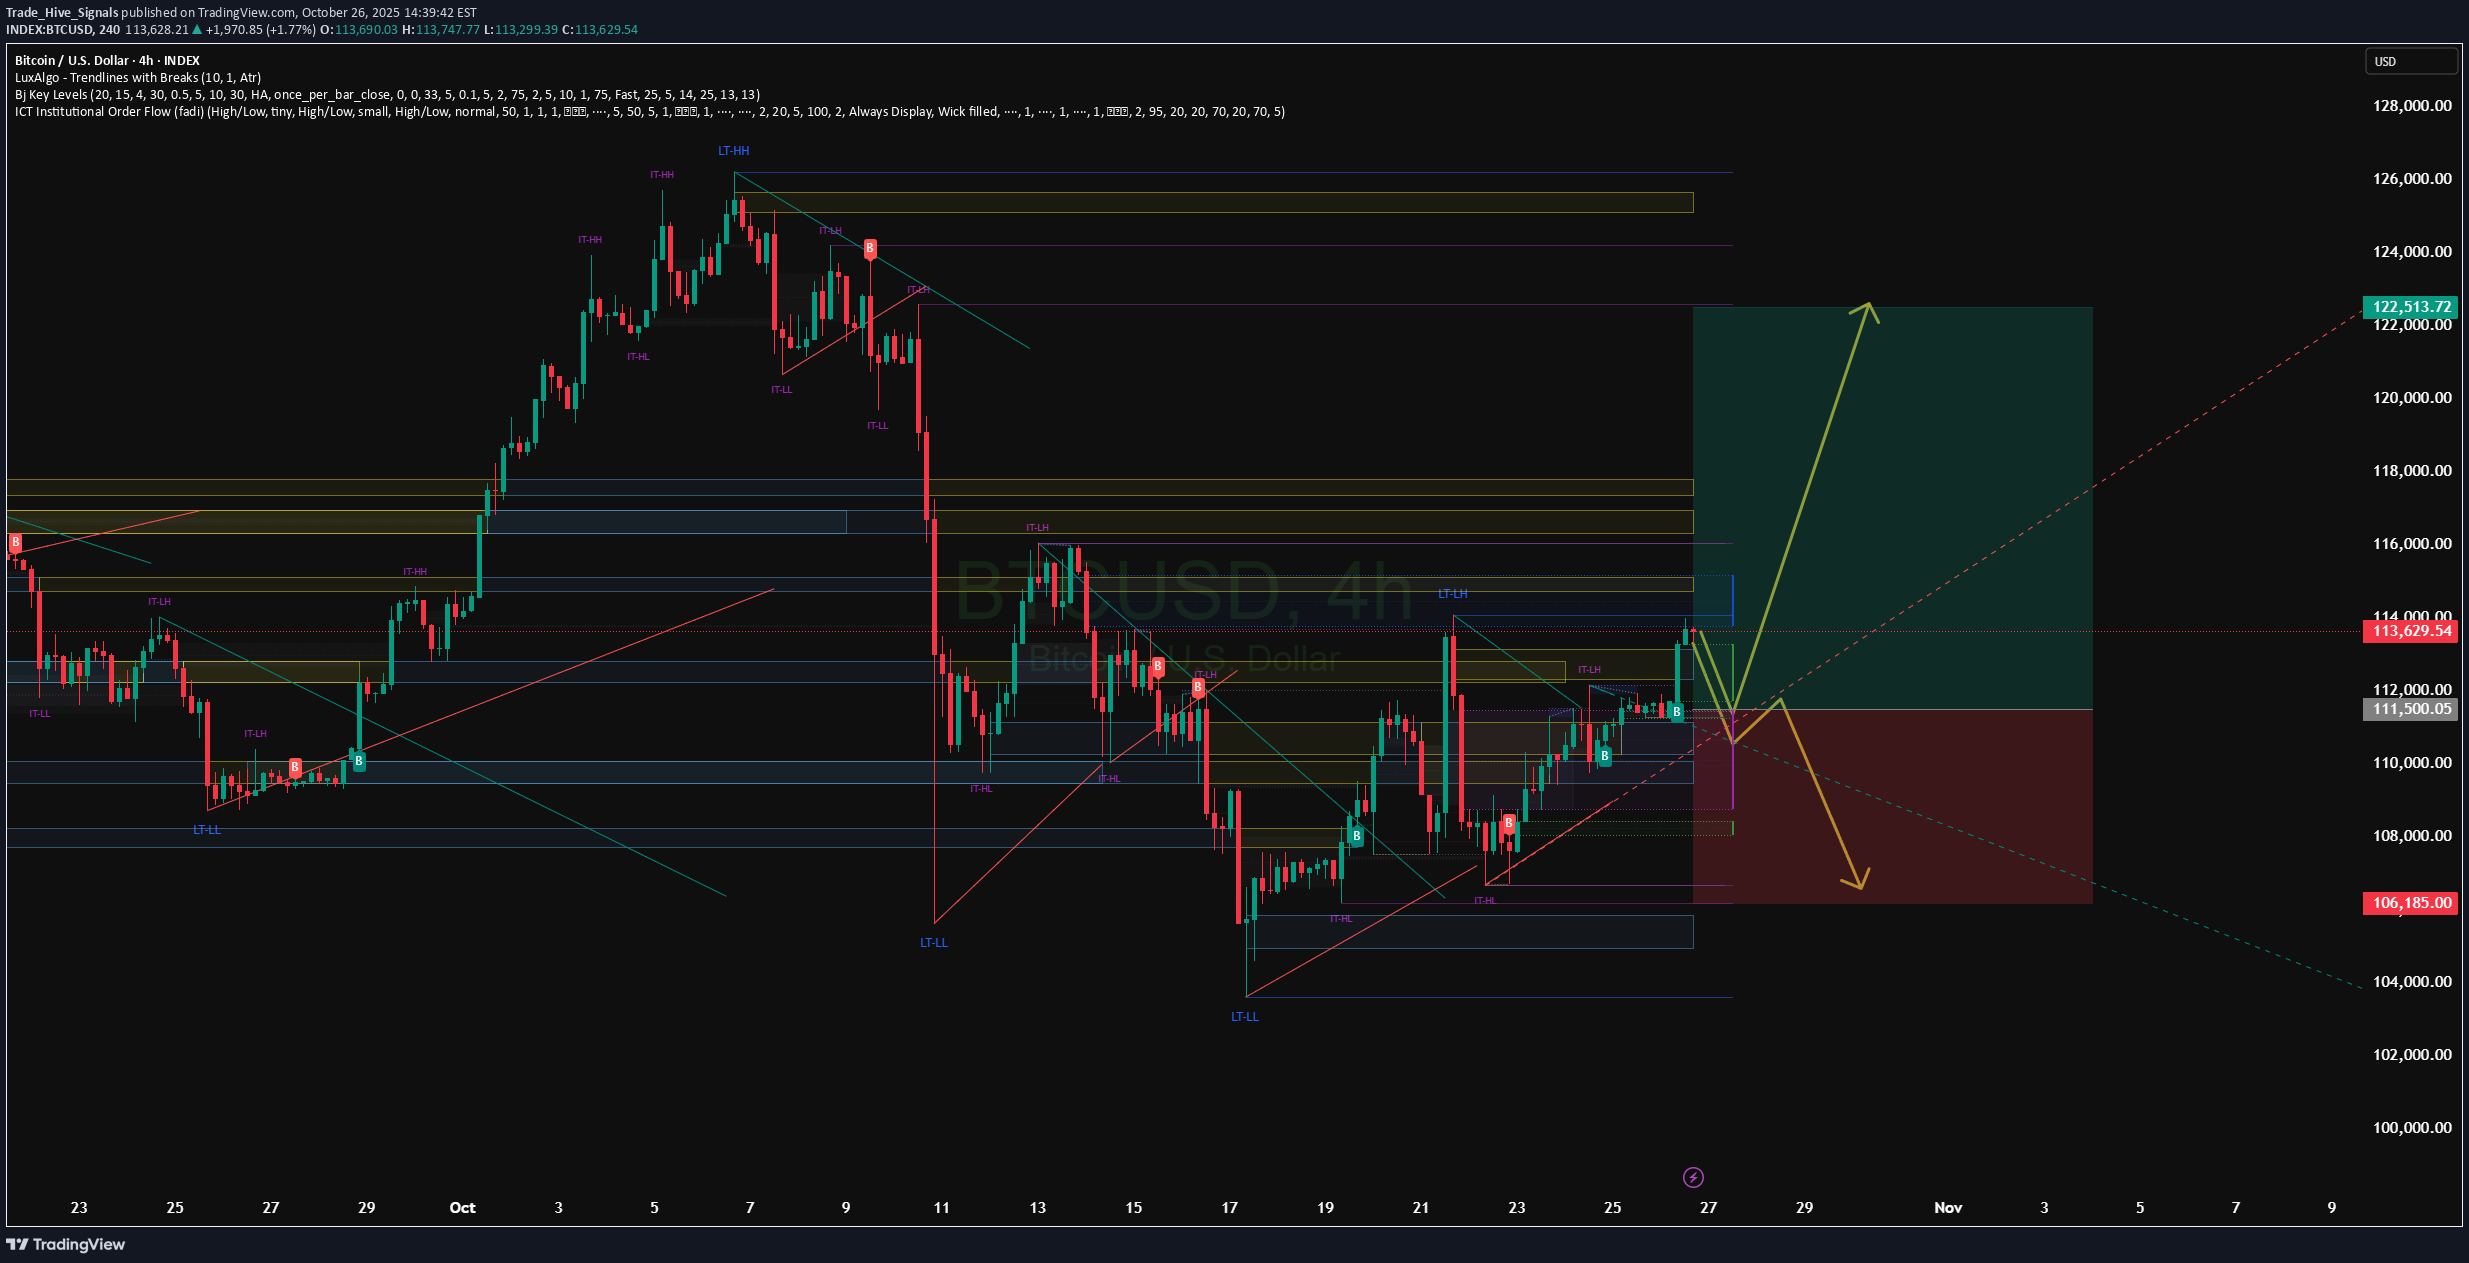
BTC/USD: Final wave before breakout or correction signal? 📊 Monthly Technical Analysis — Bitcoin (BTC/USD) Using support/resistance levels and wave analysis 🌀 Wave Context According to the Elliott Wave Principle model, Bitcoin may be either in the final impulse wave (5) or at the start of an A-B-C corrective structure. Wave (4) is expected to have ended near the $100,000-$110,000 zone. If wave (5) starts, it could signal a significant upward move. Otherwise, a breakout of support could signal a correction. 📈 Monthly Scenarios Bullish scenario: BTC holds above $110,000 → breakout to $120,000 → start of wave (5) → move to $135,000+. Consolidation: The price moves sideways between ~$110,000 and ~$120,000, accumulating strength before a new move. Bearish scenario: Breakout of support at ~$110,000 with volume → correction to ~$100,000 or lower. ✅Conclusion On the monthly timeframe, BTC/USD is at a crossroads: it is either entering a powerful uptrend or a significant correction is beginning. The ~$110,000 level is a key marker for the continuation of the bullish structure. A breakout above $120,000 is a signal for growth. A breakout below $110,000 is a signal for caution. Monitor price movement relative to these levels and confirmation of the wave structure before making trading decisions.