
Trade_Hive_Signals
@t_Trade_Hive_Signals

What symbols does the trader recommend buying?
Purchase History
پیام های تریدر
Filter
Trade_Hive_Signals
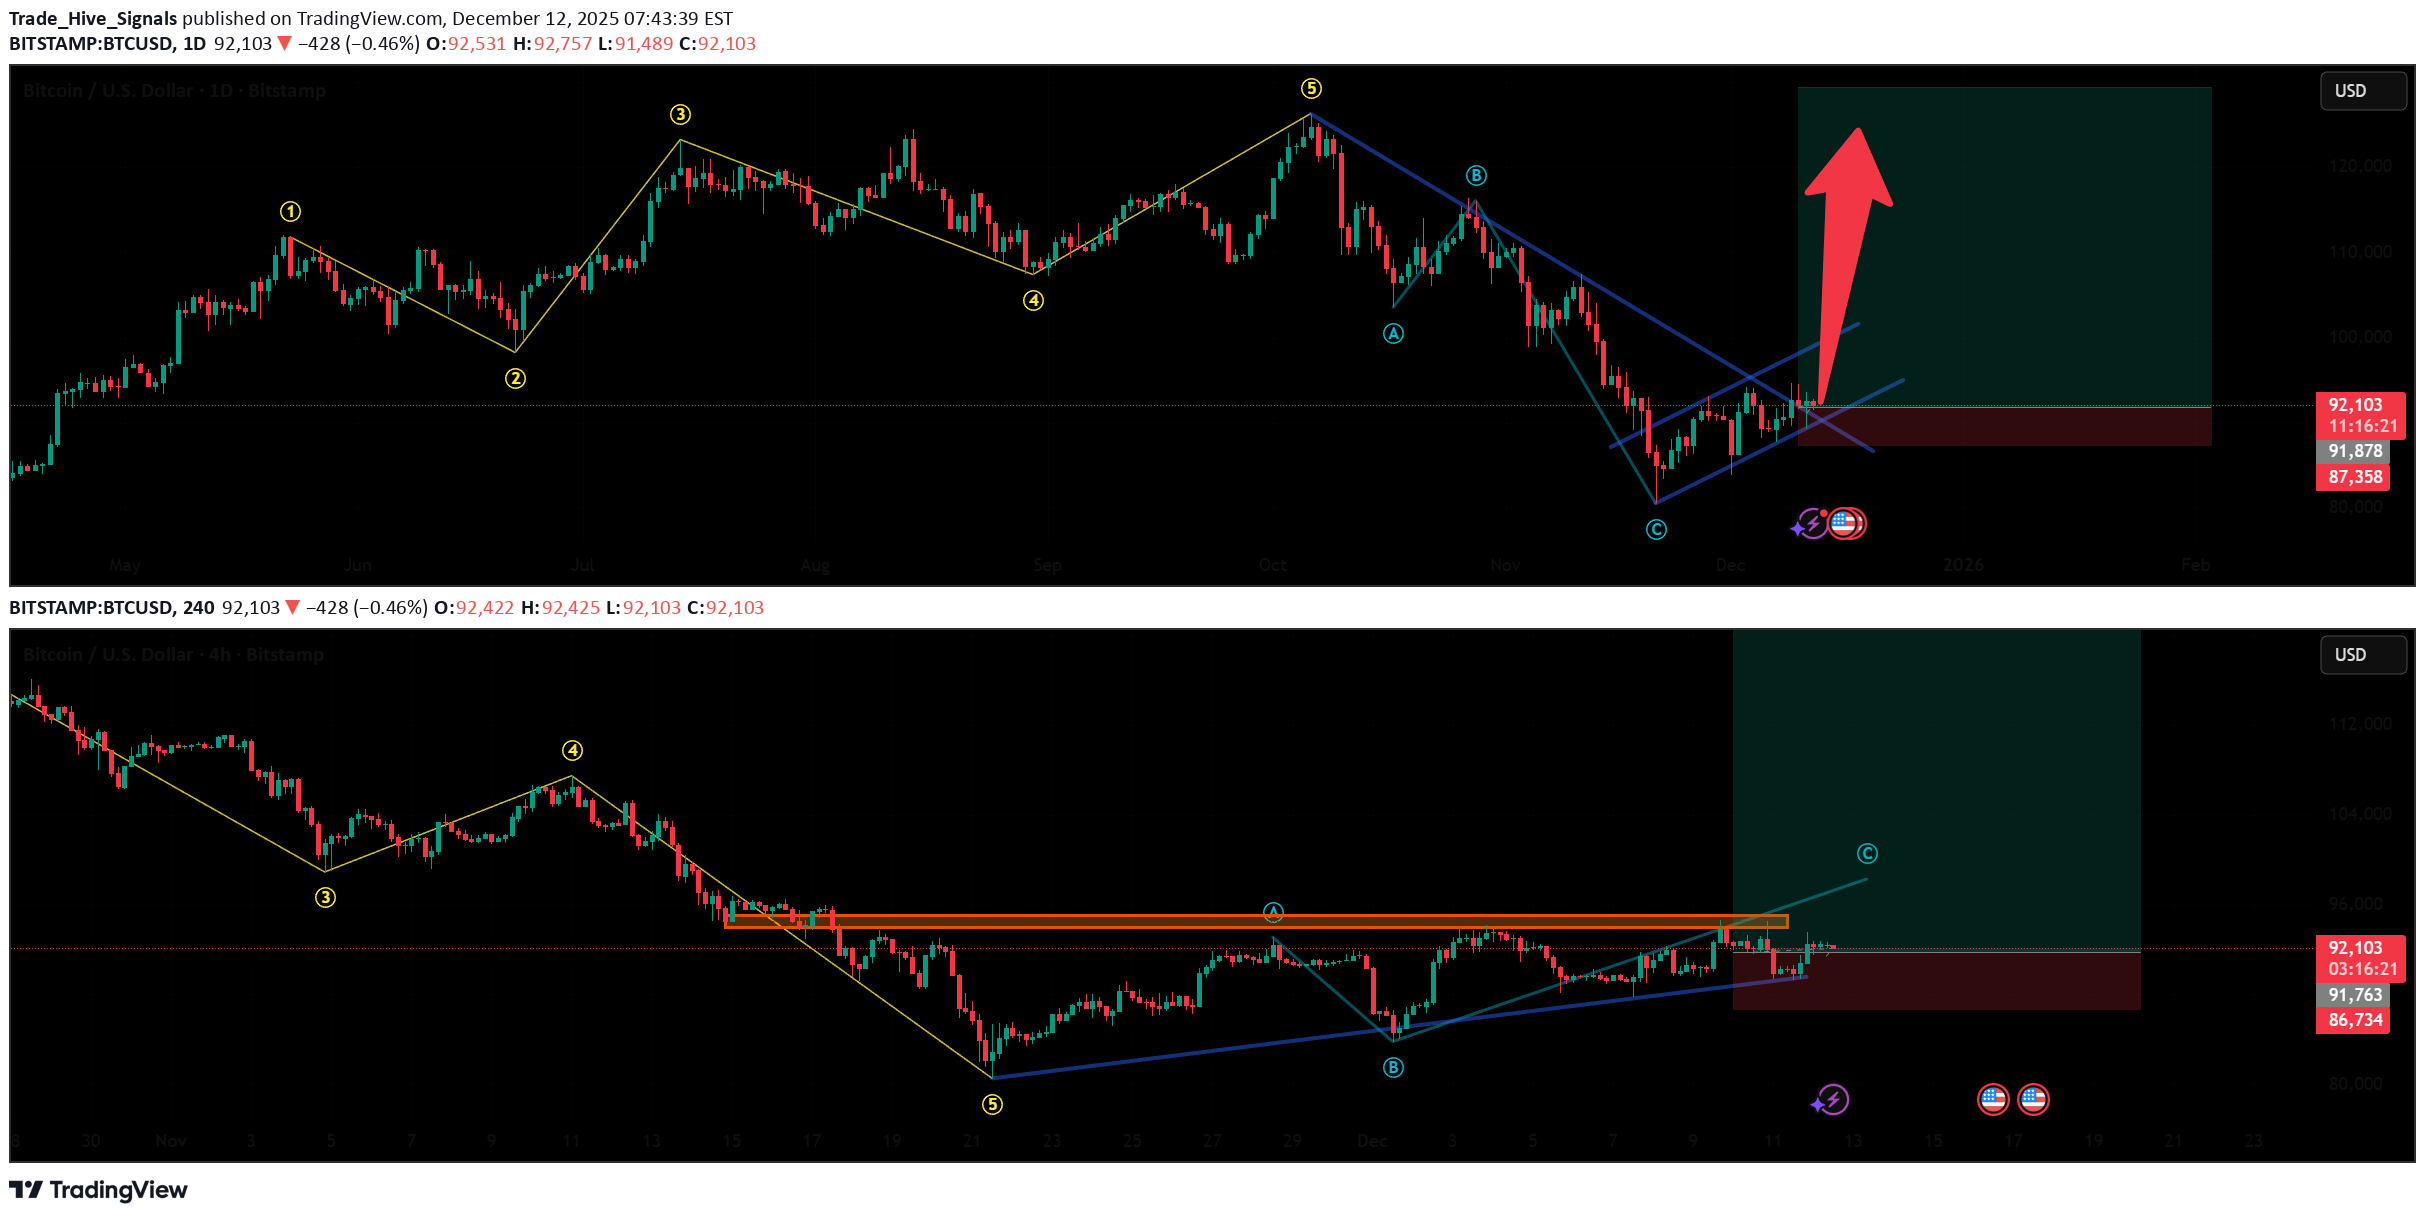
BTCUSD: Bitcoin's Wave Structure Is on the Verge of a New Impuls

BTCUSD: Bitcoin's Wave Structure Is on the Verge of a New Impulse BTCUSD Wave Overview (D1 and H4) As a trader who has been practicing wave analysis for over ten years, I note that the current Bitcoin picture shows the completion of an extended corrective formation and the potential for a new move. Chart D1: The global structure indicates that the market is gradually breaking out of its sideways range. The wave formation looks like the end of a correction, which is laying the foundation for the next impulse. Chart H4: Local dynamics confirm the first signs of an impulse. Key entry points are forming here, which could mark the beginning of a larger wave. Main Scenario After the completion of the corrective phase, a downward impulse sequence is expected to develop. This movement may be accompanied by increased seller activity and a shift in focus to the downside. Alternative Scenario If the price holds above local peaks and forms a stable upward impulse structure, the focus will shift to continued growth. In this case, the correction will be considered incomplete, and Bitcoin may experience a further rebound. Trading Idea Conservative approach: wait for confirmation of a breakout of key levels and enter with the trend. Aggressive approach: use local impulses on H4 for earlier entries, but with tight stops. In both cases, it is important to maintain strict risk management and adjust the plan as new impulses emerge. Results BTCUSD is at a crossroads between the end of the correction and the beginning of a new impulse. The wave structure on D1 and H4 provides clear guidelines for action: watch for confirmation of the scenario and act with discipline.
Trade_Hive_Signals
XAUUSD: Gold's Wave Structure on the Verge of a New Impulse

XAUUSD: Gold's Wave Structure on the Verge of a New Impulse XAUUSD Wave Review (D1 and H4) As a trader who has been practicing wave analysis for over ten years, I note that gold is currently completing a corrective phase and is preparing to transition into a new impulse movement. Chart D1: The global picture shows that the market is completing an extended sideways formation. The wave structure indicates that the correction is coming to an end and is laying the foundation for the next trend move. Chart H4: Local dynamics confirm the first signs of a nascent impulse. Key entry points are forming here, which could mark the beginning of a larger wave. Main Scenario After the completion of the corrective phase, a downward impulse sequence is expected to develop. This movement may be accompanied by increased seller activity and a shift in priority to the downside. Alternative Scenario If the price holds above local peaks and forms a stable upward impulse structure, the priority will shift to continued growth. In this case, the correction will be considered incomplete, and gold may experience a further rebound. Trading Idea Conservative approach: wait for confirmation of a breakout of key levels and enter with the trend. Aggressive approach: use local impulses on H4 for earlier entries, but with tight stops. In both cases, it is important to maintain strict risk management and adjust the plan as new impulses emerge. Conclusion Gold is at the transition point between a correction and a new impulse. The wave structure on D1 and H4 provides clear guidelines for action: watch for confirmation of the scenario and act with discipline.
Trade_Hive_Signals
XAUUSD: Gold's Wave Symphony Awaits Impulse

XAUUSD: Gold's Wave Symphony Awaits Impulse XAUUSD Wave Overview (D1 and H4) As a trader who has been practicing wave analysis for over ten years, I note that gold is currently forming an interesting structure, where the global picture and local movements are beginning to coalesce into a single scenario. Chart D1: Global dynamics indicate the completion of an extended corrective formation. The market is gradually breaking out of the sideways range, laying the foundation for the next trend movement. The wave structure appears to be the end of a correction and preparation for an impulse. Chart H4: Local dynamics confirm the formation of key entry points. Here, the first signs of an impulse are visible, which could be the beginning of a larger wave. The internal structure indicates that the market is preparing for a phase change. Main Scenario After the completion of the corrective phase, a downward impulse sequence is expected to develop. This movement may be accompanied by increased seller activity and a shift in priority to the downside. Alternative Scenario If the price holds above local peaks and forms a stable upward impulse structure, the priority will shift to continued growth. In this case, the correction will be considered incomplete, and gold may stage an additional rebound. Trading Idea Conservative approach: wait for confirmation of a breakout of key levels and enter with the trend. Aggressive approach: use local impulses on H4 for earlier entries, but with tight stops. In both cases, it is important to maintain strict risk management and adjust the plan as new impulses emerge. Conclusion Gold is at the transition point between a correction and a new impulse. The wave structure on D1 and H4 provides clear guidelines for trading: watch for confirmation of the scenario and act with discipline.
Trade_Hive_Signals
TONUSD: Wave Structure in Search of Growth Impulse

TONUSD: Wave Structure in Search of Growth Impulse TONUSD Wave Overview (D1 and H4) As a trader who has been practicing wave analysis for over ten years, I note that the current picture for TONUSD shows the end of an extended corrective phase and the potential for a new movement. D1 Chart: The global structure indicates that the market is gradually breaking out of its sideways range. The wave formation looks like the end of a correction, laying the foundation for the next impulse. H4 Chart: Local dynamics confirm the first signs of an impulse. Key entry points are forming here, which could mark the beginning of a larger wave. Main Scenario After the completion of the corrective phase, a downward impulse sequence is expected to develop. This movement may be accompanied by increased seller activity and a shift in focus to the downside. Alternative Scenario If the price holds above local peaks and forms a stable upward impulse structure, the focus will shift to continued growth. In this case, the correction will be considered incomplete, and TONUSD may experience an additional rebound. Trading Idea Conservative approach: wait for confirmation of a breakout of key levels and enter with the trend. Aggressive approach: use local impulses on H4 for earlier entries, but with tight stops. In both cases, it is important to maintain strict risk management and adjust the plan as new impulses emerge. Results TONUSD is at a crossroads between the end of the correction and the beginning of a new impulse. The wave structure on D1 and H4 provides clear guidelines for action: watch for confirmation of the scenario and act with discipline.
Trade_Hive_Signals
SOLANA: Wave energy on the brink of a new movement

SOLANA: Wave energy on the brink of a new movement SOLANA Wave Overview (D1 and H4) As a trader who has been practicing wave analysis for over ten years, I note that the current Solana structure demonstrates the completion of an extended corrective formation and the potential for a new impulse to emerge. Chart D1: The global picture indicates that the market is completing a sideways phase. The wave structure appears to be the end of a corrective sequence, which serves as the foundation for the next trend move. Chart H4: Local dynamics confirm the formation of key entry points. Here, the first signs of an emerging impulse are visible, which could mark the beginning of a larger wave. Main Scenario After the completion of the corrective phase, a descending impulse sequence is expected to develop. This movement will be accompanied by increased seller activity and a gradual shift in priority to the downside. Alternative Scenario If the price holds above recent highs and forms a stable upward impulse structure, the priority will shift to continued growth. In this case, the correction will be considered incomplete, and Solana may show an additional rebound. Trading Idea Conservative approach: wait for confirmation of a breakout of key levels and enter with the trend. Aggressive approach: use local impulses on H4 for earlier entries, but with tight stops. In both cases, it is important to maintain strict risk management and adjust the plan as new impulses emerge. Results Solana is at the transition point between a correction and a new impulse. The wave structure on D1 and H4 provides clear guidelines for action: watch for confirmation of the scenario and act with discipline.
Trade_Hive_Signals
تحلیل موج طلا (XAUUSD): آیا گام هیجانی جدید آغاز میشود؟

XAUUSD: Gold's Wave Symphony on the Verge of a New Impulse XAUUSD Wave Overview (D1 and H4) As a trader who has been practicing wave analysis for over ten years, I note that the current gold structure demonstrates the completion of a major corrective formation and the potential for a new impulse. Chart D1: The global picture indicates that the market has completed an extended correction and is preparing to enter an impulse phase. The movement looks like the end of a sideways wave, which serves as the foundation for the next trend move. Chart H4: Local dynamics confirm the formation of key entry points. Here, we see the emergence of an impulse structure that could mark the beginning of a larger wave. Main Scenario After the completion of the corrective phase, a downward impulse sequence is expected to develop. This movement will be accompanied by increased seller activity and a gradual shift in priority to the downside. Alternative Scenario If the price consolidates above recent highs and forms a stable upward impulse structure, the priority will shift to continued growth. In this case, the correction will be considered incomplete, and gold may experience a further rebound. Trading Idea Conservative approach: wait for confirmation of a breakout of key levels and enter with the trend. Aggressive approach: use local impulses on H4 for earlier entries, but with tight stops. In both cases, it is important to maintain strict risk management and adjust the plan as new impulses emerge. Conclusion Gold is at the transition point between a correction and a new impulse. The wave structure on D1 and H4 provides clear guidelines for action: watch for confirmation of the scenario and act with discipline.
Trade_Hive_Signals
Gold: a strengthening impulse in action

Gold continues to hold within the framework of a short-term uptrend. After a correction, prices have returned to growth and are striving to consolidate above local highs. The wave structure indicates the sequential development of upward impulses, where pullbacks appear more like temporary pauses than full-fledged reversals. The chart shows that the price remains above key support zones, while buyers are gradually increasing pressure. Fundamentally, gold is supported by expectations of dovish Federal Reserve policy and demand for safe-haven assets amid global uncertainty. The decline in U.S. bond yields also enhances the attractiveness of XAUUSD. As a result, the market is showing signs of forming a new upward wave, where the next stage will depend on buyers’ ability to maintain initiative and consolidate above current levels.
Trade_Hive_Signals
BTCUSD: The Energy of an Upward Wave

In recent days, BTCUSD has shown a series of mixed movements, but the overall picture is gradually leaning toward growth. The wave structure suggests that the market is accumulating energy through short corrective pauses, creating a foundation for the continuation of the bullish impulse. The chart shows that the price is holding in the upper part of the range, while downward fluctuations appear more like temporary pauses than full-fledged reversals. This reflects the resilience of buyer interest and the gradual strengthening of sentiment. As a result, BTCUSD retains the potential to develop an upward wave, where further movement will depend on the market’s ability to confirm the strength of the current impulse and consolidate above local zones.
Trade_Hive_Signals
Bitcoin: Steps to Growth
In recent days, Bitcoin has been shaping a picture of gradual ascent after a period of uncertainty. The movement consists of alternating short impulses and pauses, creating the impression of energy accumulation for further development. The chart shows that the market is holding the price in the upper part of the range, while downward fluctuations lack sufficient strength to change the overall direction. This configuration indicates that buyers maintain the initiative, even if growth is unfolding step by step. As a result, Bitcoin is showing signs of forming an upward wave, where further movement will depend on the market’s ability to consolidate above current levels and confirm the strength of the impulse.
Trade_Hive_Signals
بیت کوین در آستانه انفجار قیمتی؟ چرا تثبیت کنونی مهمترین نقطه شروع است!
Bitcoin (BTCUSD) is gradually showing signs of revival after a period of consolidation. The upward movement is becoming more pronounced, while pullbacks remain moderate, reflecting buyer interest and the market’s readiness to develop a new wave. The chart reveals a sequence of advances that form the foundation for trend continuation. The structure indicates energy accumulation and a gradual strengthening of the bullish impulse. Fundamental factors also support the asset: interest in cryptocurrencies remains, and expectations of further adoption of digital solutions reinforce buyer positions. As a result, BTCUSD is in the zone of forming a new scenario, where the next breakout of key levels will be the decisive moment for the direction of further movement.
Disclaimer
Any content and materials included in Sahmeto's website and official communication channels are a compilation of personal opinions and analyses and are not binding. They do not constitute any recommendation for buying, selling, entering or exiting the stock market and cryptocurrency market. Also, all news and analyses included in the website and channels are merely republished information from official and unofficial domestic and foreign sources, and it is obvious that users of the said content are responsible for following up and ensuring the authenticity and accuracy of the materials. Therefore, while disclaiming responsibility, it is declared that the responsibility for any decision-making, action, and potential profit and loss in the capital market and cryptocurrency market lies with the trader.