Technical analysis by pejman_zwin about Symbol BTC: Sell recommendation (10/23/2025)

pejman_zwin
آیا بیت کوین سقوط میکند؟ نقشه راه BTC و منطقه حمایتی حساس پیش رو!
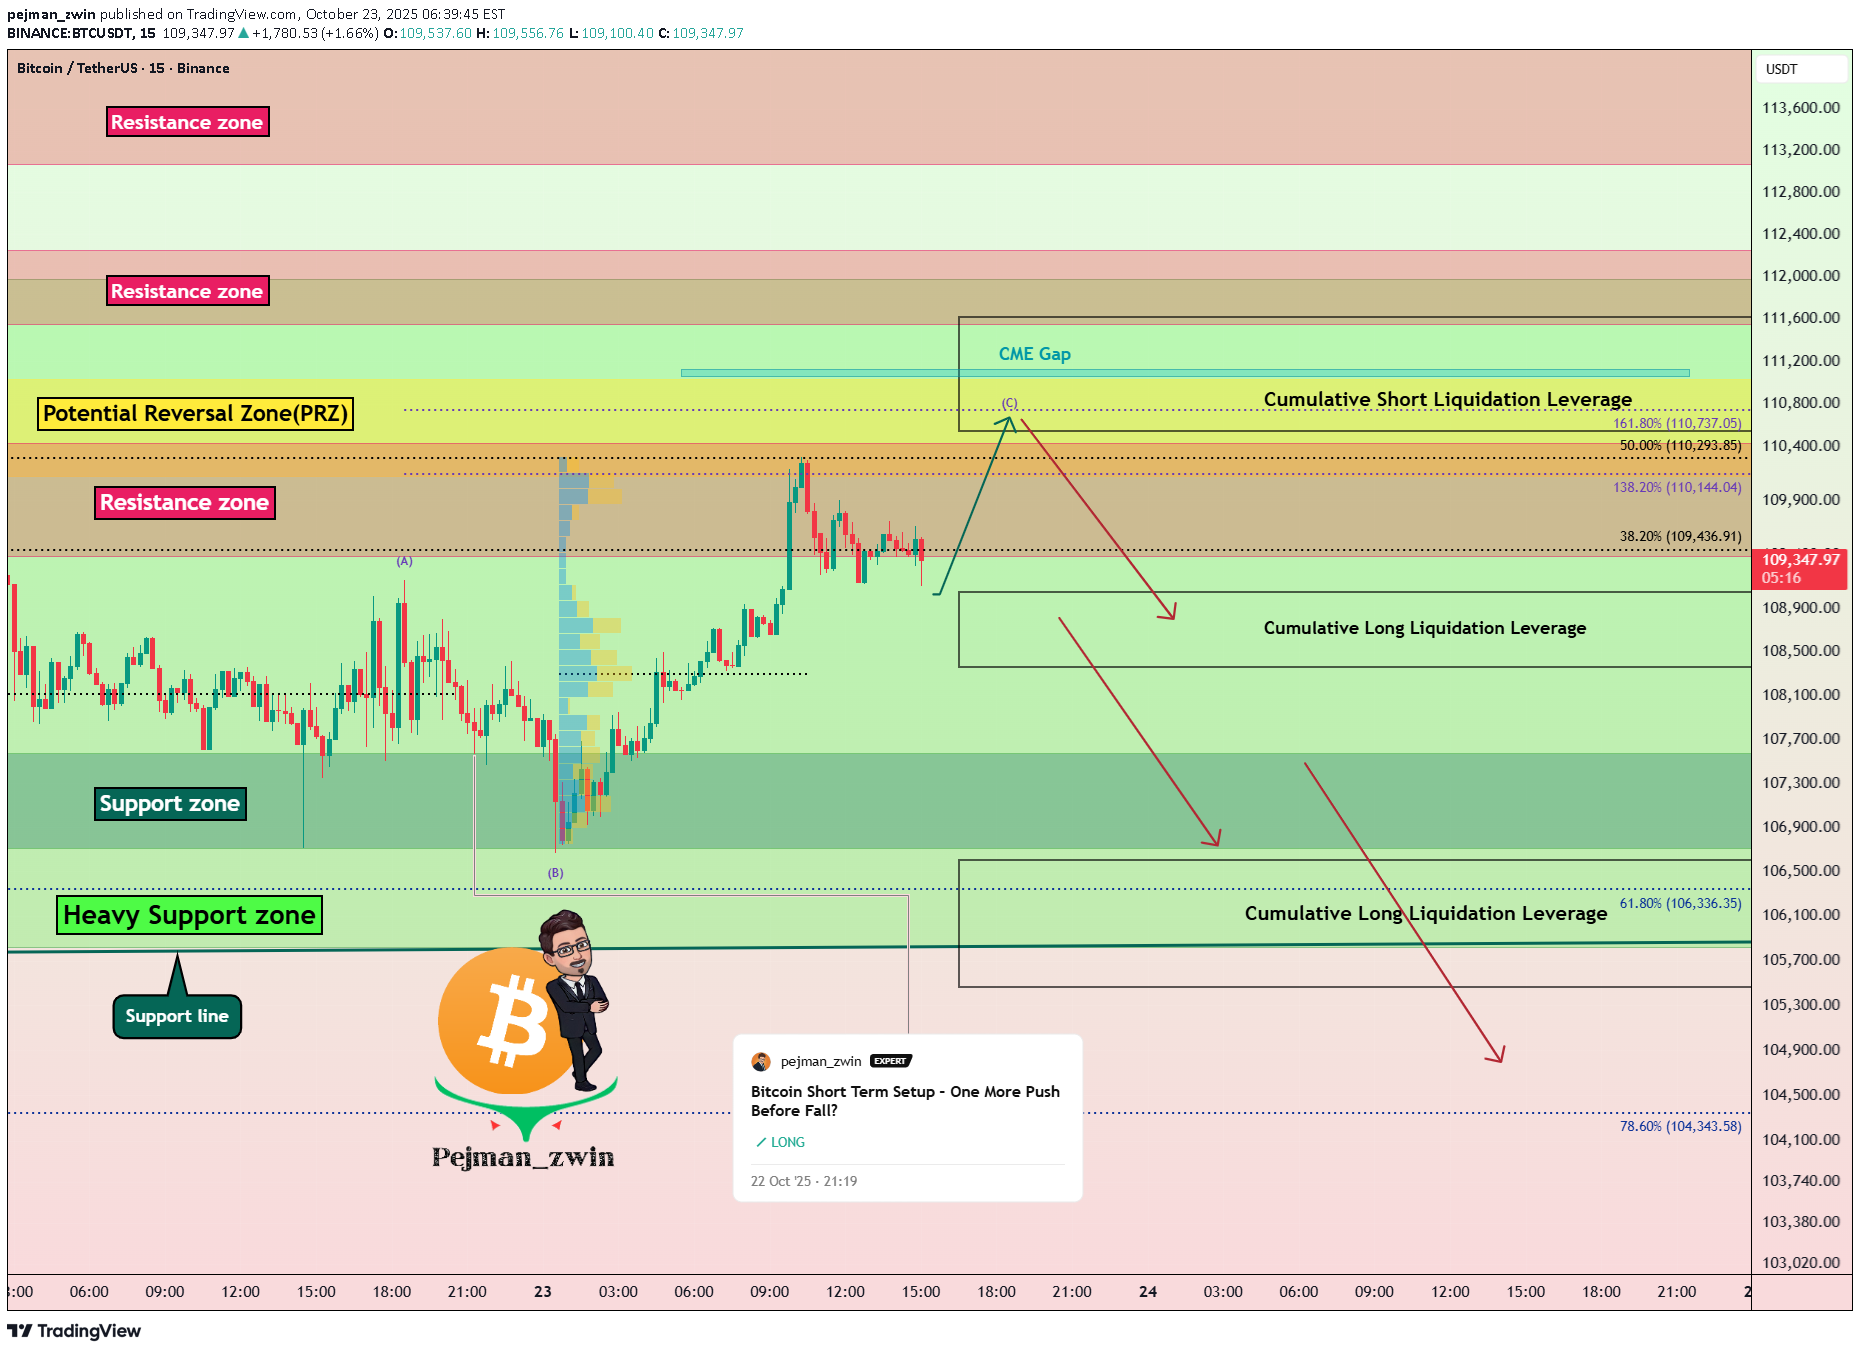
As I expected yesterday , Bitcoin ( BTCUSDT ) started rising from the Support zone($107,580-$106,700) and has now hit its Target at the Resistance zone($110,430-$109,380) . Now the question is: will Bitcoin continue its short-term uptrend in the next few hours, or is it going to drop again? Stay with me to find out. Bitcoin is trading near the Resistance zone($110,430-$109,380) , Potential Reversal Zone(PRZ) [$111,000-$110,130] , and Cumulative Short Liquidation Leverage($111,613-$110,542) . From an Elliott Wave perspective , it seems that Bitcoin is completing the wave C of an Expanding Flat Corrective Pattern(ABC/3-3-5) . Given that the S&P 500 ( SPX ) ( which has recently been correlated with Bitcoin ) is likely to drop when the U.S. market opens , I expect Bitcoin to resume its decline . This next drop might be the final push to break the Heavy Support zone($111,980-$105,820) . What do you think? Can Bitcoin break that Heavy Support zone($111,980-$105,820) in the end or not? Let me know your thoughts! Cumulative Long Liquidation Leverage: $106,606-$105,463 Please respect each other's ideas and express them politely if you agree or disagree. Bitcoin Analysis (BTCUSDT), 15-minute time frame. Be sure to follow the updated ideas. Do not forget to put a Stop loss for your positions (For every position you want to open). Please follow your strategy and updates; this is just my Idea, and I will gladly see your ideas in this post. Please do not forget the ✅' like '✅ button 🙏😊 & Share it with your friends; thanks, and Trade safe.Trade was activated in Cumulative Short Liquidation Leverage($111,613-$110,542)Following yesterday’s analysis, Bitcoin started an upward move and touched its resistance levels one by one, even filling a small CME gap. Now the question is whether Bitcoin can maintain this two-day uptrend or if it’s poised to drop again. Stay tuned. Currently, Bitcoin is moving near a Resistance zone, Cumulative Short Liquidation Leverage, Resistance lines, and a monthly pivot point. From a classic technical analysis standpoint on the one-hour chart, Bitcoin is forming a Rising Wedge Pattern. If it breaks below the lower lines of this wedge, that would be a strong signal of weakening in this short-term uptrend. From an Elliott Wave perspective, it seems #BTC is forming a Double Three Correction(WXY) within this rising wedge, likely completing near the Resistance zone. Note: As mentioned in previous posts, Bitcoin has had a high correlation with the SPX500 recently. If the S&P 500 starts a correction, we might see further downside for BTC as well. In conclusion, I expect Bitcoin, after breaking the lower lines of the rising wedge, to potentially drop at least to around $109,733. If it breaks the support zone, further decline is possible. Stop Loss: $113,020(Worst) Another Note: Also keep in mind any geopolitical tensions—like those between the US and Venezuela🇻🇪—could impact the crypto market if they escalate. So factor in end-of-week market sentiment and volatility as well.First Target Done($109,733), but I did not close my position, and I did Risk Free. It seems that tensions between Venezuela🇻🇪 and the USA have increased a bit. The reaction of gold in the last hour or two could also be due to these tensions.Michael Saylor published a tweet, "Another Bitcoin buy incoming." As long as Bitcoin does not rise above $114,000, a reversal is possible from a technical analysis perspective. Of course, in my analysis, I had given a warning of the risk-free, but I closed this analysis with a Stop Loss(SL) (transparency is important).