Technical analysis by ThetaNomad about Symbol BTC: Buy recommendation (10/16/2025)

ThetaNomad
بیت کوین: آیا قبل از سقوط بزرگ، شاهد پامپ مصنوعی خواهیم بود؟
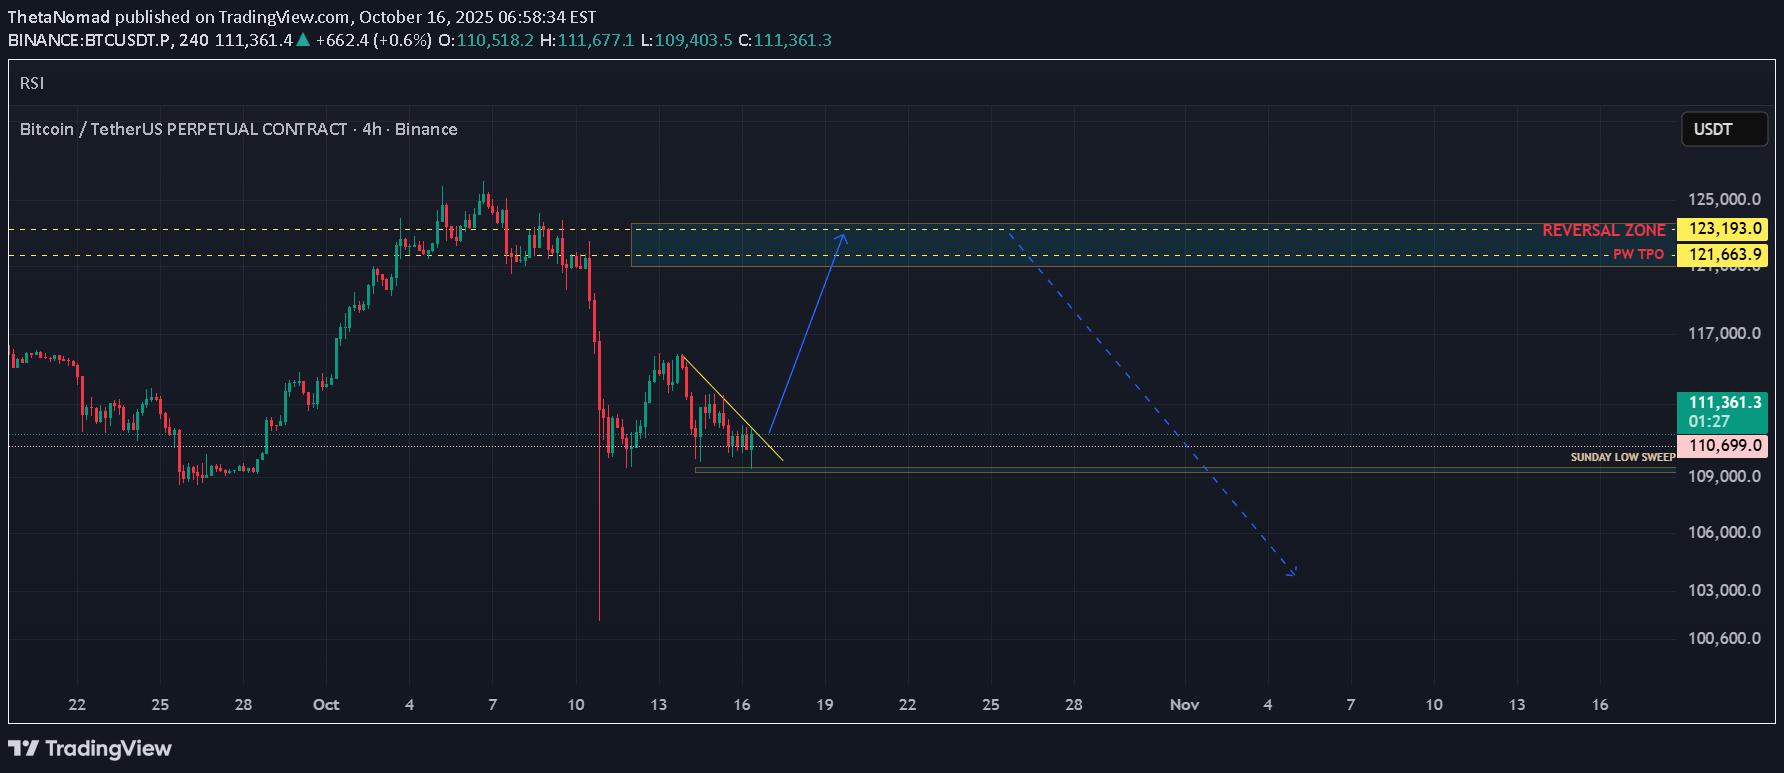
Traders, Last time I talked about arbitrage inefficiencies between spot and perps. I expected a dip first, then a corrective move up. That view still stands — but I also expected a sweep up before the bigger move down. In my earlier notes I called for a sweep to clean the Sunday low, followed by a move back toward 120–122k with a short squeeze. That scenario is now in play. I planned to long near 109.350, after the sweep, and only if the data aligned with my thesis. What I projected vs what happened Sweep the Sunday lows, then squeeze up. Wait for the sweep and only enter if the data confirms around 109.550. Entered 109.550 once multiple signals lined up. Why I entered at 109.550 Stablecoin-margined CVD First pass: Stablecoin Margined CVD made a lower low while price made a higher low → hidden bullish divergence. Aggressive sellers were getting absorbed by resting bids. Second pass: Stablecoin Margined CVD made a higher low while price made a lower low → selling pressure fading, buyers absorbing again. Coin-margined CVD Coin Margined CVD kept making lower lows while price refused to follow → another hidden bull div. Shorts were leaning in, but passive buying held firm. Spot CVD Lower lows on CVD while price held flat or slightly higher → trapped aggressive sellers, absorbed by steady passive spot buyers. On Binance Perp Order Flow we could also see a regular bullish divergence into a smaller hidden bull div at the sweep — a clean reversal setup. Open Interest read Here’s where many traders miss the nuance. There are two main perp types on Binance and most major exchanges: Coin-margined contracts: collateralized with the underlying asset (e.g., BTC). Profits and losses are settled in BTC. Stablecoin-margined contracts: collateralized with a stable asset (e.g., USDT or USDC). Profits and losses are settled in dollars. This matters because the behavior and risk exposure of traders differ between the two: When coin-margined OI goes down, it usually means BTC-collateral traders are closing positions or getting liquidated. They’re forced to sell BTC to cover margin, which can create short-term downside pressure. When stablecoin-margined OI goes up at the same time, it often means new traders are entering positions with USDT collateral. That capital rotation usually signals fresh directional bets, often late shorts piling in after a move down. So when price stops making new lows while stablecoin OI keeps climbing, it’s a clear sign the market is loading up on shorts, but without continuation. That mismatch is short-squeeze fuel. Combine that with the CVD divergences above and it paints a strong case for a move back into overhead liquidity. Supplementary edge 1H RSI bullish divergence: RSI makes higher lows while price makes lower lows → loss of downside momentum, suggesting sellers are tiring. USDC.D and USDT.D bearish divergences: Stablecoin dominance charts make higher highs while RSI trends lower → stablecoin demand weakening. When that happens, capital tends to rotate back into BTC and risk assets, reinforcing the long bias. Broke above daily VWAP Together, these add extra confluence to the squeeze setup. Plan, target, invalidation Target: 122 area (blue box). At target: watching for rising price with fading delta, sell imbalances near highs, and absorption signals — that’s where I’ll start hunting shorts and let the market cool off. Invalidation: acceptance back below the Sunday sweep low with expanding negative delta and rising OI on the breakdown. That would kill the squeeze thesis. Summary: A clean sweep → multi-CVD bullish divergences → absorption → rising OI imbalance → RSI & VWAP confluence. All aligning for a controlled short squeeze toward 122k, before the market potentially resumes its broader corrective path. Does this mean we 100% go up? No. Markets don’t promise: they whisper. You listen, you align, and you risk what you can afford to be wrong about.For me, sweeping the weak Sunday low on Coinbase spot was the most important trigger. That level had been acting as a structural weak low, meaning price previously tagged it without strong excess or proper rejection, essentially leaving behind unfinished business. Since Coinbase spot represents real, unleveraged order flow, a sweep of that level signals that liquidity below it has been fully tested and absorbed by genuine buyers, not just leveraged traders. Once that liquidity was taken and the market showed signs of buying interest returning (e.g., absorption or reclaim of that level), it confirmed that the downside move had likely exhausted itself. This made it a high-conviction setup for a reversal or at least a short-term bounce.At the same time, on ByBit net Longs have been silently building up, and CVD is silently going up. So you’re telling me… on Binance we’ve got absorption, shorts leaning in, CVD diverging, spot holding the line. But on ByBit, net longs have been quietly building, CVD drifting up, open interest climbing without much noise. One side is offloading into resting bids, the other side is loading fresh positions into the pullback. If Binance shorts are getting absorbed while ByBit longs are getting comfortable, that’s not neutral: that’s fuel. One side’s about to get squeezed, the other’s already positioned for it. 1 + 1 doesn’t equal 2 here. It equals momentum. Let's see what happens next! ;)If you like my analysis, drop a like or comment. ❤️ I’m not selling anything. I don’t want anyone’s money. If anything this costs me money. I do this to help people see through the noise using data and logic. If it brings you value, interact. That’s how real insights rise above the noise.CME RTH wants to close the gap. Its already closed on ETH, (electronic trading hours), but RTH (regular trading hours, when big boy money comes in, wants that price) I will open a second long when CME RTH hits that blue box. If price slips below that, and we have 2/3 30 min candle closes below, the idea is more or less invalidated.Price hit the box. Second long opened.HurraayAnd, a 3th long has been opened at 108.400 I opened at 109.666 I opened at 109.550 I opened at 108.400 I will no longer add. Spending time (acceptance) below 109k will invalidate my idea. Stops are set at 105.900. Trade safe, manage risk!Now, a little interesting dive into the data. The first chart shows a drawn level at exactly 108K – with the text “BIG IMBALANCE BABY GIRL” 😉 👉 Chart 1 Want to know what’s happening a level deeper there? Let’s take a dive! 👉 Chart 2 At that exact level, we’ve got 32M contracts hitting the bid and 31M contracts lifting the ask. On paper, it looks like sellers had the upper hand — one million more contracts sold than bought. But here’s where the story gets interesting: Imagine two armies clashing at the 108K battlefield. The red army (sellers) charges in aggressively, unloading 32M market orders, trying to push the front line lower. The green army (buyers) holds their ground with 31M orders, absorbing every hit without backing off. Now, if price moves up from that level right after this exchange, it tells you who actually won: the buyers. Even though they threw fewer punches, their defense was rock solid — they absorbed all 32M sells and then pushed back. The result? Those aggressive sellers are now trapped shorts. You can already see this playing out: open interest starts dropping as price moves away from 108K. That’s the telltale sign of short covering — they’re being forced to buy back into strength. And the higher we go, the tighter that vice gets — every tick up squeezes the remaining shorts a little harder.Not closing my position. SL is at 105.900. The upside fuel possibility is to big for me to close the current risk I'm taking.Want to know why I'm not closing my position, and why I even added a 4th long at 107.390? Let the data tell us. First of all, we’re approaching a big AVWAP zone. Now ask yourself the real question: Are longs getting wrecked, or are longs quietly building? Here’s what I look for: what I call stealth accumulation. That’s when price looks weak, maybe even trending down, but the A/D line stays flat or starts creeping higher. It means that even though price keeps dipping, the volume is actually closing near the top of the candles. Buyers are absorbing the sells instead of backing off. For example, if BTC drops from 110K to 107K but A/D doesn’t follow, that’s not weakness; that’s accumulation. Big players are sitting on bids, catching everything that’s thrown at them while the chart still looks bearish. That’s exactly what I’m seeing here. The A/D line isn’t breaking down, which tells me the selling pressure is being soaked up. So I’m holding my longs. Price action looks scary, but the volume tells the real story, someone’s still buying quietly. Now, want to know an even scarier fact? Let’s look at Bybit during that same dump. Price kept falling, yet net longs on Bybit kept increasing, and what’s even more interesting, they’re not closing. That means traders are still holding their longs while the market is sliding. Normally, when price dumps, weak longs puke and OI drops. But here, OI is still up and net longs are growing. That’s not panic; that’s commitment. It tells me people are adding into the weakness instead of getting liquidated out of it. Combine that with what we saw on spot A/D (which stayed flat and didn’t break lower), and you get a very specific type of setup: Spot is quietly absorbing, while perps keep loading shorts or holding underwater longs. That’s exactly the kind of imbalance that leads to a violent squeeze later — because once price reclaims even a single key level (like 108K+), all that built-up pressure has to unwind. And that’s why I’m still holding. The data lines up: Spot’s absorbing, perps are overextended, and the trap is already set. (or not? ;) Check ByBit data here: ibb.co/5gD3yQ5ZI increased my risk and did not exit this long position yet. My average position size allows me to hold this for longer. If you are in a long, make sure to hedge or manage risk in any form or way.CVD is making lower lows, whilst price is holding. And some idiot just opened a fresh 331M short on Binance. If price absorbs this with passive buyers, then price will squeeze up pretty quick. Happy weekend!Remember my target from this analysis? $103,555 👀 Now take a look at the chart: Does it get more pixel-perfect than this? BOOYAAAH! 🚀Longs are closed and I'm starting to look for shorts.