Technical analysis by Youriverse about Symbol BTC on 10/15/2025

Youriverse
آیا اوج بیت کوین همین حالا رقم خورده است؟ تحلیل زمانبندی دورههای تاریخی
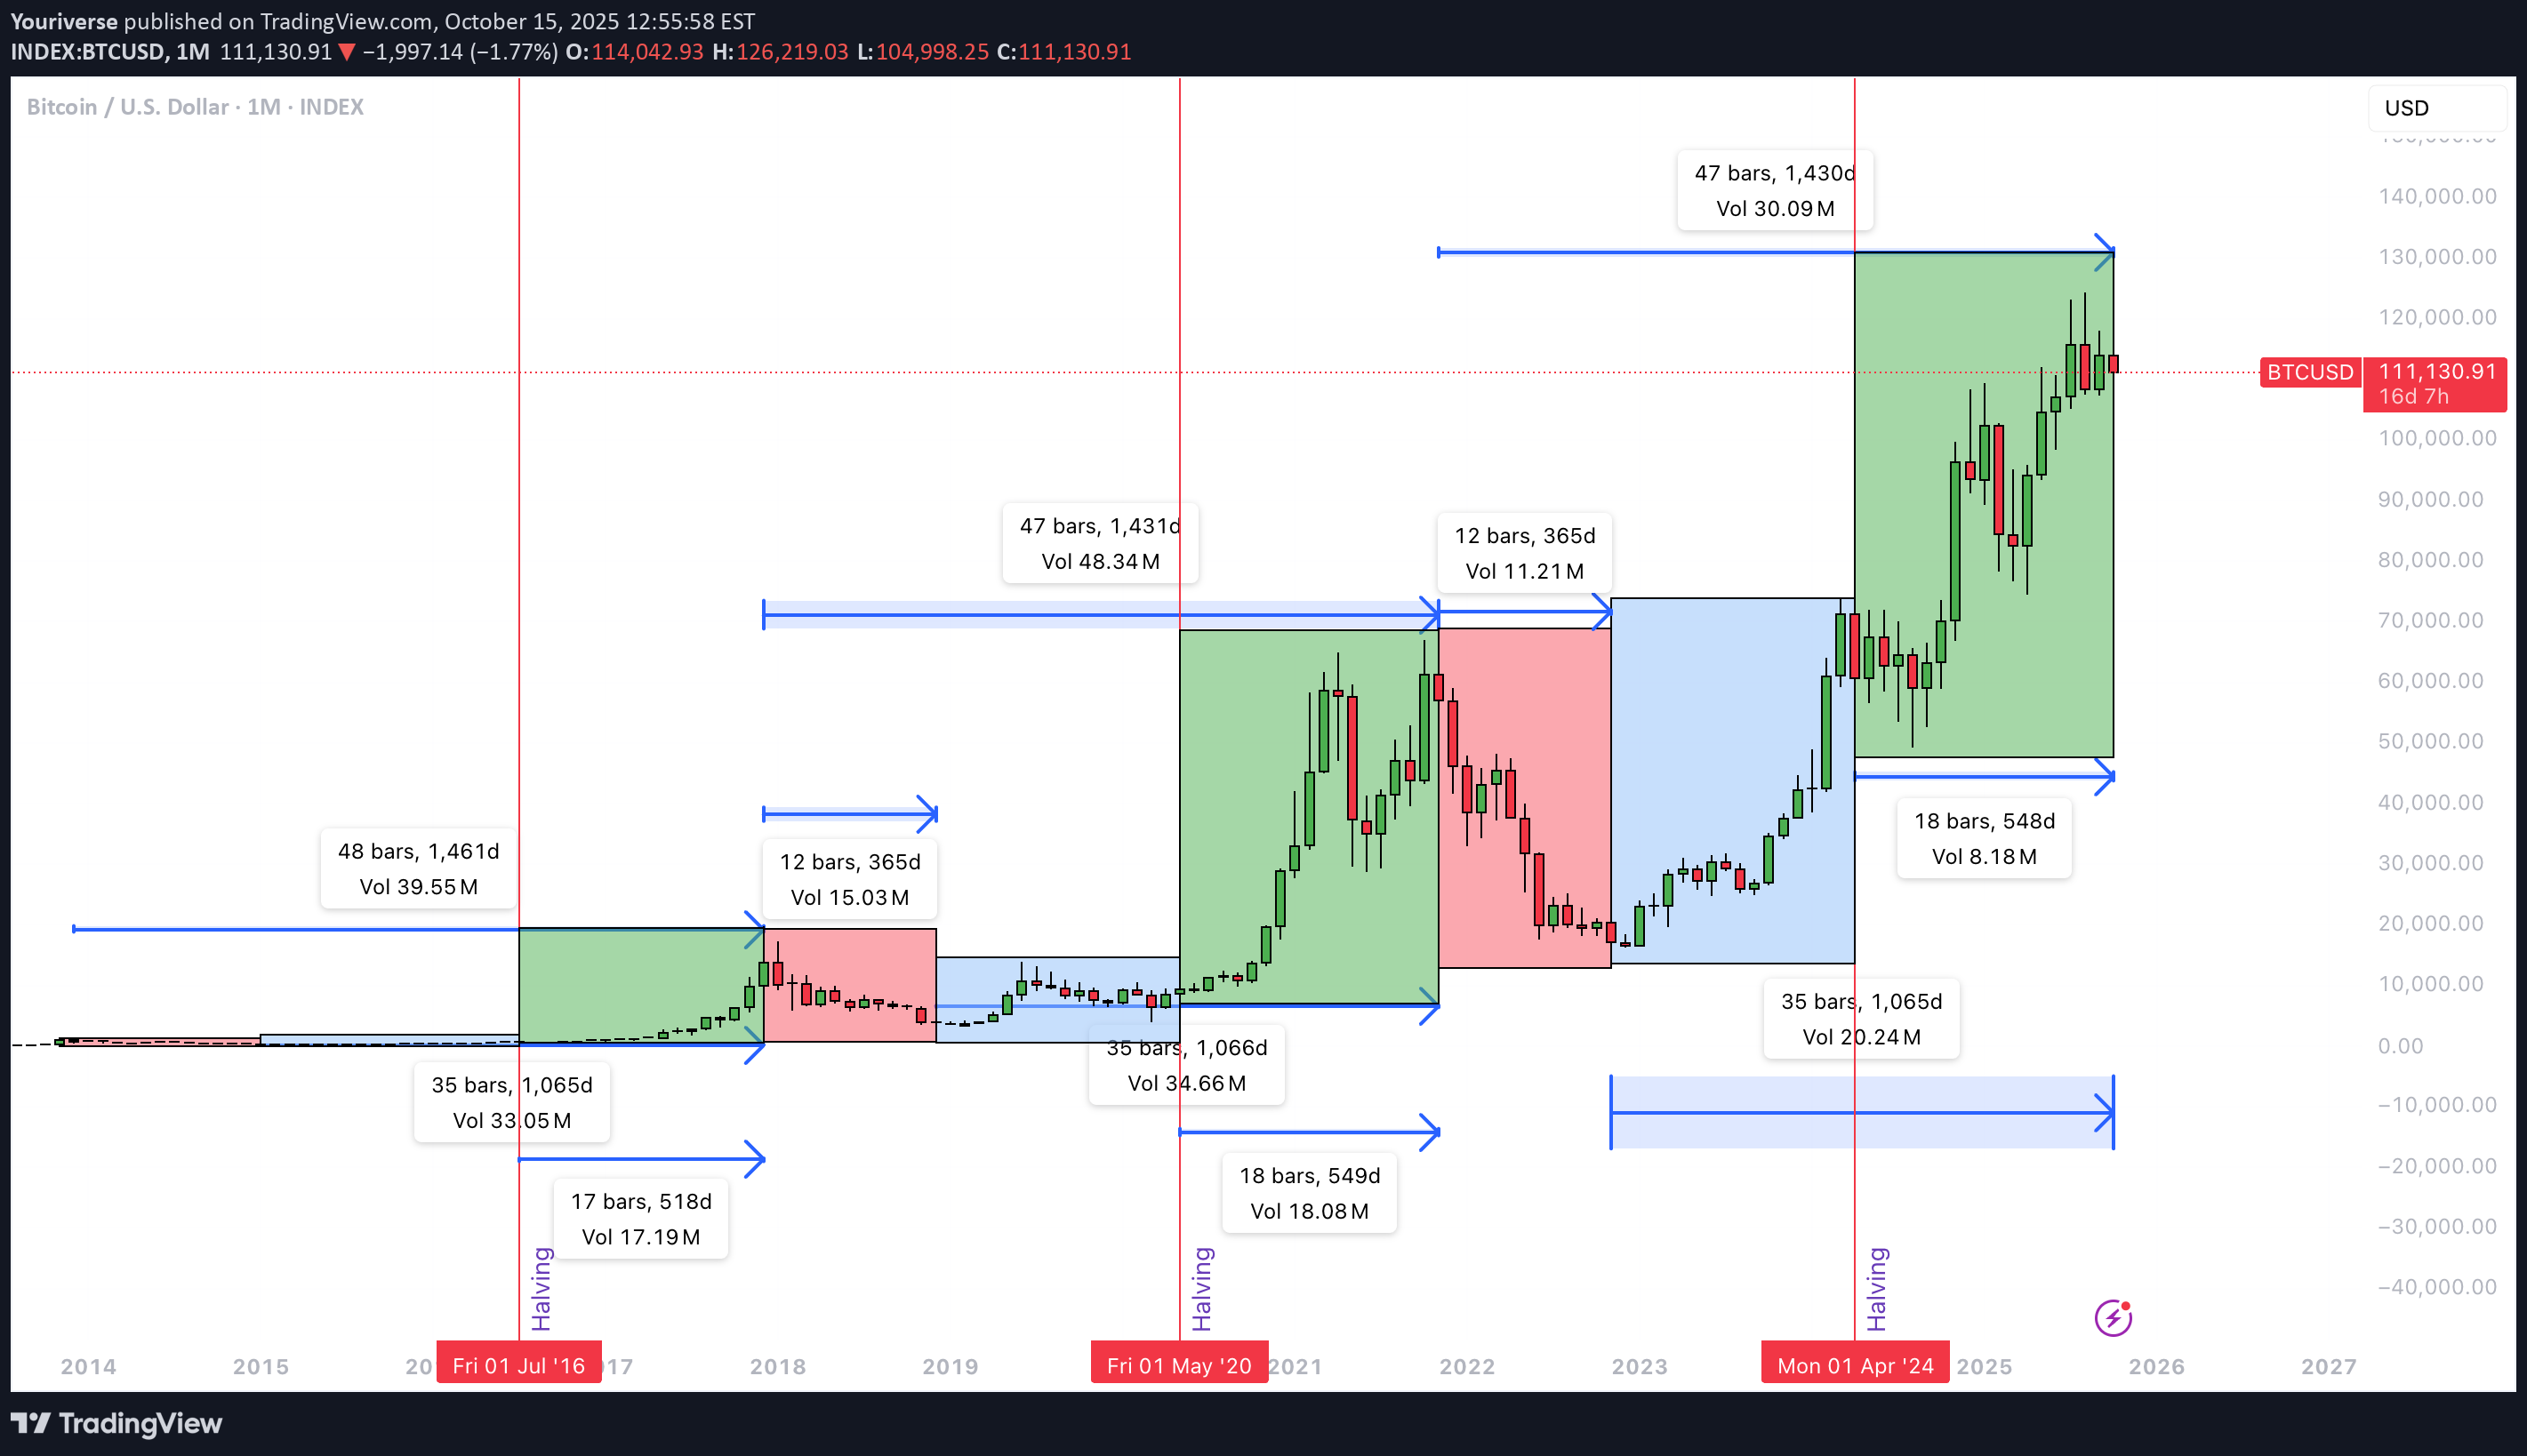
Introduction This chart analyzes Bitcoin’s cyclical timing. The focus is on time, not price. It examines the number of days between structural moments such as cycle tops, cycle bottoms, and halvings. By comparing these intervals, we can understand rhythm and consistency. This helps determine whether the current cycle top may have already formed in early October. Cycle Top to Cycle Bottom The period from cycle top to cycle bottom represents the bear phase after a market peak. In the previous two cycles, this phase lasted about 365 days each. This pattern suggests that the market typically needs a year to recover. After that, a new accumulation phase usually begins. If the pattern holds, it provides a fairly predictable window for correction. It marks the transition from euphoria to rebuilding. Cycle Bottom to Cycle Top The phase from cycle bottom to cycle top defines the bull run itself. In the last two cycles, this period lasted 1,065 and 1,066 days. That is just under three years. During this time, Bitcoin rose from deep accumulation to a new all-time high. Based on current data, 1,065 days points to early October. In that month, a new ATH was reached. This makes the current phase consistent with past cycles. It supports the idea that the top may already be in. Cycle Top to Cycle Top The full duration from peak to peak measured 1,461 and 1,431 days in previous cycles. This shows a clear recurring rhythm. The market moves in fairly consistent four-year patterns. Comparing this with the current cycle shows a slight extension. If the peak occurred in early October, this cycle is longer than the last. That may suggest a more mature market. Growth is slower but structurally stronger. Halving to Cycle Top The time between a halving and the next cycle top is key. Halvings affect both supply and market sentiment. In past cycles, this interval was 518 and 548 days. We are now exactly at day 548 since the last halving. This aligns perfectly with historical timing. It supports the idea that the top was reached in early October. The moment fits the halving-to-top rhythm observed in earlier cycles. Conclusion Based on this timing analysis, it is very likely that the cycle top formed in early October. The bottom-to-top duration of 1,065 days and the halving-to-top of 548 days confirm this. Both match previous patterns. The current cycle is slightly longer than earlier ones, suggesting a slower rhythm. If Bitcoin sets a new ATH later, it would mark an extended cycle. Timing alone does not guarantee future price direction. Macro factors, policy shifts, and liquidity events can all change the rhythm. Use timing cycles as context, not as prediction. Combine them with price structure and on-chain signals. Maintain active risk management, since longer cycles often bring higher volatility and larger deviations from historical averages.