Technical analysis by ColdBloodedCharter about Symbol DOT: Buy recommendation (21 hour ago)

ColdBloodedCharter
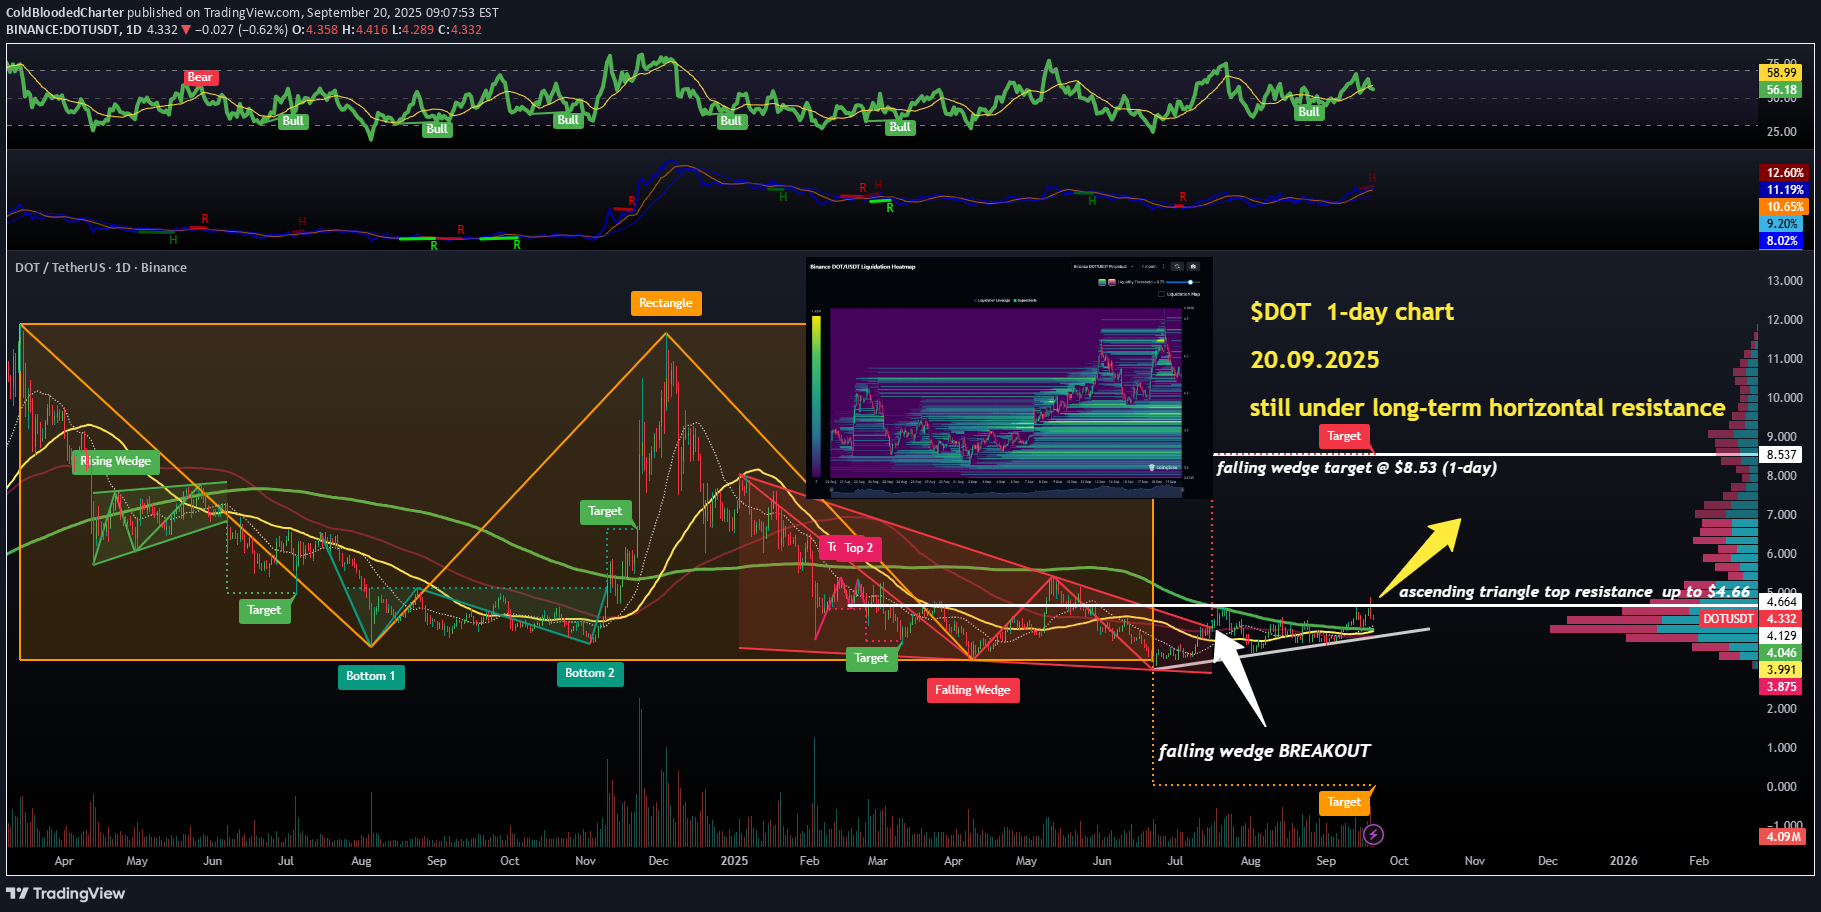
DOT on the DAILY chart still under that long-term horizontal resistance up there at $4.60 - $4.70 which is also now the upper trendline of our ASCENDING TRIANGLE that has been forming since late June. Same strategy, entries above $4.7 with a good daily candle close. Also about to materialize is the GOLDEN CROSS with a yellow 50SMA poised to cross above the green 200SMA. A lot of Liquidity is trapped between $3.90 - $4.10 in the last 30 days though, so that's another reason to stay cautious here. Have a look at the Liquidity heatmap attached, from the $4 zone could be our golden opportunity for increasing our positions. Good things after a bullish RSI divergence, nicely shaped bottom, bullish patterns.. What's not to like about this DAILY chart? 👽💙
