Technical analysis by MeTraderTr about Symbol BTC on 9/19/2025

MeTraderTr
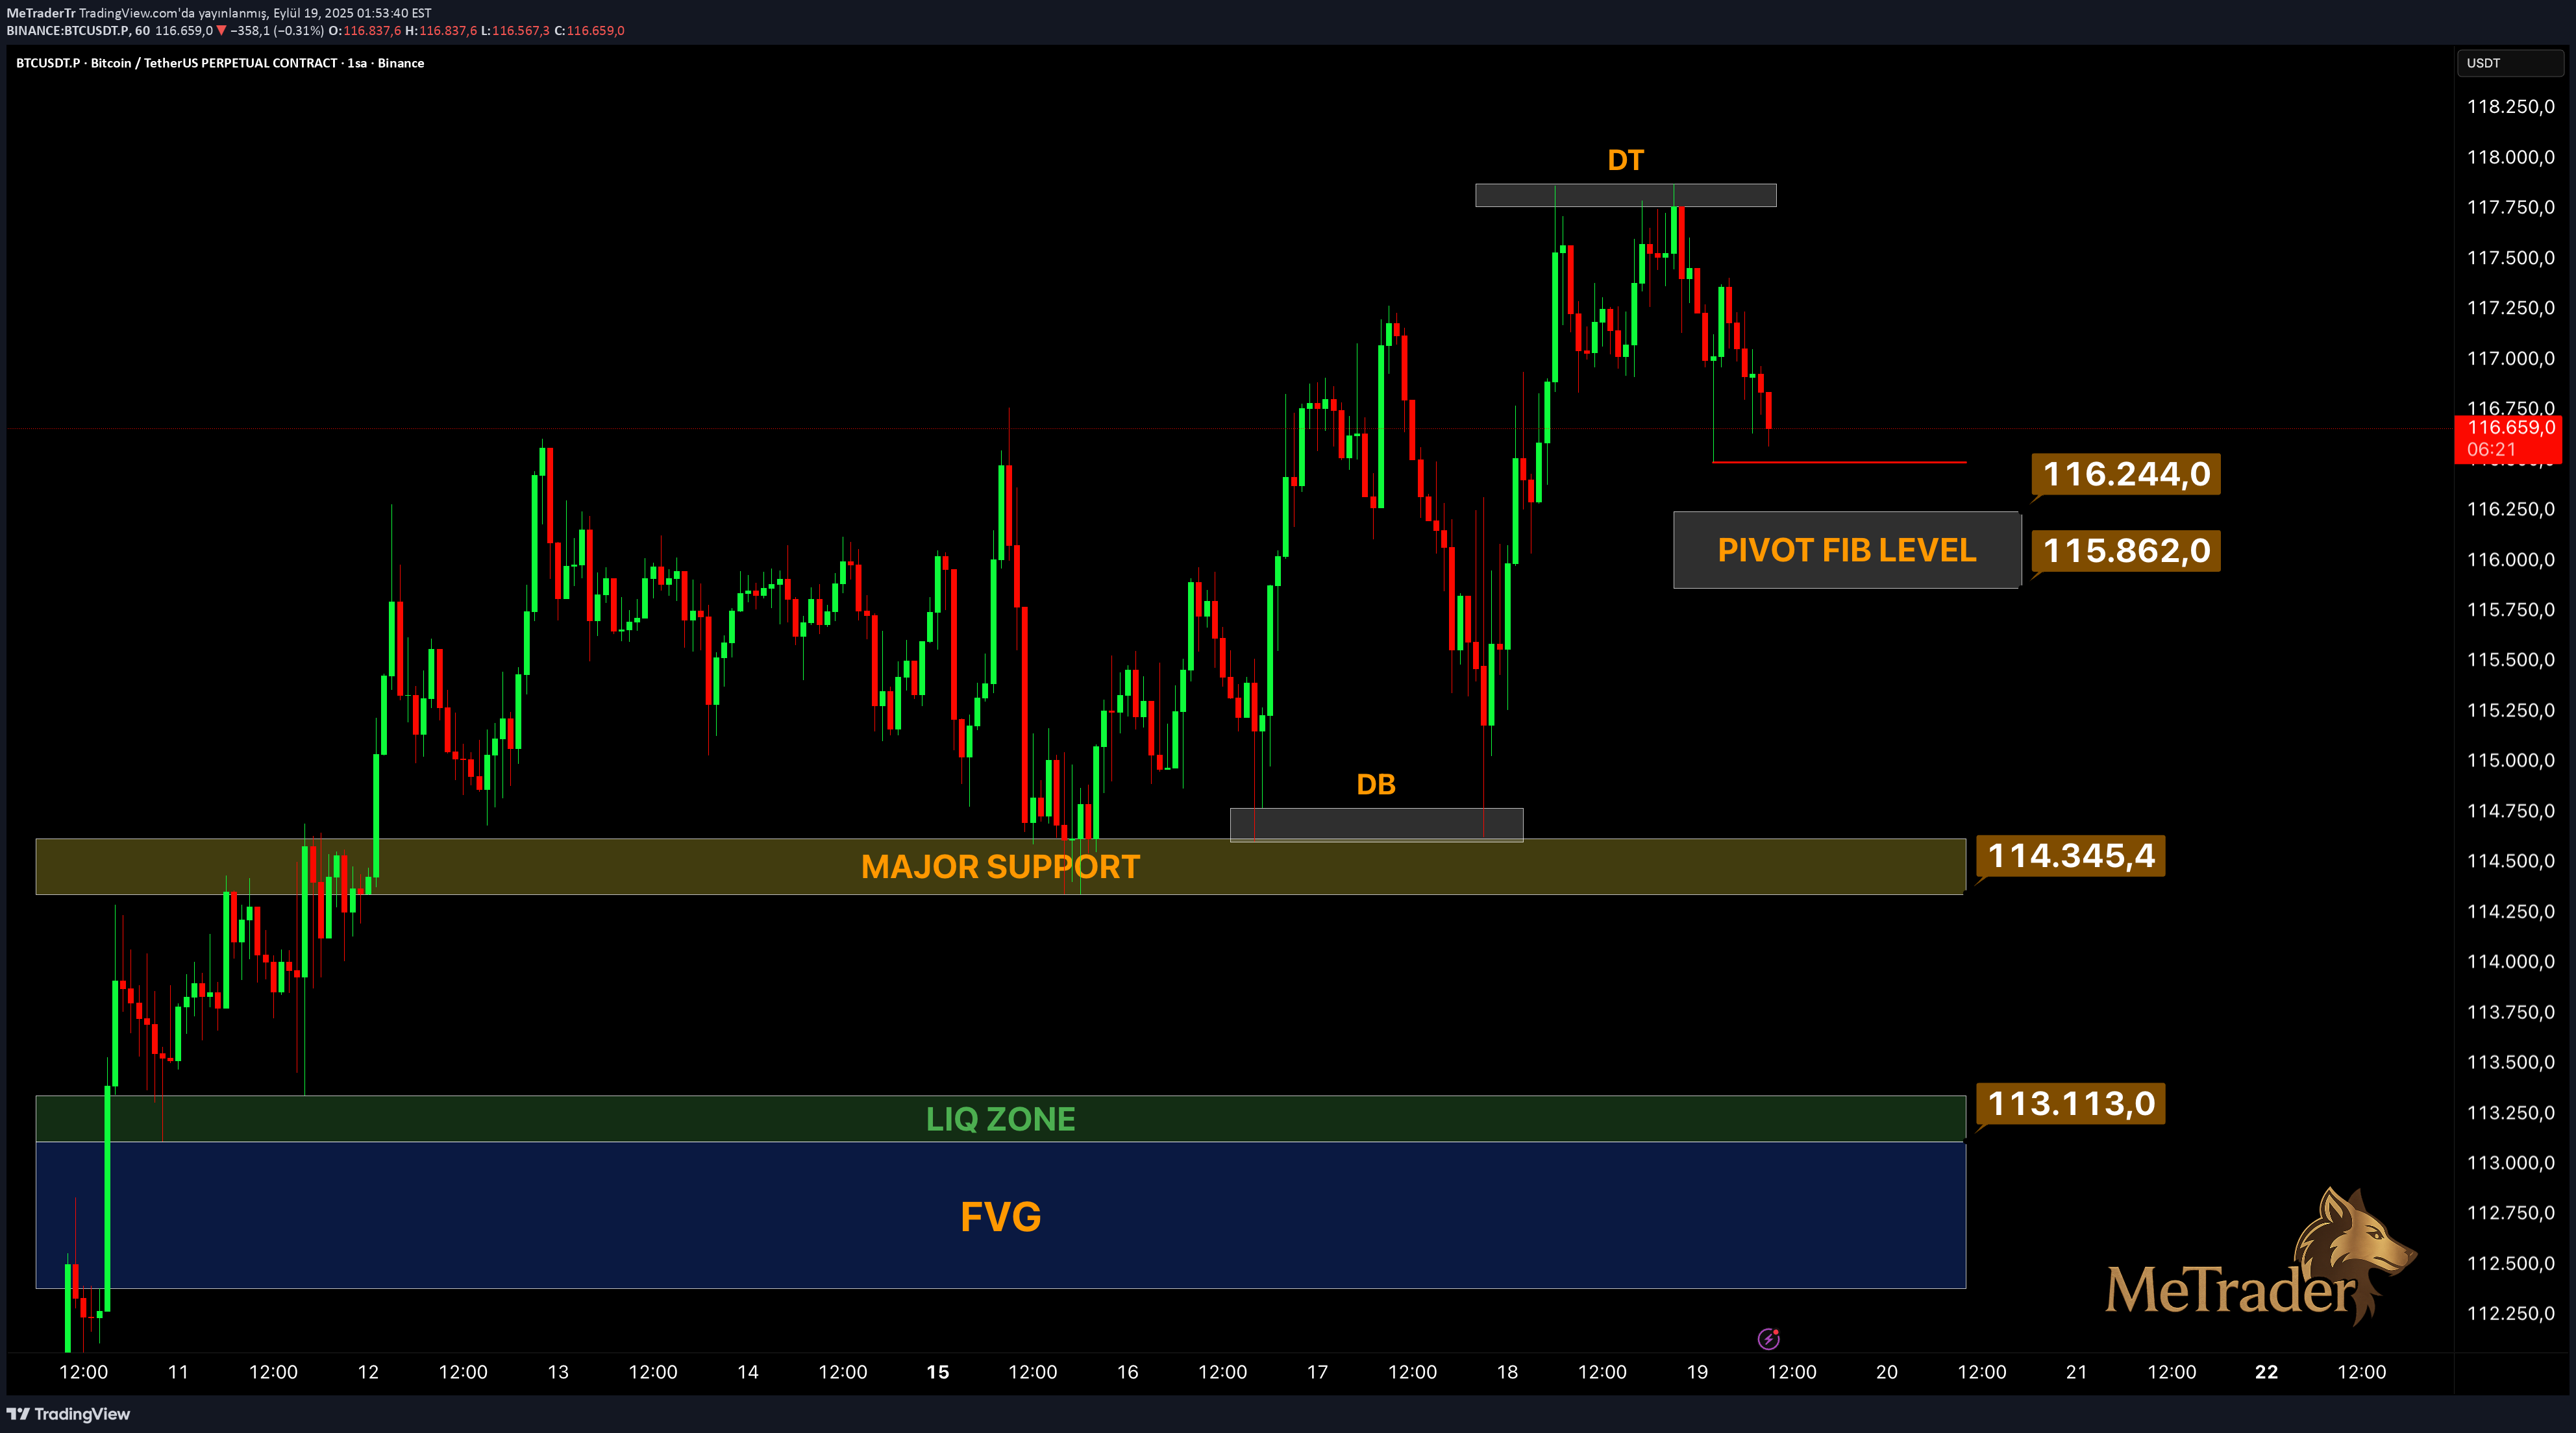
The first formation in the BTC graph is the double ball (DT) formation at $ 117.758. With the sales pressure from this region, the price has started to withdraw. Previously, the market received strong reaction from the support of around $ 114,345 with the Double Bottom (DB) formation. In such DT -DB combinations, the price usually tends to make a correction towards the middle band levels, ie pivot fibonacci areas ... 🔹 The first support area to be followed in the short term: • $ 116.244 Pivot Fib Level • $ 115.862 Pivot Fib Level This region is critical in terms of the direction of the price. If the holder comes in this area, we will see the upward response movements again ... 🔹 Negative scenario at support level: If permanence occurs below $ 115.862, the eyes will be translated directly to $ 114.345 Major Support level because this region is also a powerful test area because it is the place where DB was the bottom ... 🔹 Bad Scenario: • If $ 114,345 breaks, the next liquidity collection point will be $ 113.113. • There is a deep FVG (Fair Value GAP) under this, and if this GAP is filled, the price is likely to hang up to $ 112.500. #Bitcoin #btcusdt #crypto #trading #pricection
