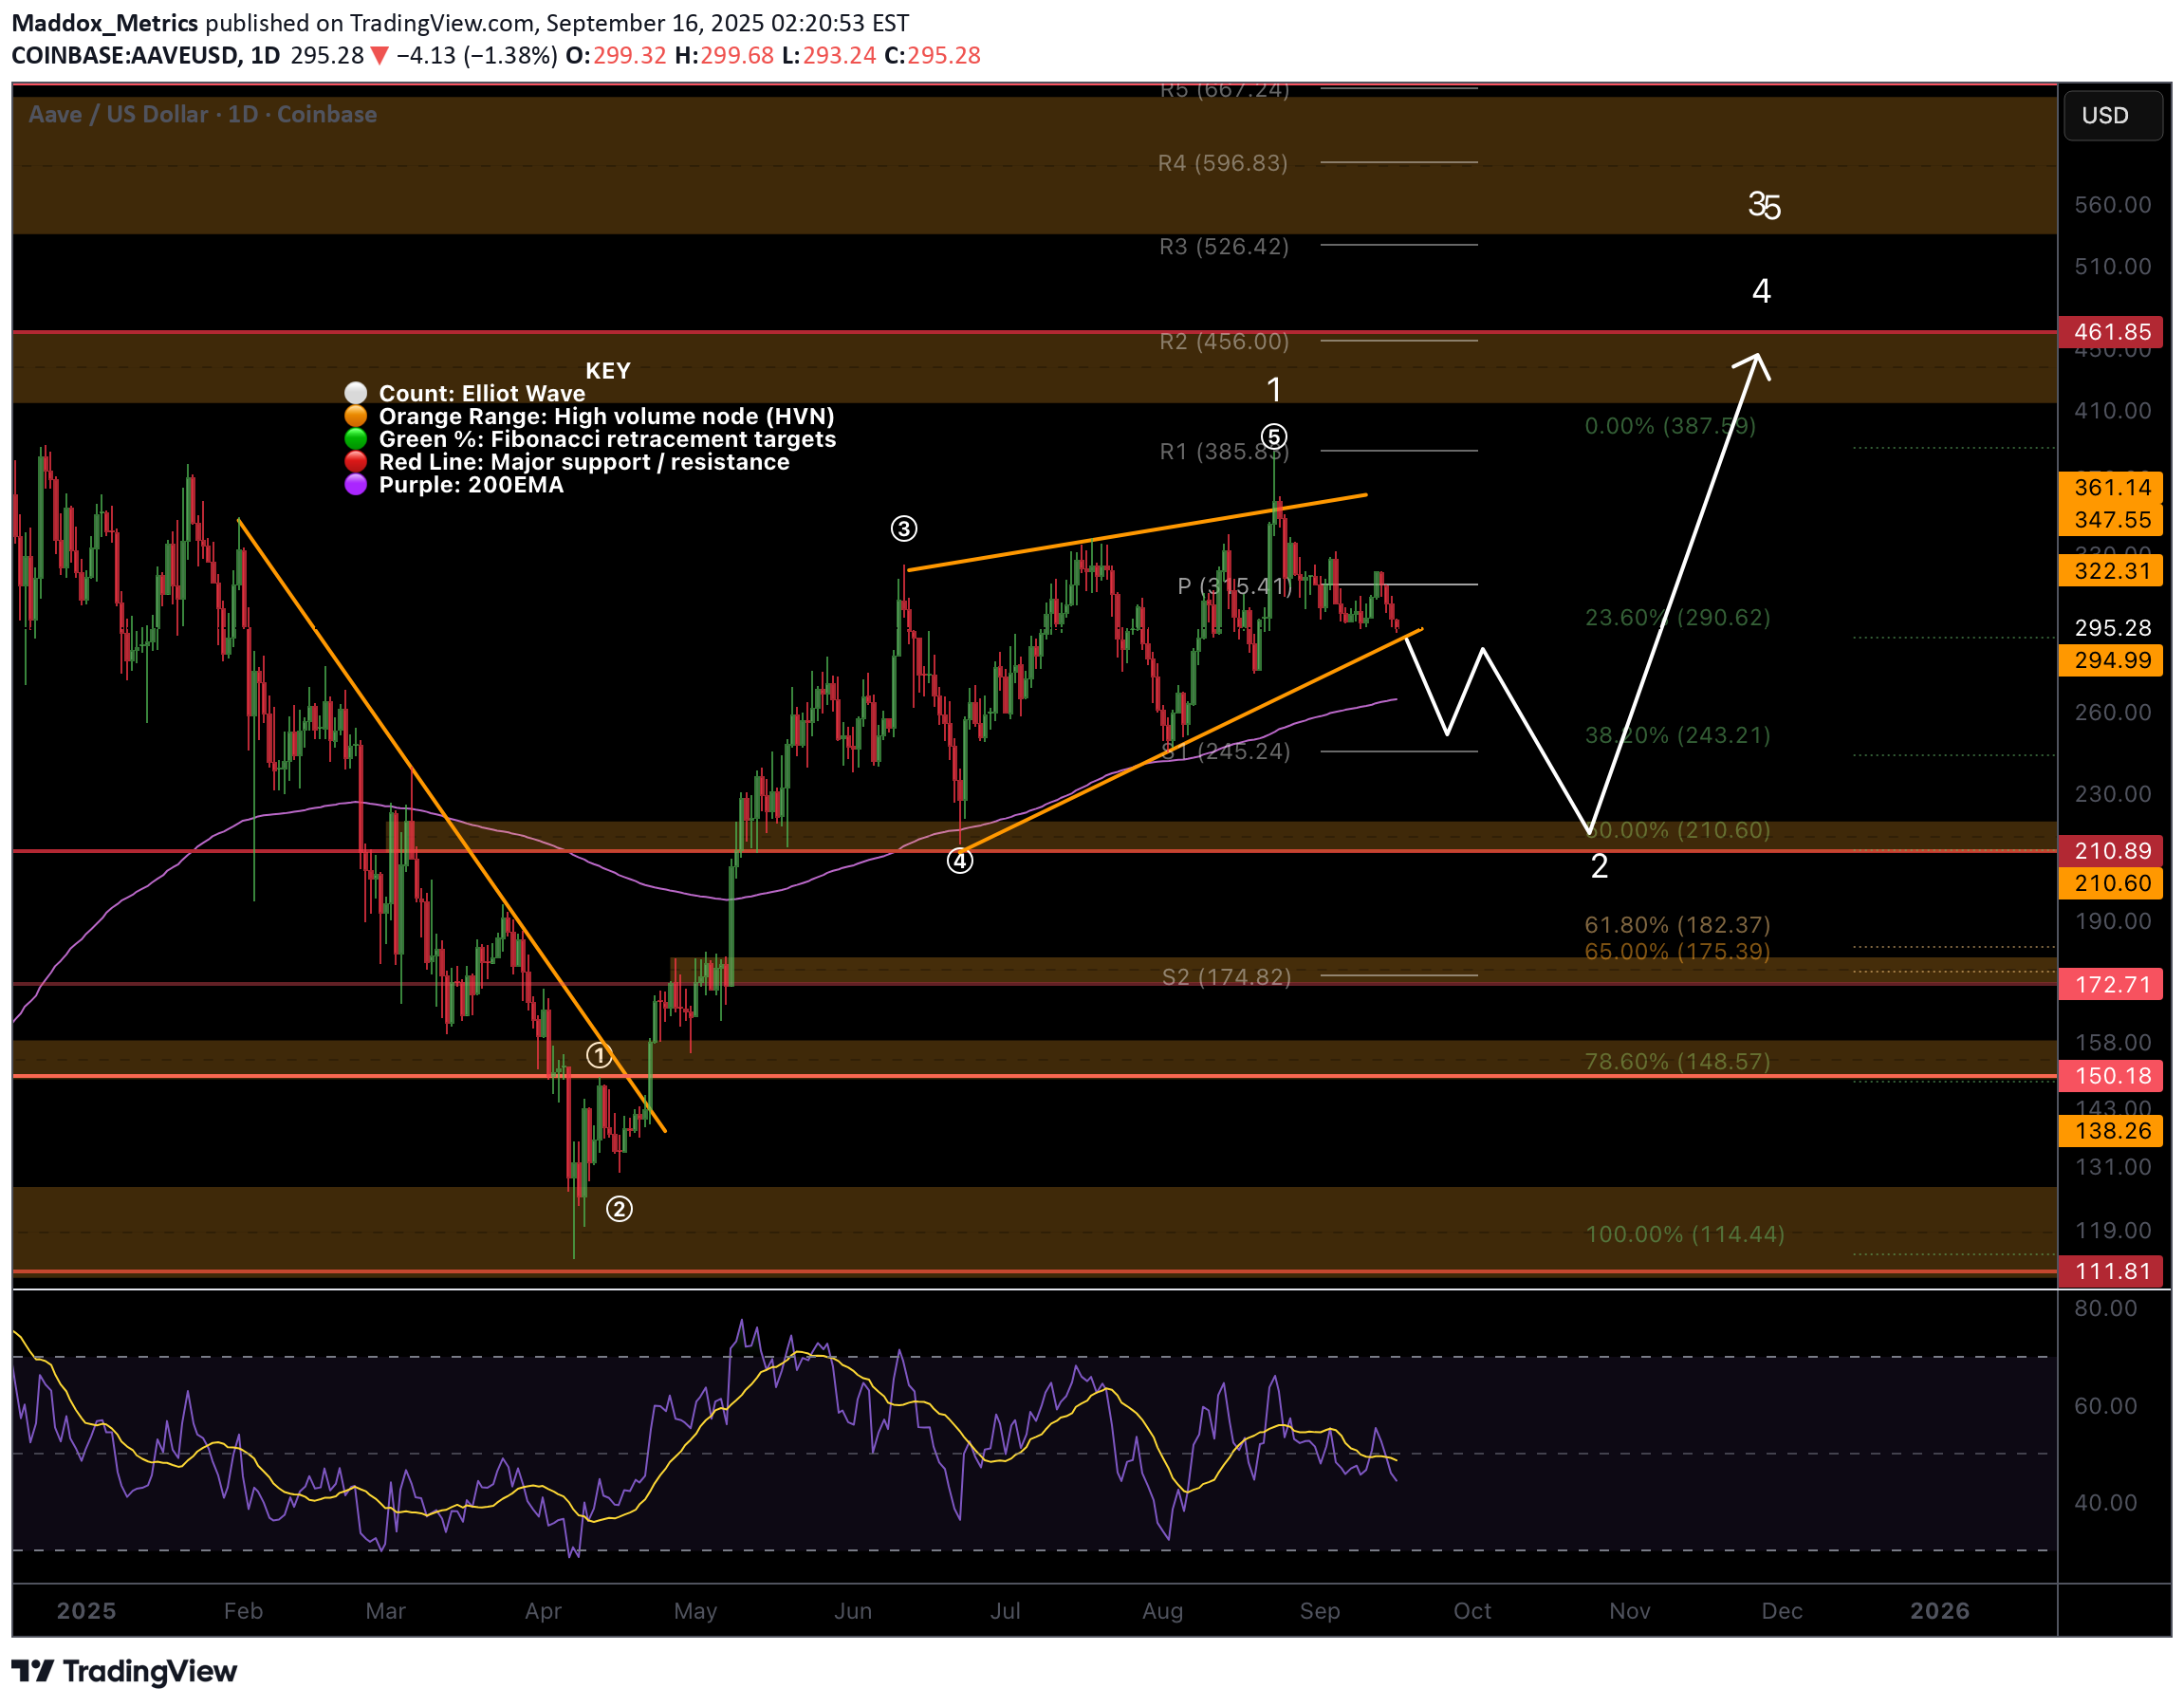
Technical analysis by Maddox_Metrics about Symbol AAVE on 9/16/2025

Maddox_Metrics

Local Analysis / Targets / Elliot Wave / Invalidation AAVE is now testing the ascending support line in what appears to be an Elliot wave 2 after completing 5 waves up, ending with a throw-over of a wedge. The daily 200EMA is just below and may act as support for continued upside. The next upside target remains $456 High Volume Node. Failing this support, downside targets are the major High Volume Node support and 0.5 Fibonacci retracement at $210, followed by the S2 pivot and golden pocket, $174. Price has lost the daily pivot but remains in an uptrend at this time. RSI has flipped negative from the EQ also preferring downside analysis. I am seeing timeline sentiment on X and other platforms all posting the same alt season analysis, TOTAL 3 about to breakout and BTC dominance collapsing. The crowd often does not get what it wants and people are now sleeping on BTC again. Analysis is invalidated if go above the swing high, (5). Standard Deviation Band Analysis If interested, please check my Substack for SD band charts as I can not share them here. The asset has remained in the descending standard deviation +2 band for more than the expected time (<5%) so a breakdown is highly probable. AAVEs distribution is non-normal so may a see a strong rejection to the fair value line around $150 which could present a great buy opportunity. First support is the bands lower threshold , ~$220. Safe trading