Technical analysis by AltcoinPiooners about Symbol FORM: Buy recommendation (9/14/2025)

AltcoinPiooners
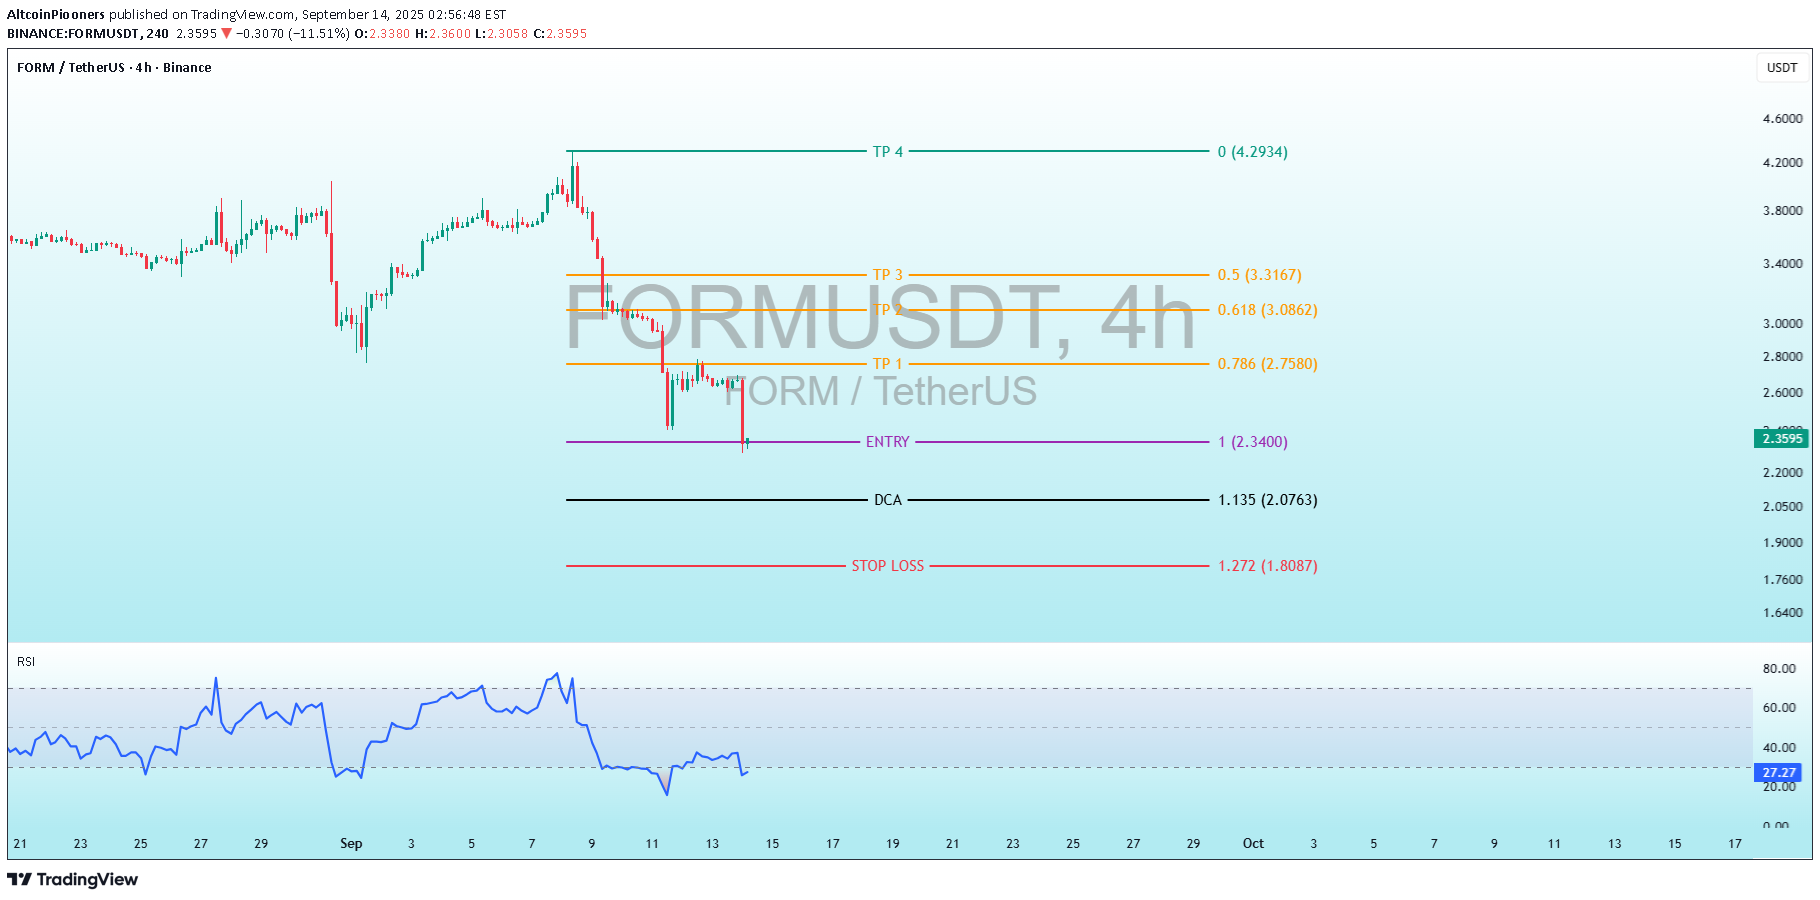
FORMUSDT FORM : Charge Into the Bull Run! Indicator Analysis: RSI The Relative Strength Index (RSI, period likely 14 based on standard settings) is plotted below the price chart in blue. It measures momentum on a scale of 0-100, with levels above 70 indicating overbought conditions and below 30 indicating oversold. Historical RSI Movement: The RSI mirrors the price action closely. It rose above 70 during the early September peak (overbought, signaling potential pullback), plunged below 30 during the mid-September drop (oversold, indicating exhaustion of sellers), recovered to around 60-70 during the rebound, and has now dipped again. Current Reading: At 27.31 (marked on the right axis), the RSI is deeply oversold. This suggests the recent downmove may be overextended, potentially setting up for a bullish reversal or bounce if buying pressure returns. However, prolonged stays below 30 can indicate strong bearish trends, so confirmation (e.g., RSI divergence or price breakout) would be needed. No visible divergence is present here—the RSI lows align with price lows. Trading Levels and Setup The chart features horizontal lines with labels, colors, and Fibonacci ratios, indicating a predefined trading strategy. This appears to be a bullish setup using Fibonacci retracement/extension tools, possibly drawn from a prior swing high (around 4.2934 USD) to a swing low (around 1.8087 USD). Fibonacci tools help identify potential support/resistance based on golden ratios. The levels suggest a long trade (buy low, sell high) with risk management via stop loss and dollar-cost averaging (DCA, buying more at lower prices to average down the entry cost). Here's a breakdown of the levels (from lowest to highest), including their prices, associated Fib ratios (where labeled), and implications: Stop Loss Red1.272 1.8087 Risk control point. If price hits here, the trade is exited to limit losses. Placed below key support, allowing ~23% downside from entry (calculated as (2.3400 - 1.8087) / 2.3400 ≈ 22.7%). Common Fib extension for stops in harmonic patterns. DCA Black 1.135 2.0763 Dollar-cost averaging level. If price dips, buy more here to lower average entry cost. The "1." might refer to Fib 1.0 or a custom label.EntryPurple1 2.3400 Suggested buy entry for a long position. Near current price action, implying the setup is active or imminent. Positioned at Fib 1.0 (full retracement/end of move). TP 1 Purple 0.786 2.7580 First take-profit target. ~18% upside from entry. Fib 0.786 is a common deep retracement level for partial exits. TP 2 Orange 0.618 3.0862 Second TP. ~32% upside from entry. Fib 0.618 (golden ratio) often acts as strong resistance/target. TP 3 Yellow 0.5 3.3167 Third TP. ~42% upside. Fib 0.5 is a psychological midpoint for scaling out. TP 4 Green 0 4.293 4Final/ultimate TP. ~83% upside from entry. No Fib label; likely an extension target or prior high. Strategy Interpretation: This is a classic swing long setup. Enter at 2.3400 USD expecting a bounce (supported by oversold RSI). Scale out profits at TPs for risk-reward ratio optimization—e.g., overall R:R could be 1:3+ if stopping at SL and hitting TP4. If price drops, use DCAs to accumulate. The Fib ratios (0.5, 0.618, 0.786, 1, 1.272) align with standard extensions/retracements, possibly from a bearish move, targeting a reversal. Current price seems near the entry, with downside risk to SL (~22.7% loss) vs. upside to TP4 (~83% gain). Potential Risks and Considerations: Bearish Bias: Recent red candles and oversold RSI could lead to further downside if support breaks (e.g., below 2.08 DCA). Volatility: Crypto markets like FORM (a smaller-cap token) are prone to whipsaws; the sharp mid-Sep drop highlights this. Confirmation Needed: Look for bullish candle patterns (e.g., hammer, engulfing) or RSI breakout above 30 for entry. External factors like market sentiment, news on Formation Fi, or broader crypto trends (e.g., Bitcoin correlation) could influence.
