Technical analysis by MR_gold2 about Symbol BTC: Sell recommendation (9/14/2025)

MR_gold2
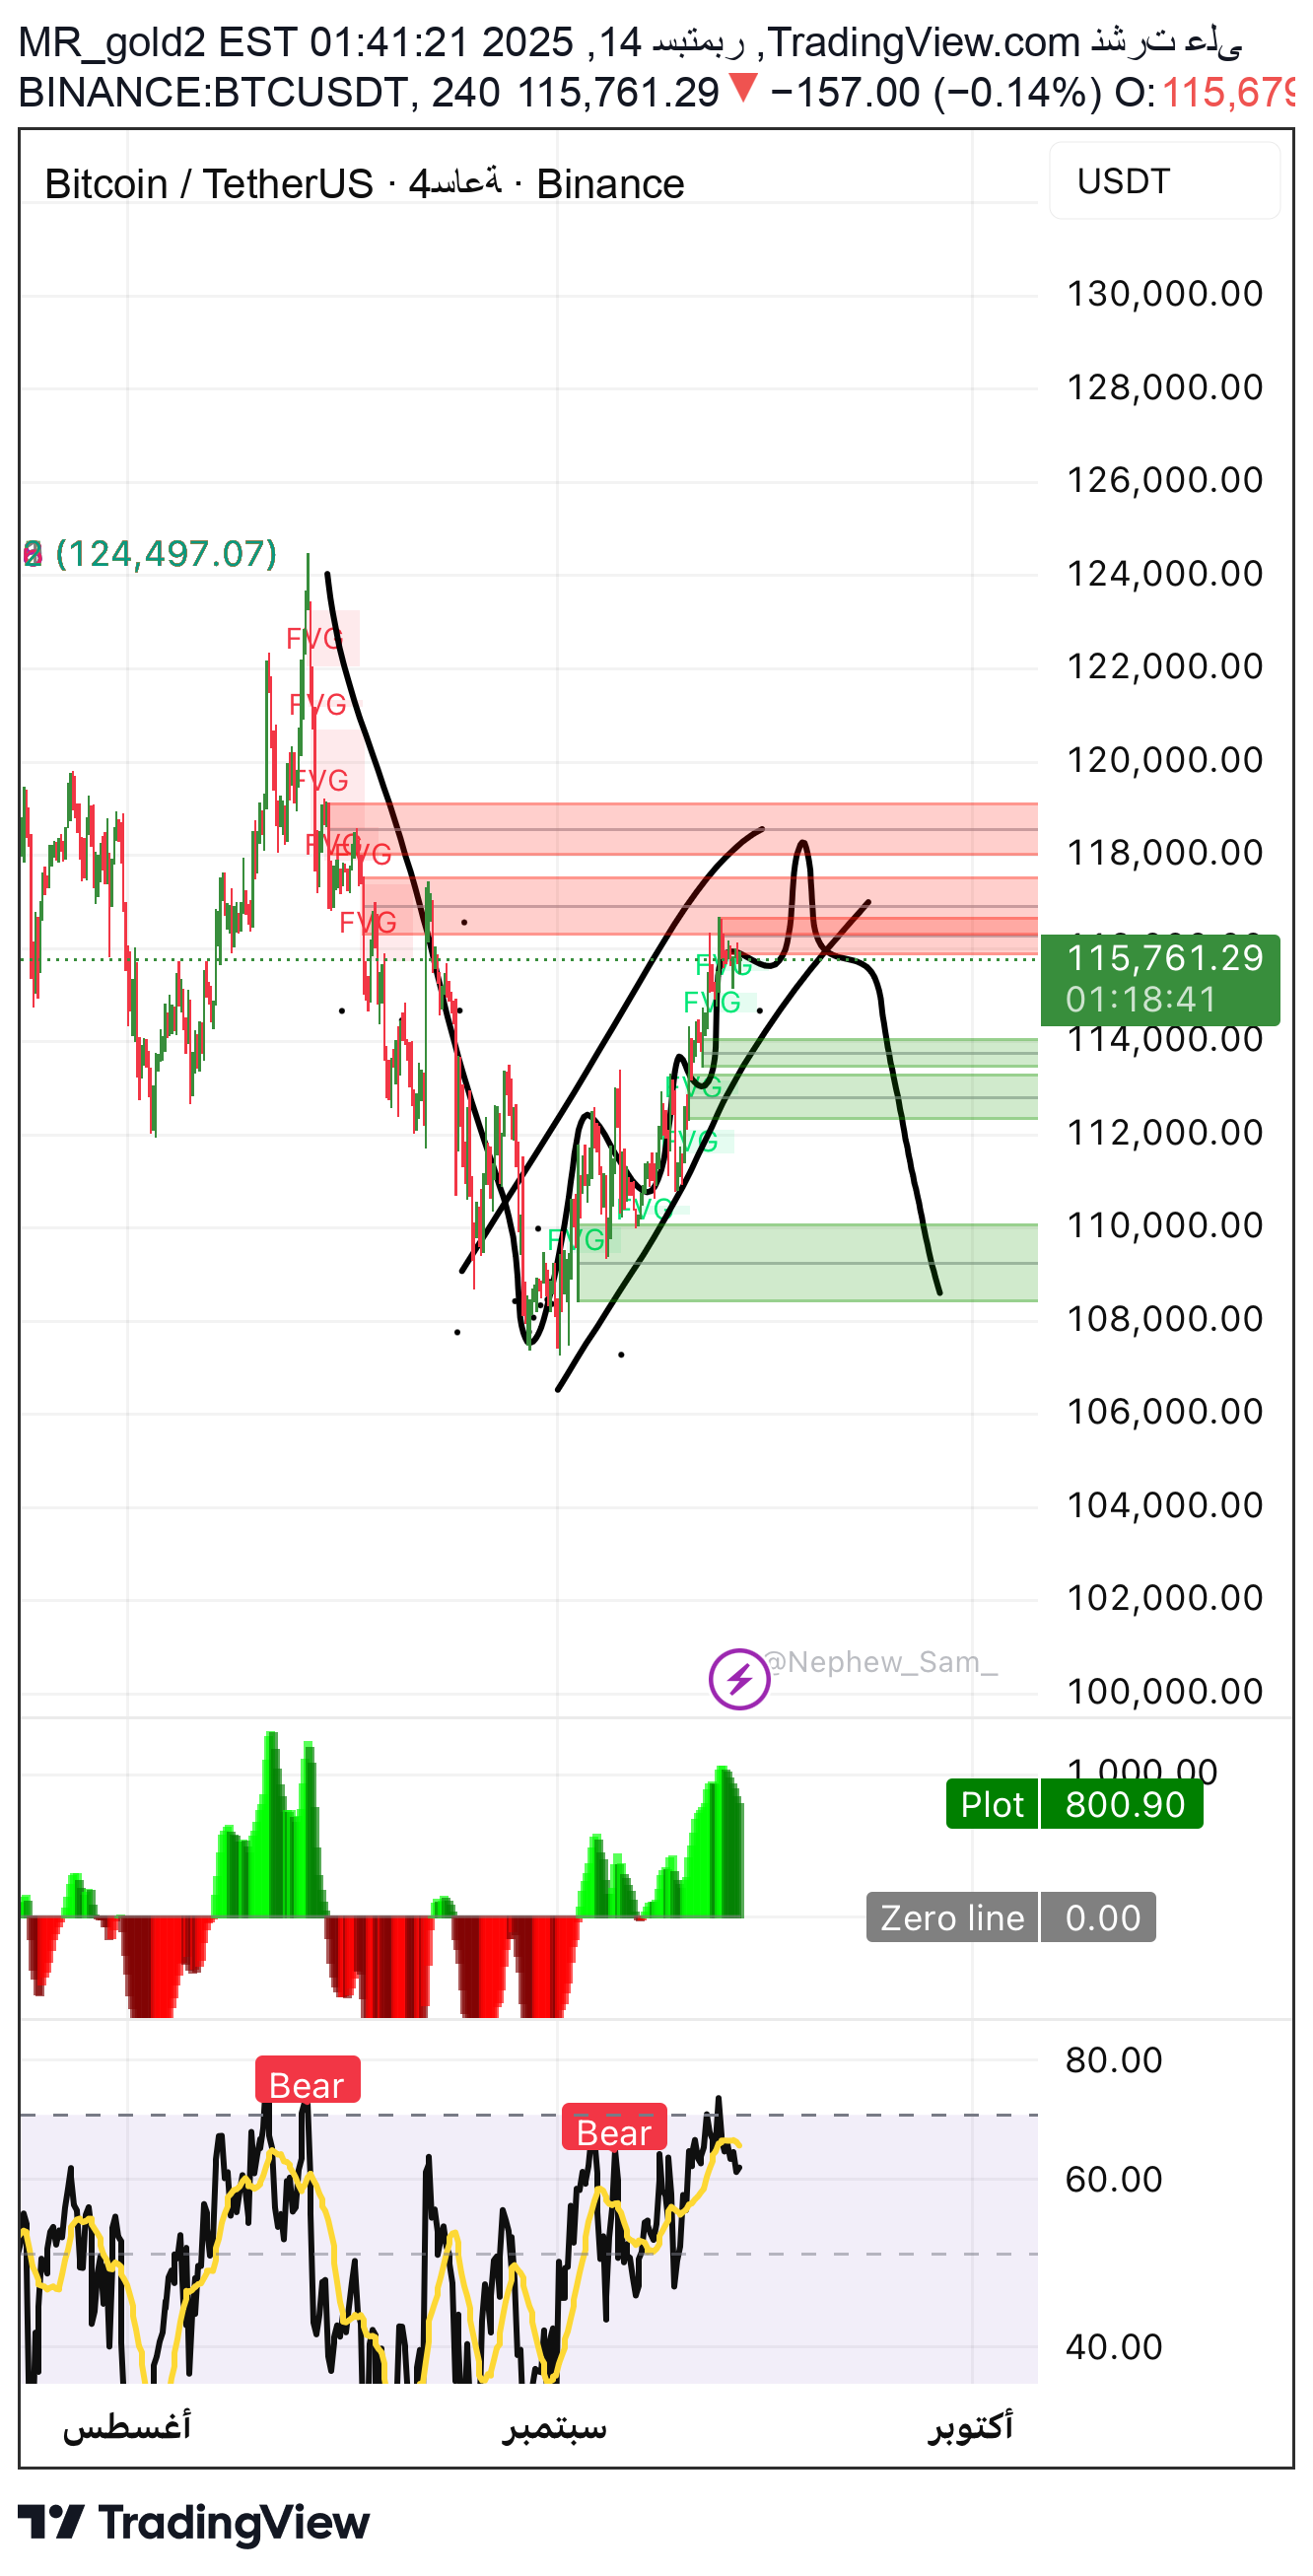
We apologize for the interruption period due to work pressure 1. Technical Analysis • Current price: 115,741 USDT. • We see that the price bounced from strong support areas at 110,000 - 112,500. • There are strong display/resistance areas gathered in red about: • 117,000 - 118,000 (FVG + areas of previous summits). • The lower indicator (RSI) shows purchasing saturation signals with the appearance of the "Bear" sign, which suggests the possibility of short -term correction. ⸻ 2. Elliott <0) • It is clear that we are in an emerging corrective wave after the last landing. • The closest scenario: • A wave from the landing ended at 107,500. • Currently, the Wave B extends up (may up to 117,500 - 118,000). • It is possible to enter the Caire C to test 110,000 - 111,000 regions. ⸻ 3. Time Cycles • There is a clear fluctuation in price sessions between every 7 - 9 days trading between summits and bottoms. • The previous bottom (107,500) was about a week ago, which may indicate that the formation of a new temporary summit is approaching 1-2 trading day. ⸻ 4. • Pivot Point: 115,200 Fibonacci levels: • 0.382 = 113,800 • 0.5 = 112,600 • 0.618 = 111,400 • These areas correspond to the green FVG areas (demand and support areas). ⸻ 5. Fundamental • There is no direct news today affecting bitcoin, but: • The strength of the dollar and federal decisions will remain influential on the appetite for risk. • The markets are currently waiting for important American economic data during the week (CPI / benefit). ⸻ 6. Price Action • The last candles show weakness in the upward momentum at 116K. • The presence of long upper tails suggests a sale from the show areas. • A clear fracture below 115K will open the way for a corrective decline about 113K. ⸻ 7. Calls and resistance • Calls: • 113,800 • 112,500 • 110,000 • Resistance: • 117,000 - 118,000 (very strong resistance) • 120,000 (psychological resistance + previous tops) ⸻ 8. Technical and hormonal models • A possible Double TOP model if the price fails to penetrate 117,000. • The possibility of the Harmonic Bearish Gartley model is complete near 118,000. ⸻ Recommentation • INTRADAY: Selling from 116,800 - 117,500 regions by stopping a loss above 118,200. Goals: 115,000 and 113,500. • Averages (Swing): If the price returns to 110K - 112K, it is considered good purchase areas with 118K - 120K. ⚠️ alert: bitcoin is very volatile, adherence to the LOS is necessary and capital management is more important than entering Analyst Engineer Ehab, Sayed Al -Dahab channel
