Technical analysis by SatoshiMultiframe about Symbol BTC: Buy recommendation (9/8/2025)

SatoshiMultiframe
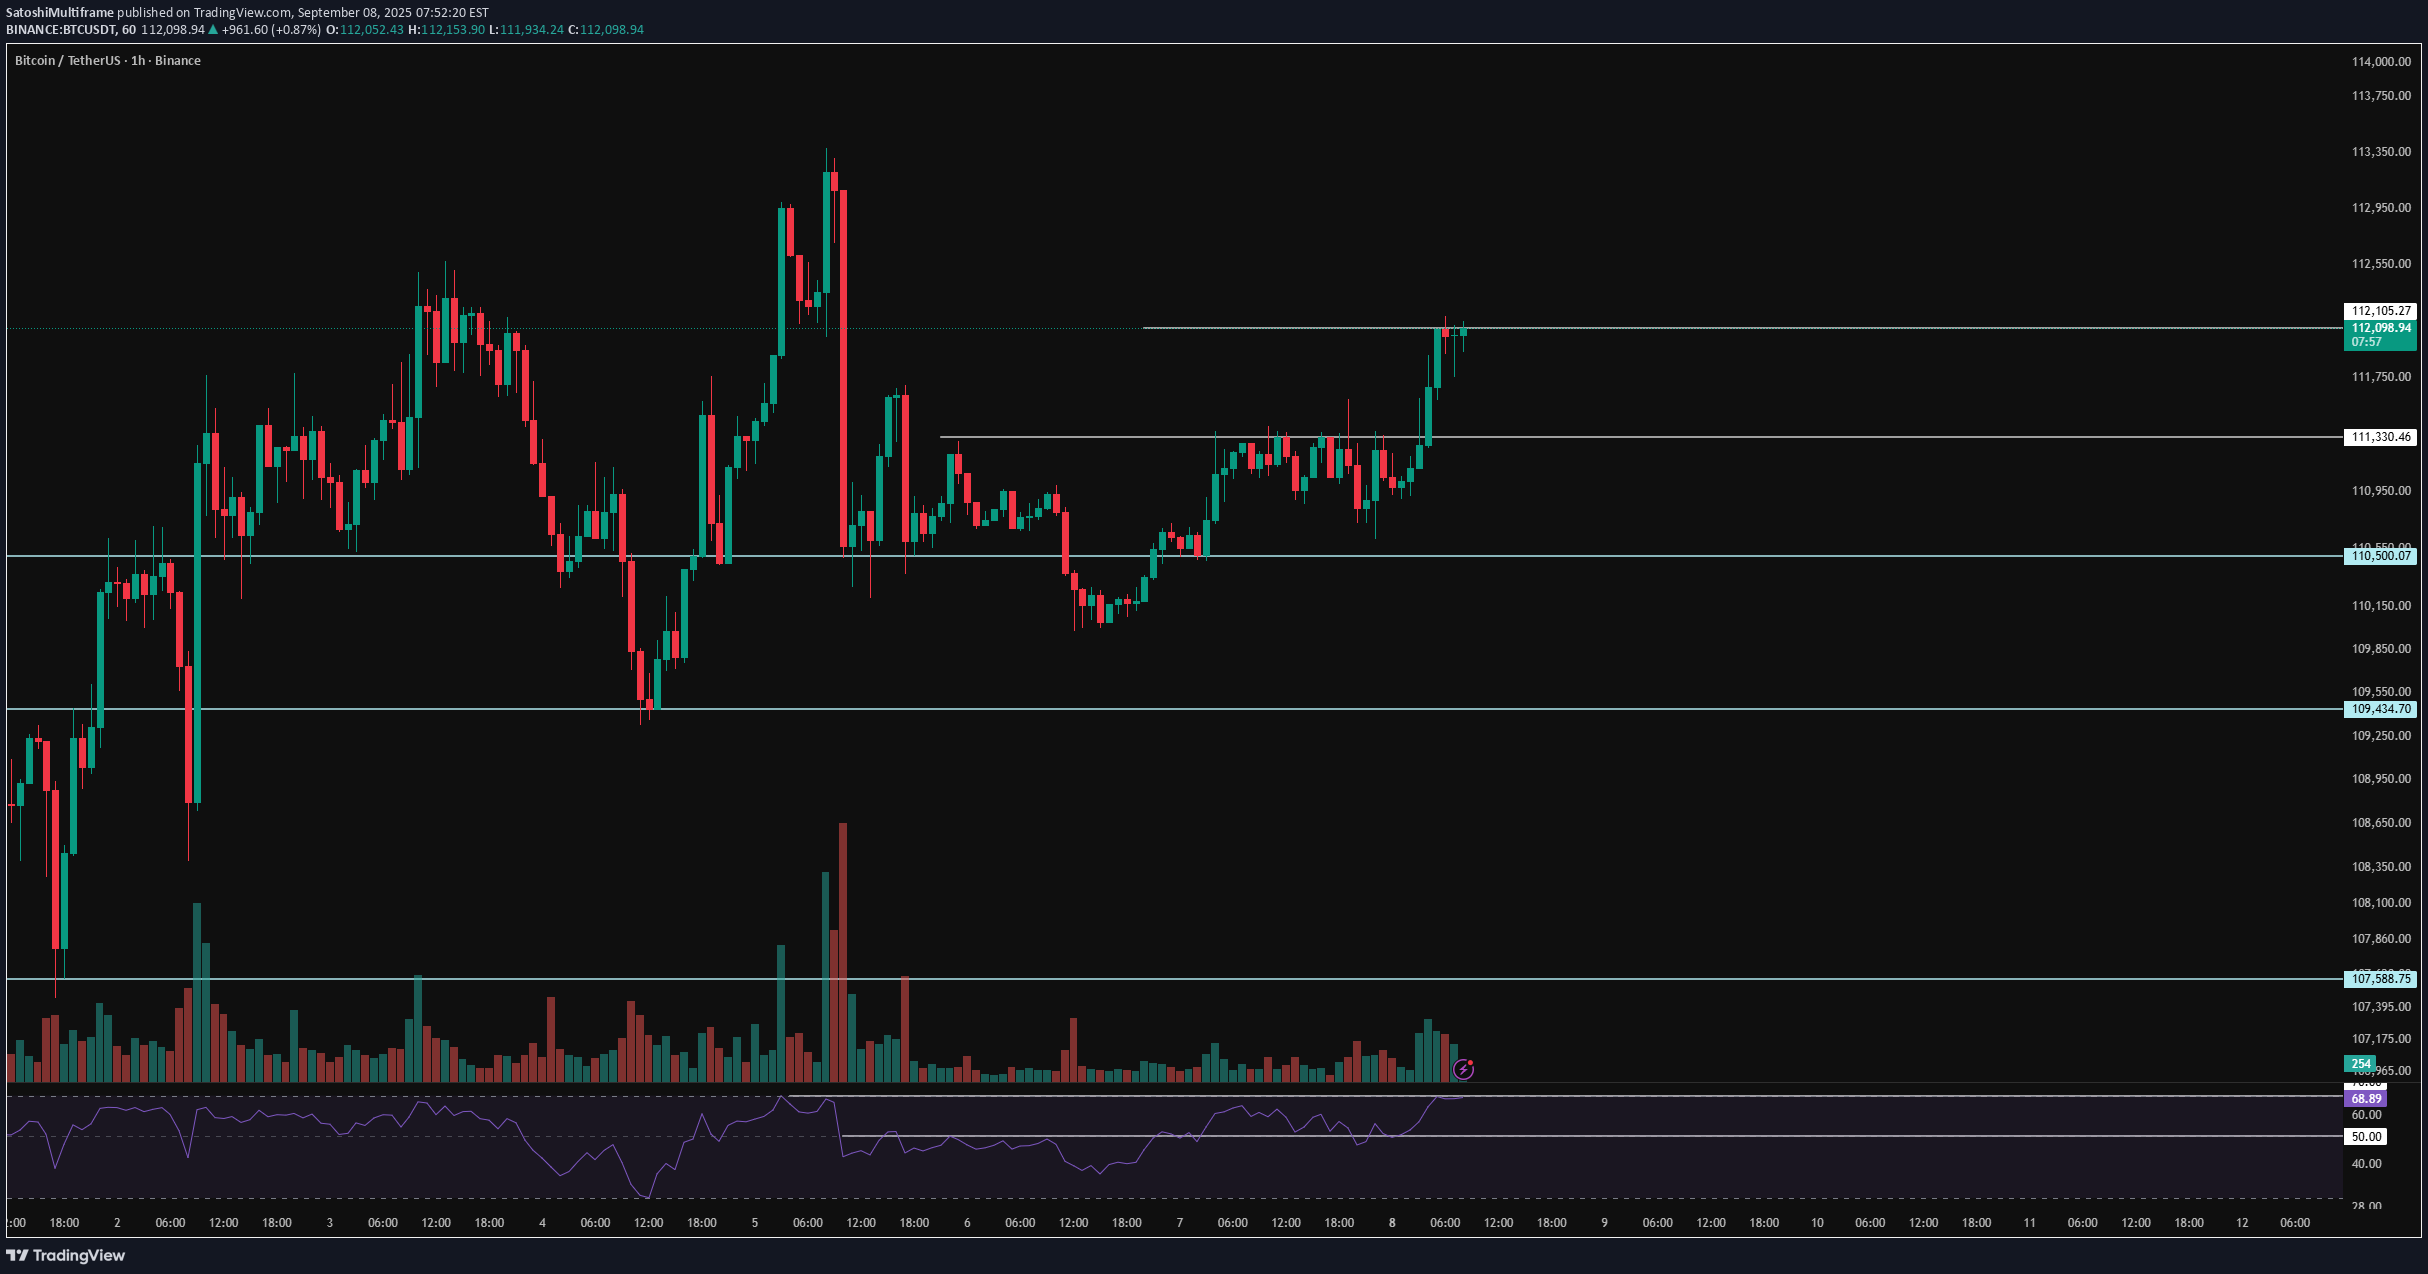
💀 Hey , how's it going ? Come over here — Satoshi got something for you! ⏰ We’re analyzing BTC on the 1-Hour timeframe. 👀 On the 1-hour timeframe for Bitcoin, we can see that BTC has successfully stabilized above the alarm zone at $111,300 and is now sitting right below the resistance at $112,105. With stronger volume and volatility, this setup could give us a long trade opportunity. ⚙️ Key RSI oscillator levels are at 70 and 50. If price action pushes RSI beyond these levels, Bitcoin can continue its current bullish move and sustain the trend. At the moment, RSI is sitting just below the Overbought threshold, and once it enters this zone, the identified resistance could be broken more easily. 🕯 With the start of the new week, buying volume has increased, and the weekly candle closed fairly strong. On the 1-hour chart, the size, volume, and number of green candles are all rising. 📊 Looking at the 15-minute timeframe of Tether dominance (USDT.D), after breaking and stabilizing below 4.45%, dominance continues to move lower. The next support lies at 4.41%, and if this is broken and confirmed, Bitcoin could see even stronger upside momentum early in the week. 🔔 Currently, Bitcoin is sitting just below its resistance. The best approach is to wait for a pullback, either below or above this level, and then open a position with a setup candle confirmation or a multi-timeframe breakout. Two possible scenarios exist here, where a pullback could also give us a tighter stop-loss opportunity. ❤️ Disclaimer : This analysis is purely based on my personal opinion and I only trade if the stated triggers are activated .
