
SatoshiMultiframe
@t_SatoshiMultiframe

What symbols does the trader recommend buying?
Purchase History
پیام های تریدر
Filter
SatoshiMultiframe
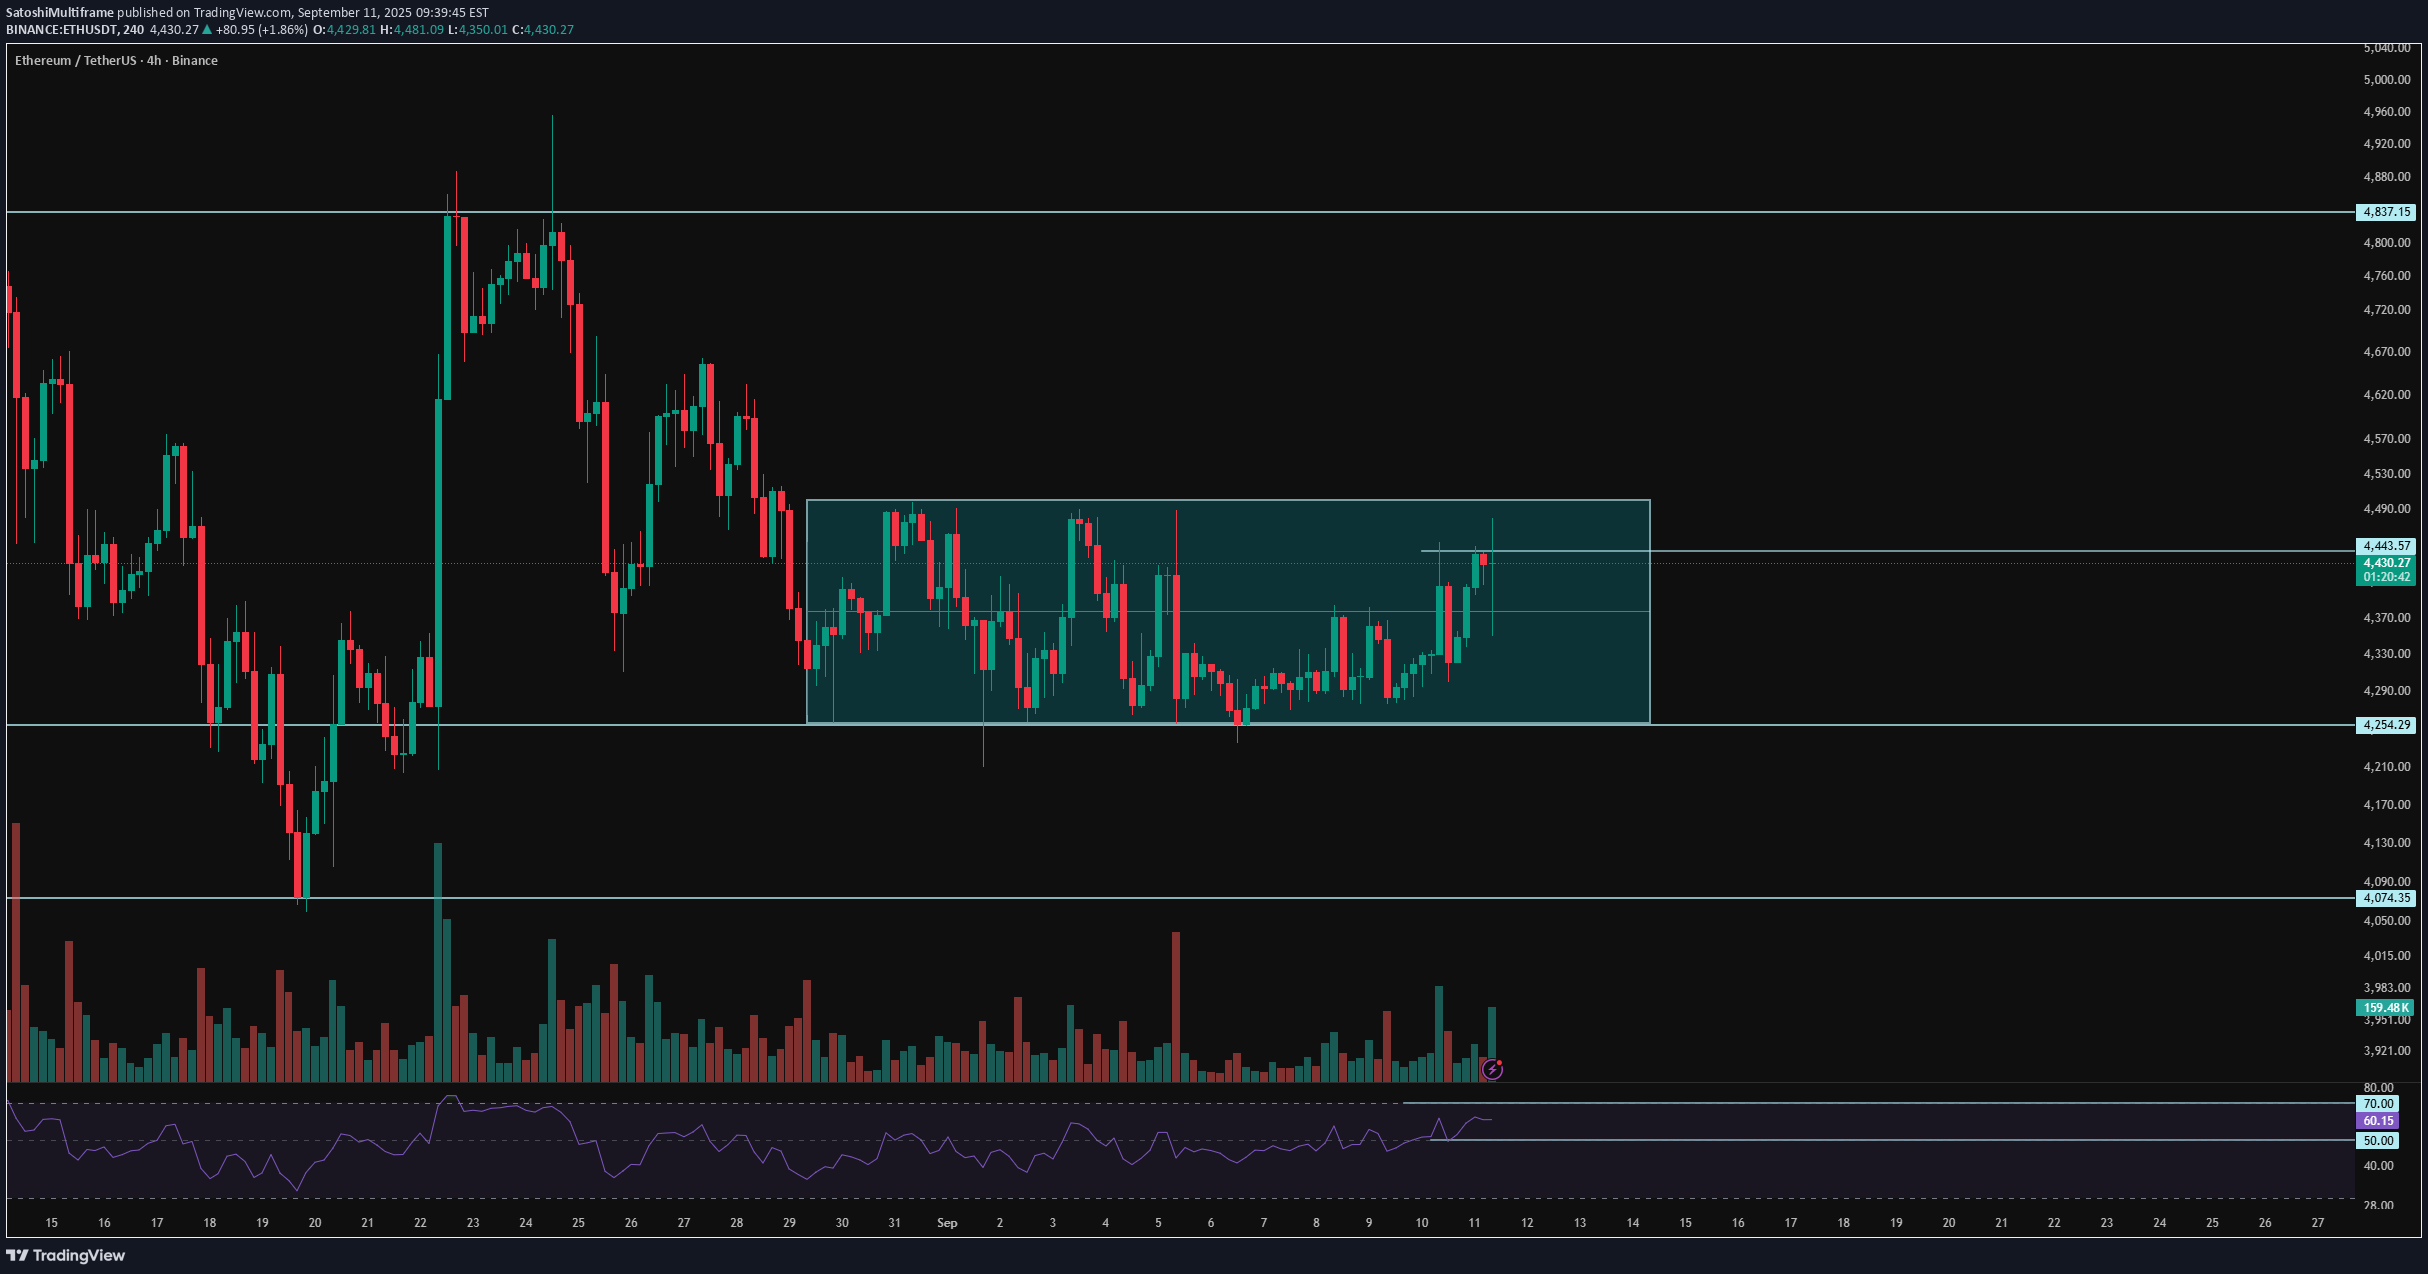
😃 Hey , how's it going ? Come over here — Satoshi got something for you! ⏰ We’re analyzing ETH on the 4-Hour timeframe. 🔭 ETH 4H Chart: Observing Ethereum on the 4-hour timeframe, after breaking the midline of the box, ETH closed above the box. Then, following the news, it formed a shadow that hit the lower box level, triggering a series of buy orders. Now, we’re watching to see if ETH will continue upward. The overall trend behind ETH is still bullish, and a breakout above the multi-timeframe range could push it toward the box’s top again. ⛏ Key RSI Levels: ETH’s RSI is around 70 and 50. A breach of these levels could signal the start of a move, especially following today’s inflation news impact. 💰 Candle Size & Volume: Green candle sizes and volume have increased. Yesterday, $164M of ETH was bought via ETFs, which is notable. 🪙 ETHBTC 4H Chart: Observing the ETH/BTC pair on the 4-hour timeframe, this pair tends to act slightly more precisely compared to ETH/USDT. Currently, it’s trading within a box with declining volume. News caused a reaction at the top of the box. If the box’s top breaks, a significant amount of BTC could convert into ETH, potentially pumping the ETH/USDT pair as well. 🔔 Entry & Target Zones: A potential early entry is around $4443, with the box top at $4500 — a strong resistance. If ETH breaks this level, it could aim for a new ATH. Make sure to confirm across multiple timeframes before taking a position. ❤️ Disclaimer : This analysis is purely based on my personal opinion and I only trade if the stated triggers are activated .
SatoshiMultiframe
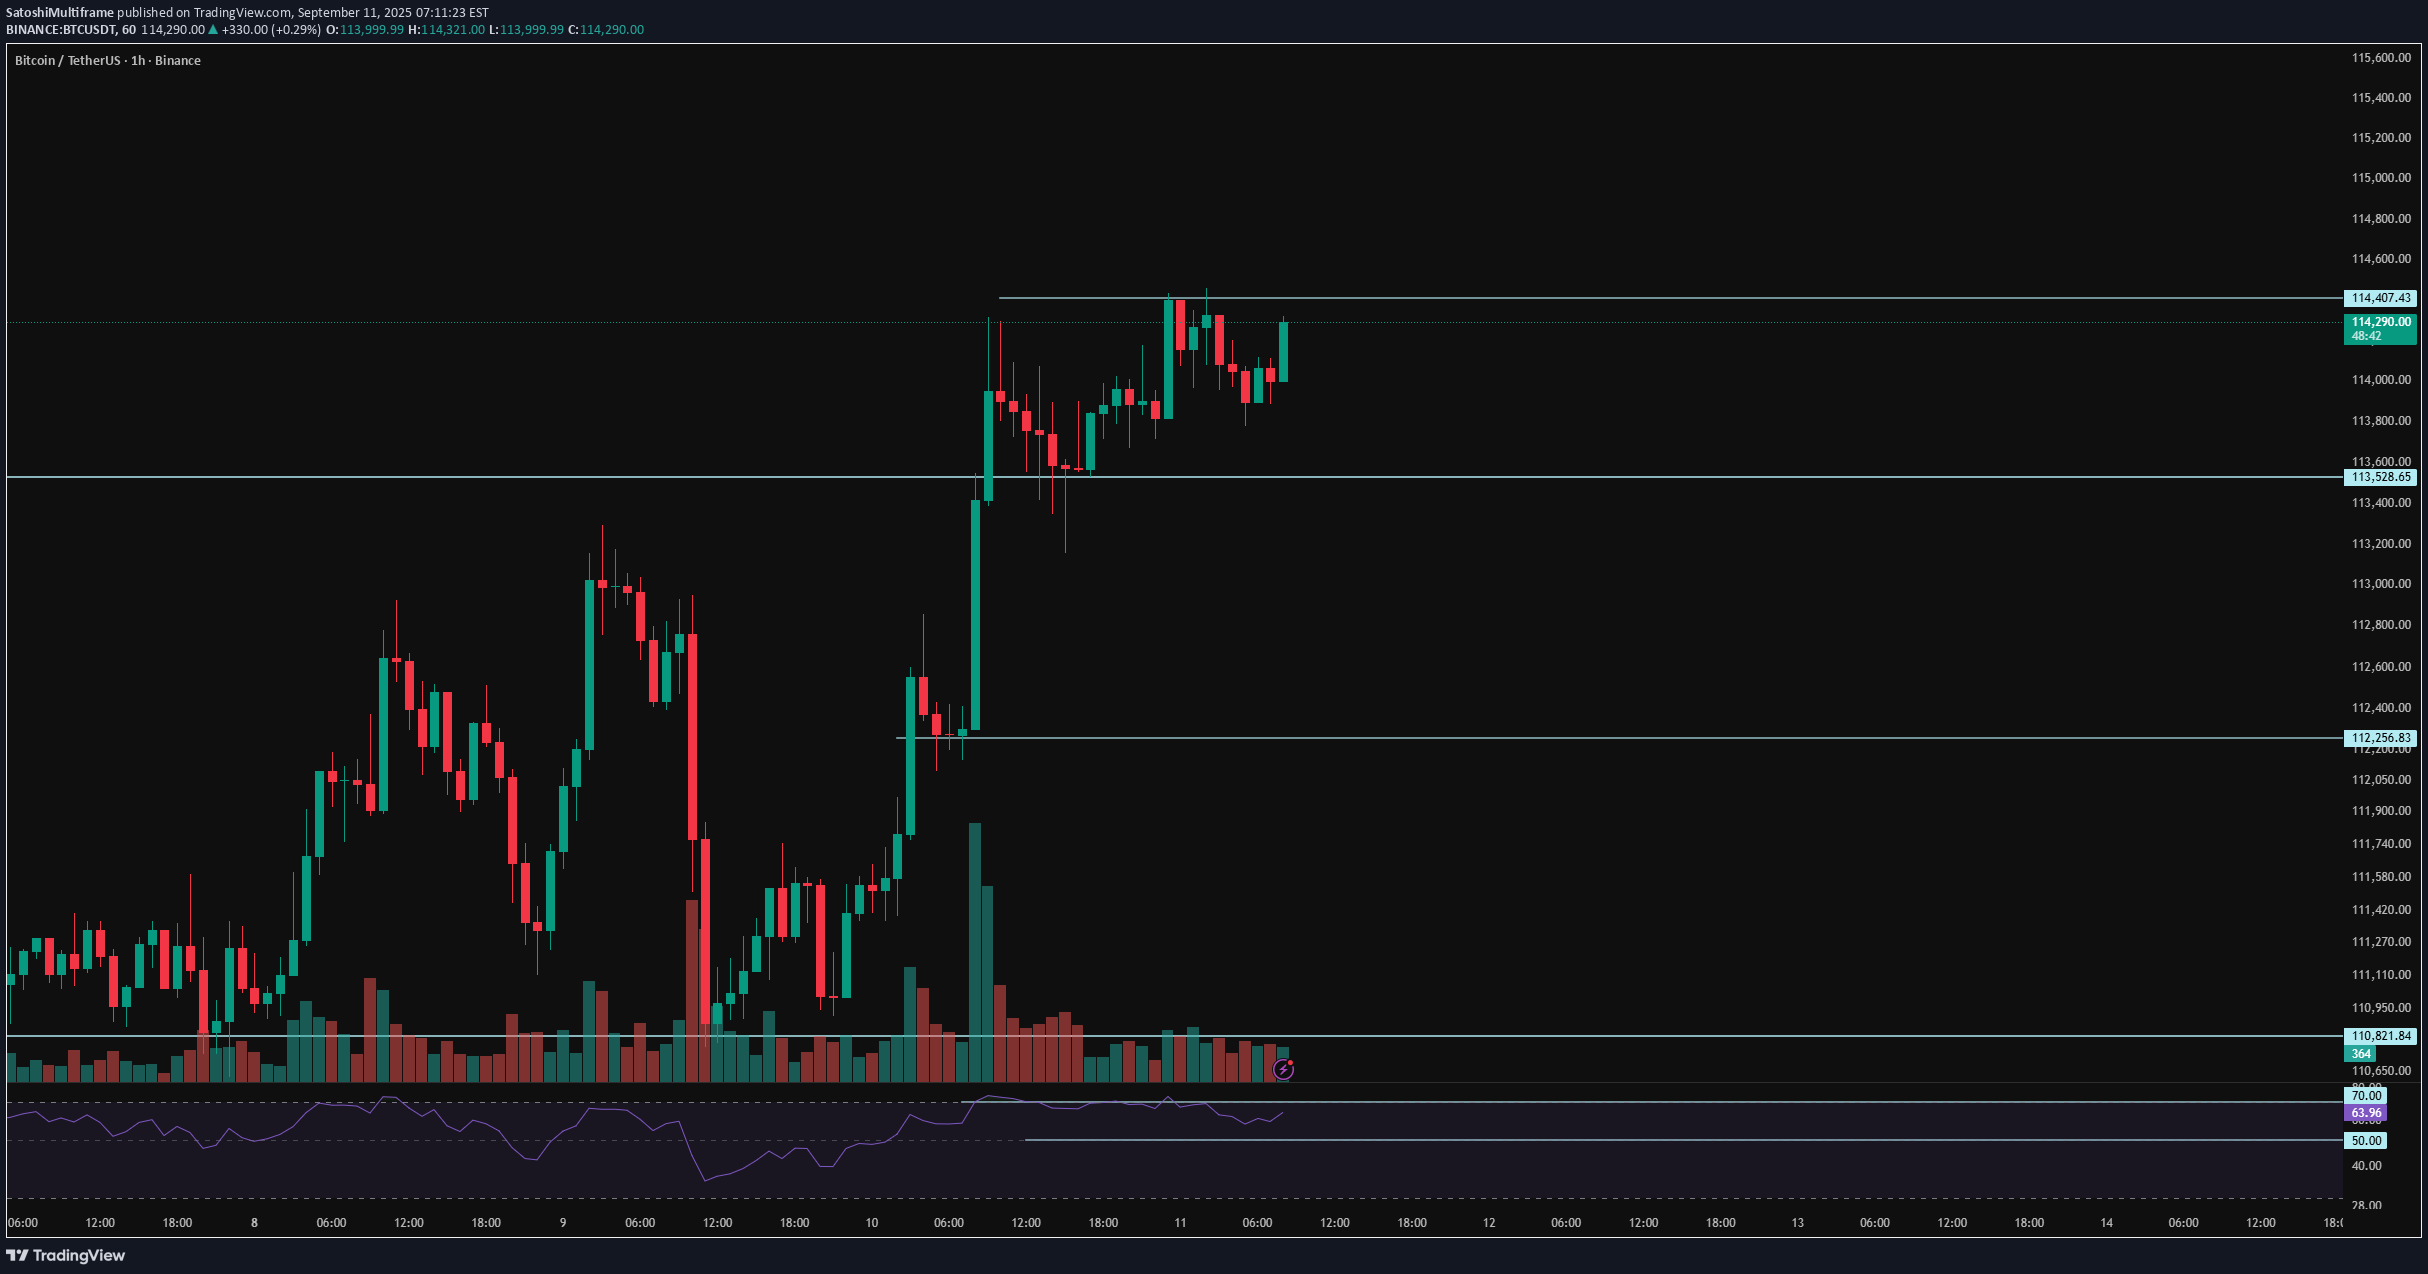
😃 Hey , how's it going ? Come over here — Satoshi got something for you! ⏰ We’re analyzing BTC on the 1-Hour timeframe. 👀 On the 1H timeframe for Bitcoin, we can see that BTC has been ranging since yesterday’s news. A breakout and confirmation above the range high or below the range low will give us a trading setup. The key levels are $114,407 on the upside and $113,528 on the downside. Today’s hot topic is the US CPI inflation data, which is a high-impact event at the very top tier of importance. ⚙️ On the RSI, Bitcoin is moving between the 50–70 zone. A breakout beyond these values, in alignment with a price breakout, could generate strong trade entries. 🕯 Candle structure shows that green candles are getting larger with more volume, while red candles are more frequent but smaller each time—so much that the market is starting to ignore them. The range high is very critical; it could break with a whale candle or even an indecision candle right before the move. Order type matters here—whether you use a trigger order or market entry on candle open will impact the trade. 📊 On the 1H Tether dominance, we’re also seeing a range—opposite in behavior to Bitcoin—with a range high at 4.37% and low at 4.32%. With BTC’s underlying trend on the 1H still bearish, there’s a decent probability of a downside break in USDT dominance while BTC breaks the upside of its range. 📊 On the 1H BTC.D , after a strong leg down, BTC.D has dropped below the 0.618 retracement level of its previous range and failed to hold support. We might see a small bounce/retest of that area, but unless today’s CPI causes major volatility, the broader expectation remains further downside in dominance. 🔔 The CPI report could bring serious volatility today. Yesterday’s news triggered nearly $750M worth of Bitcoin buys, sparking a strong rally with only minimal compression-style pullbacks. If today’s inflation data triggers a breakout above $114,407, and we see dominance dropping at the same time, large-cap projects are likely to pump even harder than Bitcoin itself. ❤️ Disclaimer : This analysis is purely based on my personal opinion and I only trade if the stated triggers are activated .
SatoshiMultiframe
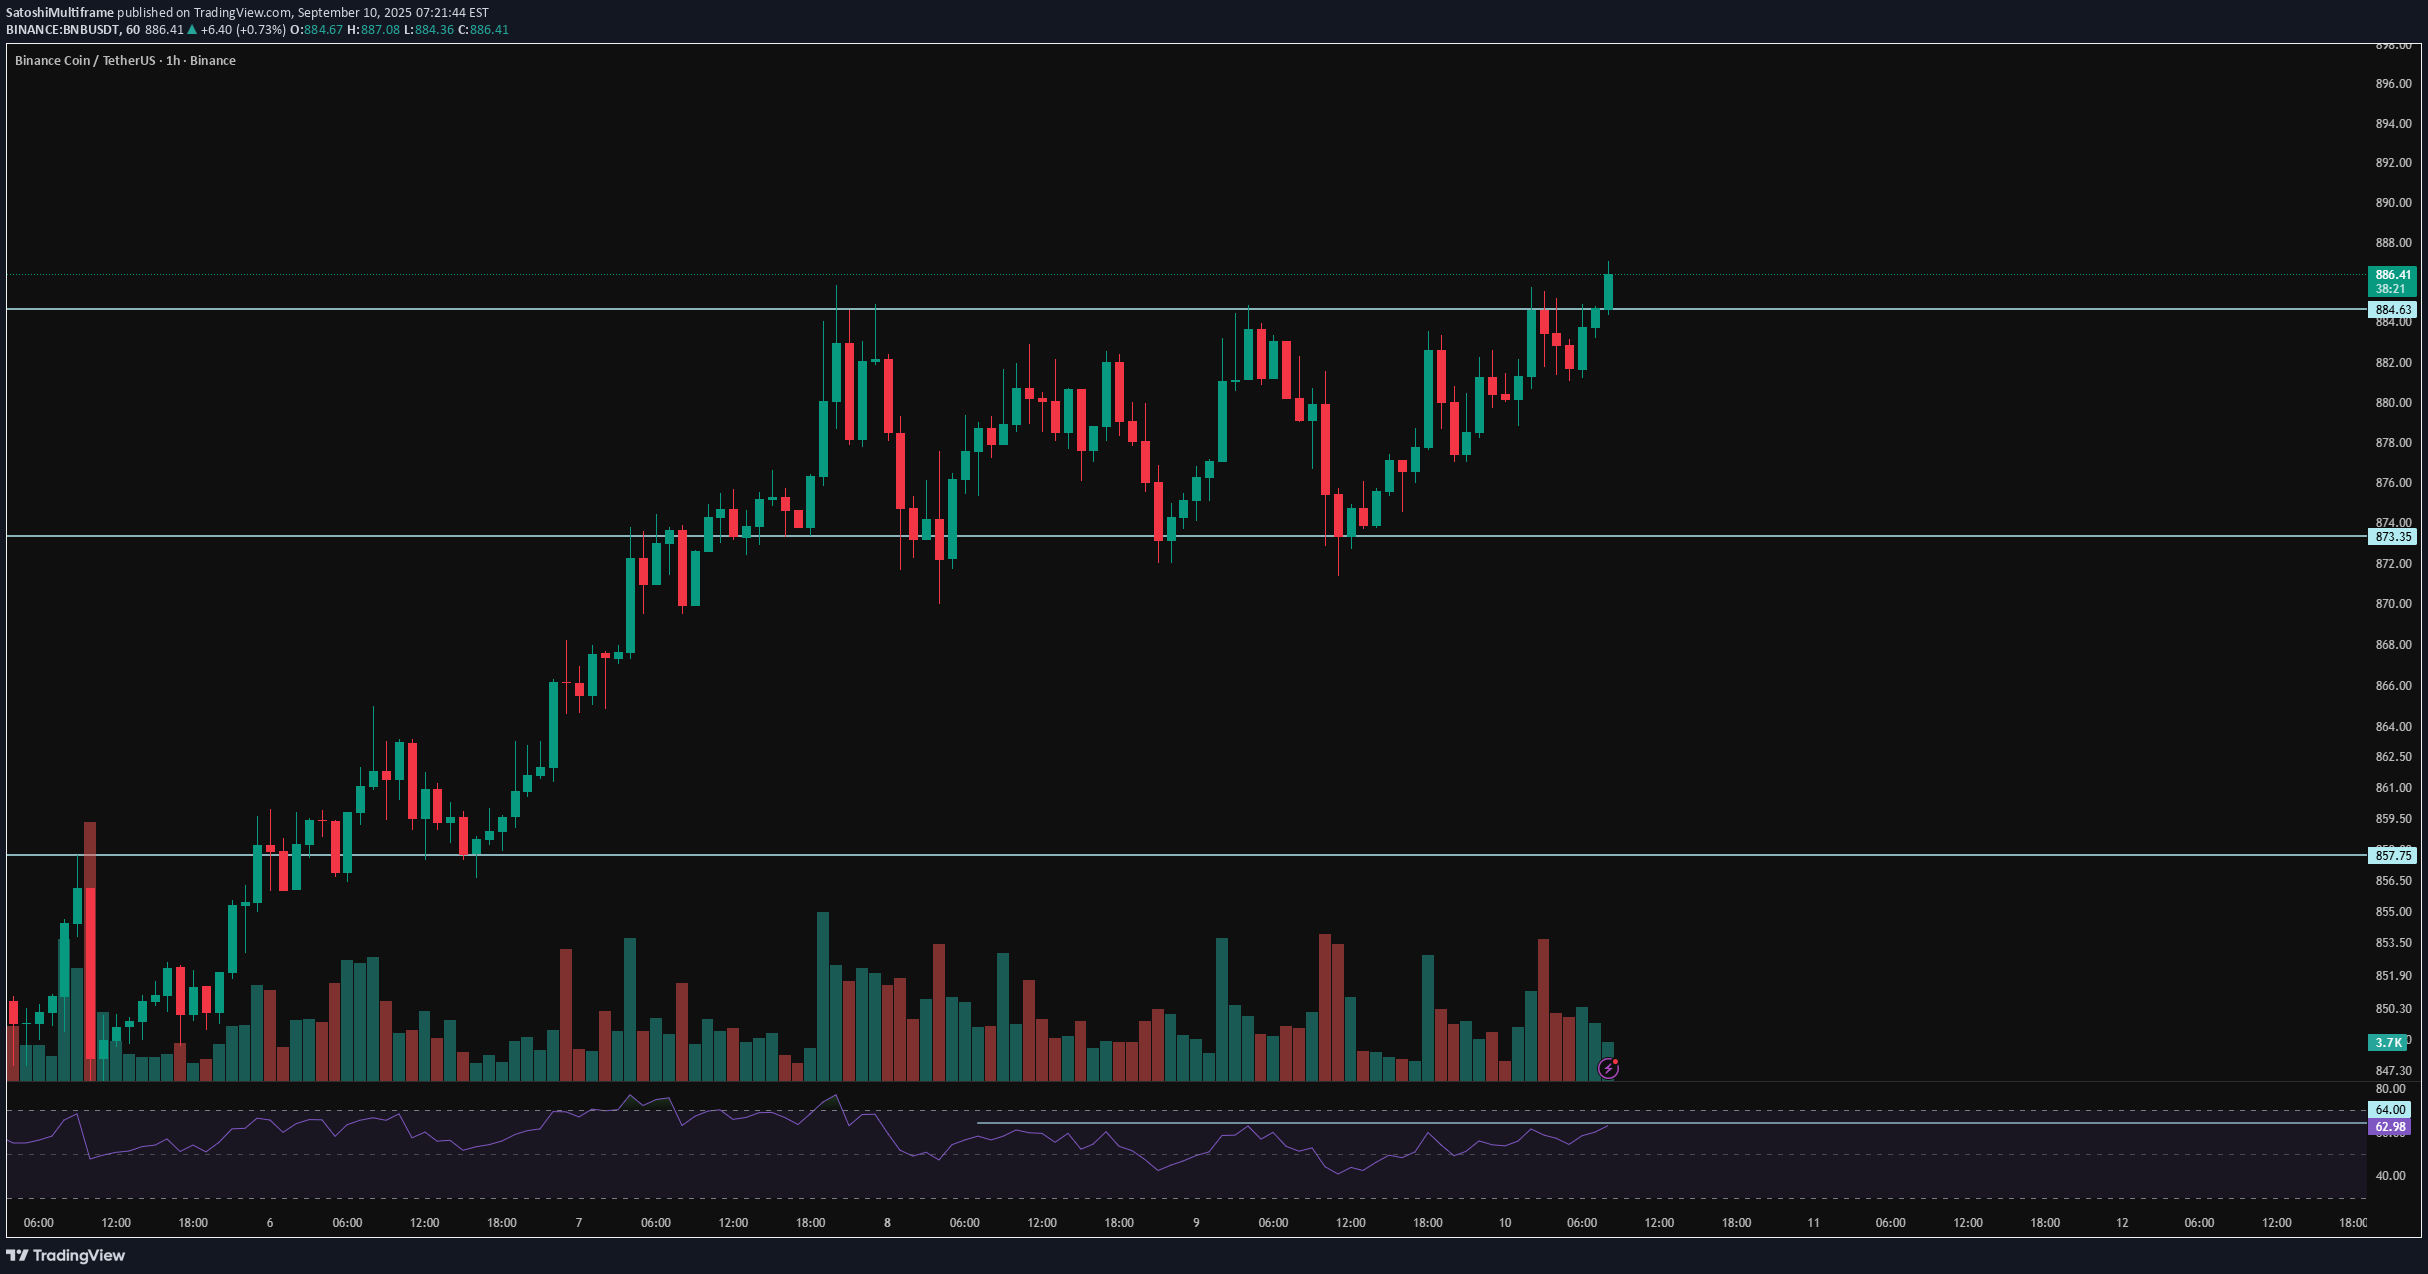
😃 Hey , how's it going ? Come over here — Satoshi got something for you! ⏰ We’re analyzing BNB on the 1-Hour timeframe. 👀 On the 1-hour timeframe of Binance Coin we can see that this coin, the popular token of Binance exchange with very strong backing, has formed a very important resistance at $885. With a breakout and confirmation above this level, and if the PPI news is positive, BNB could start another strong upward move. ⚙️ The key RSI level for this coin is at 64, and breaking above this level could give BNB higher volatility and even a price surge. 🕯 The volume, size, and number of green candles are increasing, and it seems we are almost exiting the range structure. With buying pressure and rising volatility, BNB could form more green candles and experience solid price growth. 🌒 On the 1-hour timeframe of the BNBBTC pair we can see that it has been rejected from the 0.007915 zone, which has created a trigger for a breakout at this level. If this zone is broken, BNB could also break its marked resistance in the USDT pair and move upward. 💡 This coin had resistance at $885, which has now been broken, and it is moving upward. A pullback to this resistance also happened during this breakout, which was executed well. For confirmation, you can also check the 15-minute timeframe. ❤️ Disclaimer : This analysis is purely based on my personal opinion and I only trade if the stated triggers are activated .
SatoshiMultiframe
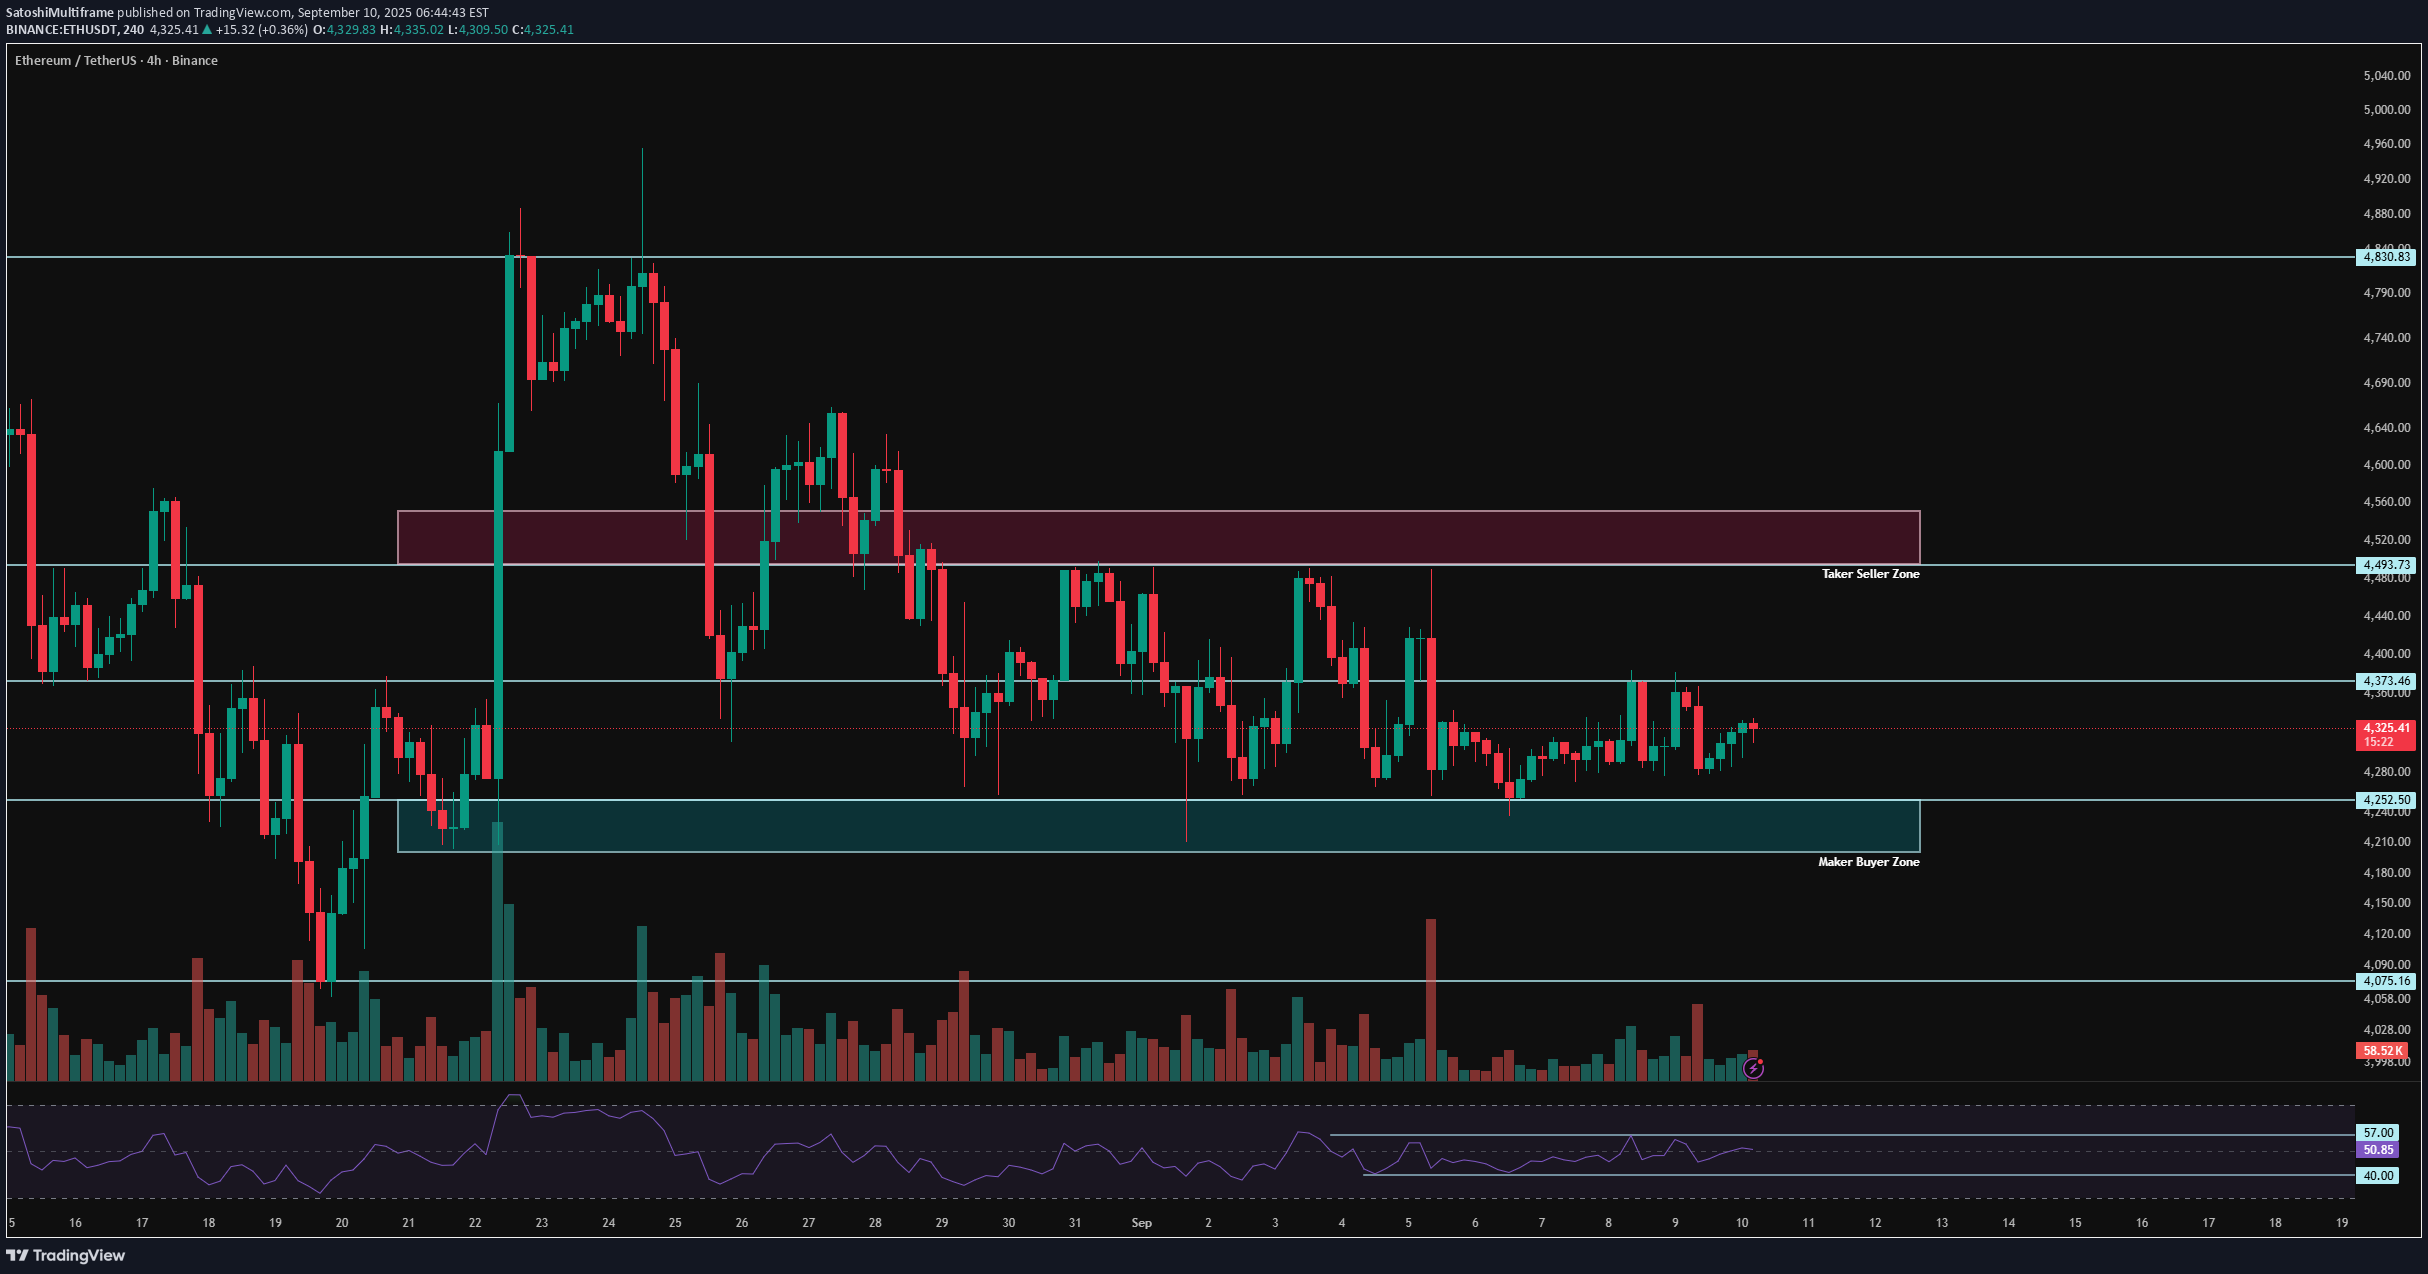
😃 Hey , how's it going ? Come over here — Satoshi got something for you! ⏰ We’re analyzing BTC on the 1-Hour timeframe. 🔭 On the 4-hour timeframe of Ethereum we can see that ETH is clearly in a very strong consolidation, and for several days even the oscillator has been ranging around the 50 zone. This time-based range will eventually come to an end. Ethereum now has two important levels ahead with the upcoming news: the top of the box midline at $4373, where breaking this zone could trigger a strong pump, and the bottom zone, which is a maker-buyer area at $4252, considered a very strong and important support for Ethereum. ⛏ The key RSI levels for Ethereum are at 57 and 40. If the range of oscillation crosses these levels, ETH could gain more volatility and even move toward its overbought or oversold regions. Usually, this type of short-term consolidation ends with a good price move once the compression is broken. 💰 The size, volume, and number of green candles have really decreased, and multiple candles inside the range have formed, creating a decision-making phase for ETH. With today’s PPI news, it is likely that one of these zones will either be touched or broken, and after this news, candles are expected to come with stronger volume. 🪙 On the 4-hour timeframe of the ETHBTC trading pair we can see that it is in a descending continuation channel. Each time the price has reached the top or bottom of this channel, it has reacted with a reversal and then moved in the opposite direction. Currently, ETHBTC is above its midline and has shown a positive reaction to it. The volatility of this pair has significantly decreased in recent days and is now ranging under its 50 zone. A breakout above the channel top and the 0.03893 level could start a bullish move. 💡 The zones we are considering for Ethereum’s top and bottom are $4493 and $4252. Breaking either of these levels after this multi-day consolidation could start a strong trend and even a sharp directional move! Keep in mind that war and economic news have created interconnections for risky markets—trade with low risk. ❤️ Disclaimer : This analysis is purely based on my personal opinion and I only trade if the stated triggers are activated .
SatoshiMultiframe
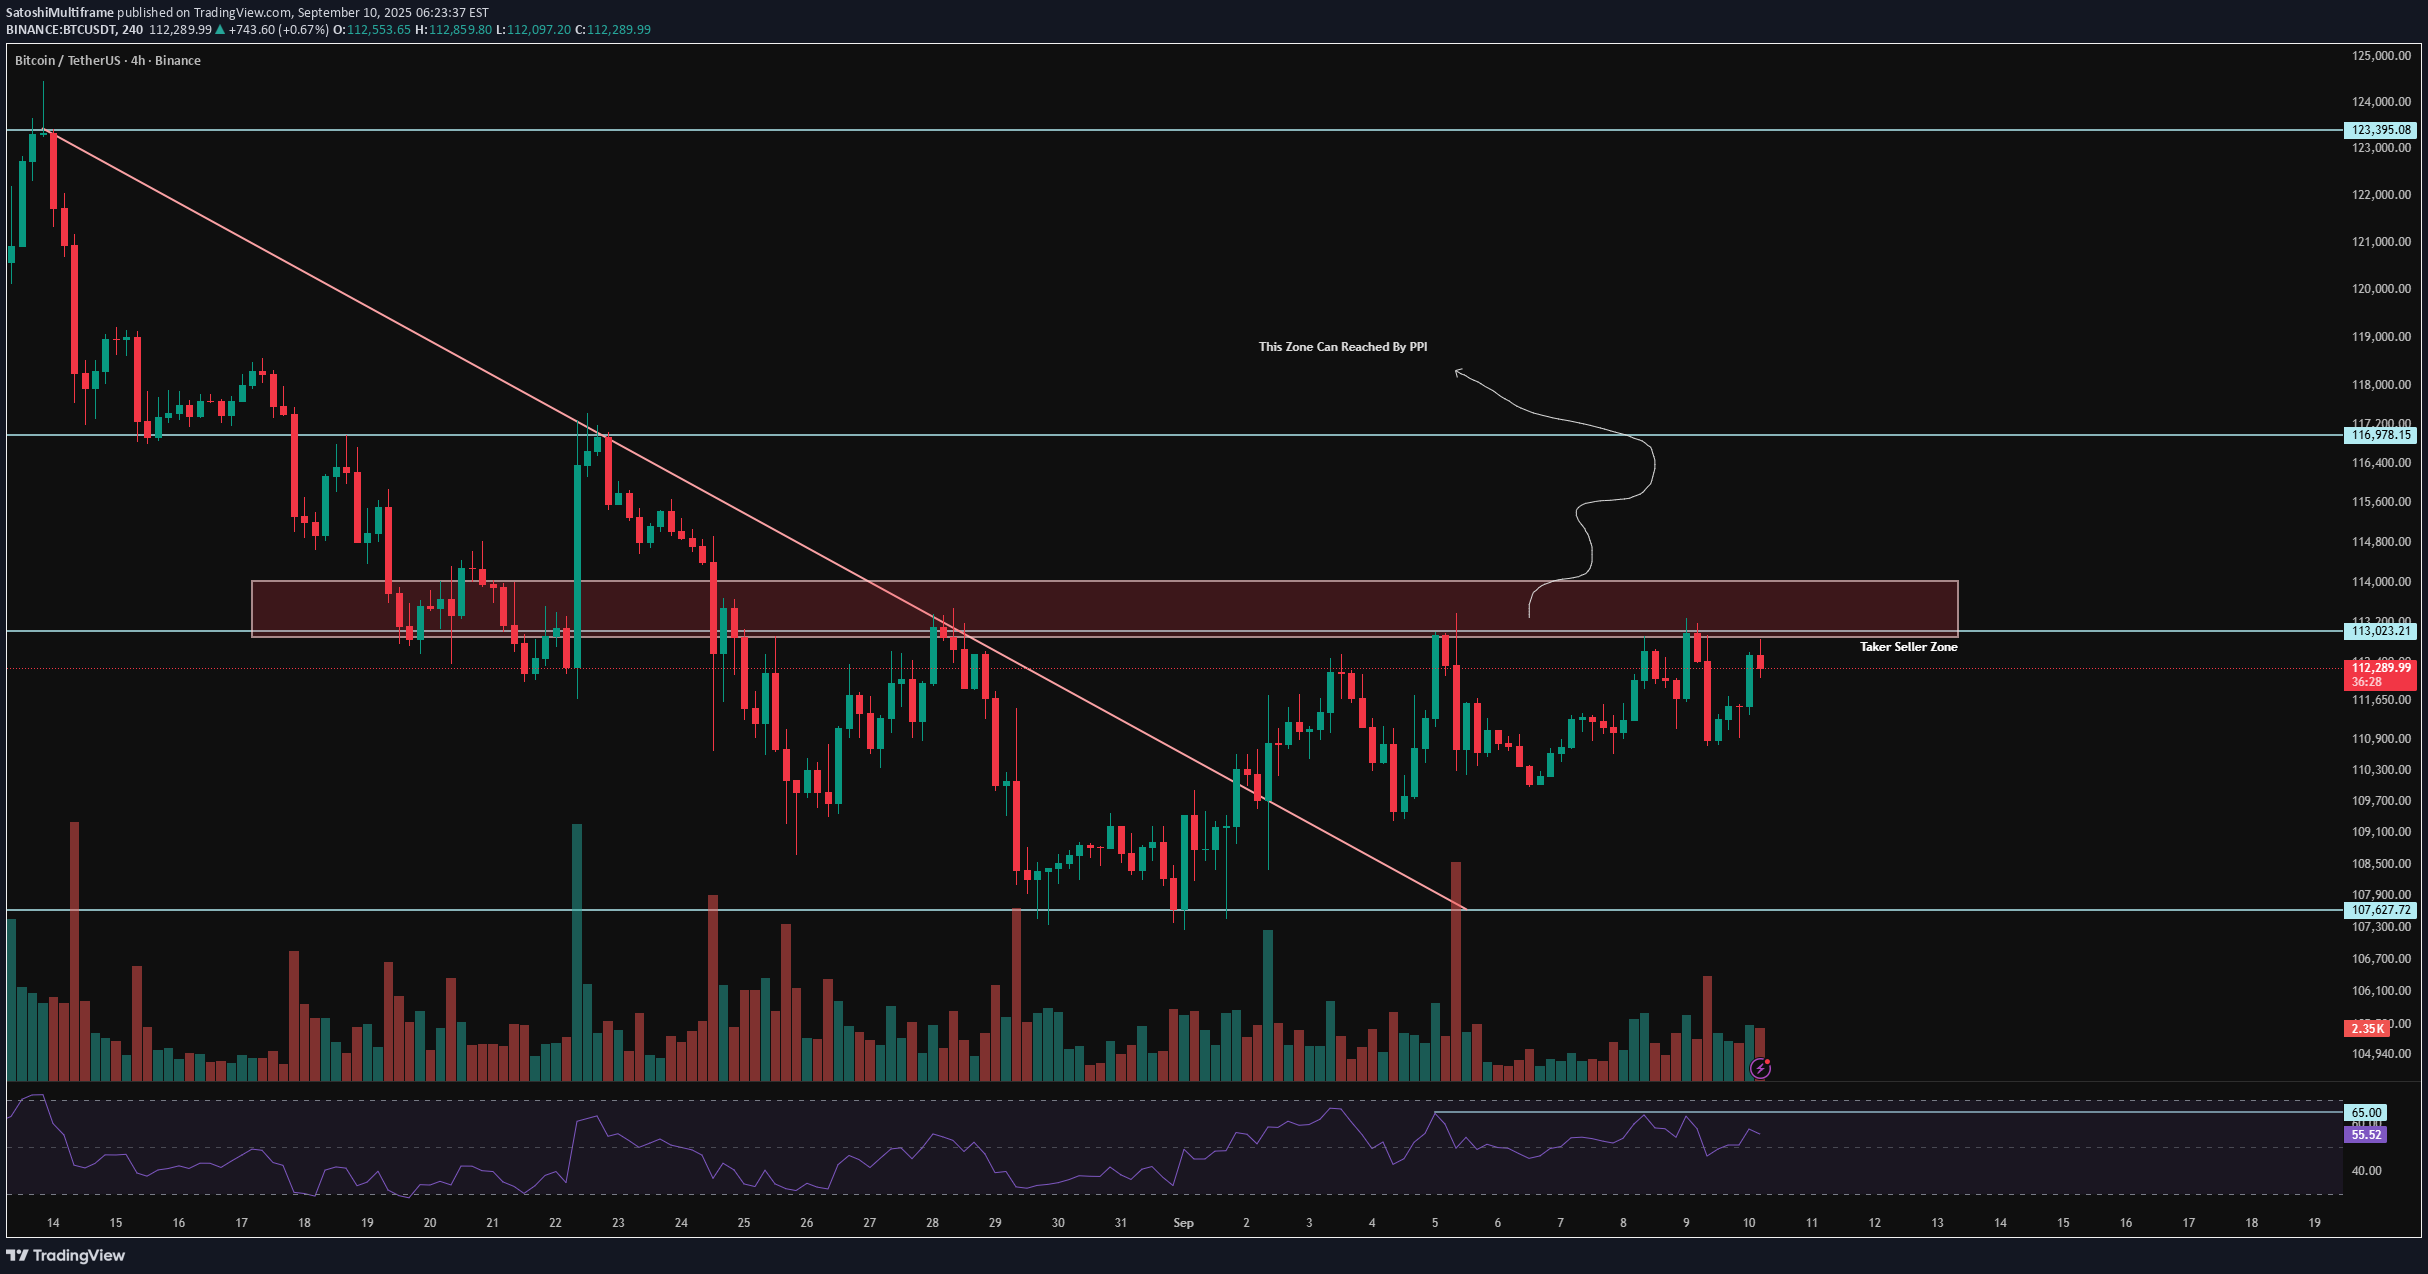
😃 Hey , how's it going ? Come over here — Satoshi got something for you! ⏰ We’re analyzing BTC on the 1-Hour timeframe. 👀 On the 4-hour timeframe of Bitcoin we can see that Bitcoin was under a descending trendline, and each time it touched this trendline it faced selling pressure. Bitcoin broke this trendline at the end of August, and since the beginning of September until now it has been ranging below the $113,000 resistance, where it has touched this level 3 times and then got rejected downward. Usually, these kinds of zones don’t break easily, and if they do, it is together with major global economic news. ⚙️ The key RSI zone of Bitcoin in the 4-hour timeframe is at 65. A swing scenario is considered for Bitcoin after the news, and if this news comes in favor of the risky market (crypto), it can move above the 65 range and even enter overbought territory. 🕯 The size, volume, and number of green candles have almost increased, while red candles are still accompanied by selling pressure. There is a taker-seller zone above, at the $113,000 resistance, that has kept the price down. With the release of news, a good wave of capital can enter or exit the market. 📊 On the 4-hour timeframe of USDT.D we can see that Tether dominance is in a very important support zone, and losing this support can bring good volume into the market. I think this support break can also happen with today’s PPI news. Tether dominance, like Bitcoin, was above a continuation ascending trendline, but now it has broken the trendline and is ranging below it. This shows us the importance of the news! 📊 On the 4-hour timeframe of BTC.D we can see that Bitcoin dominance is in a support zone, and with a 4-hour candle that looks like multiple profit-taking it got supported and moved upward. Although the move is small, we should pay attention. The resistance zone of Bitcoin dominance is at 58.36%, and the support zone is at 58.06%. Losing these zones can give altcoins very strong moves. 🔔 Bitcoin is now under an important resistance at $113,000. If this zone is broken, it can move upward again. A very strong support zone is also built by maker buyers at $107,627, which is quite far from the current price. For a long position, wait until the taker-seller zone is taken out with a whale candle and then enter on the pullback. Also pay attention that altcoins can give us the most profit during this period when both Bitcoin dominance and Tether dominance are dropping. ❤️ Disclaimer : This analysis is purely based on my personal opinion and I only trade if the stated triggers are activated .
SatoshiMultiframe
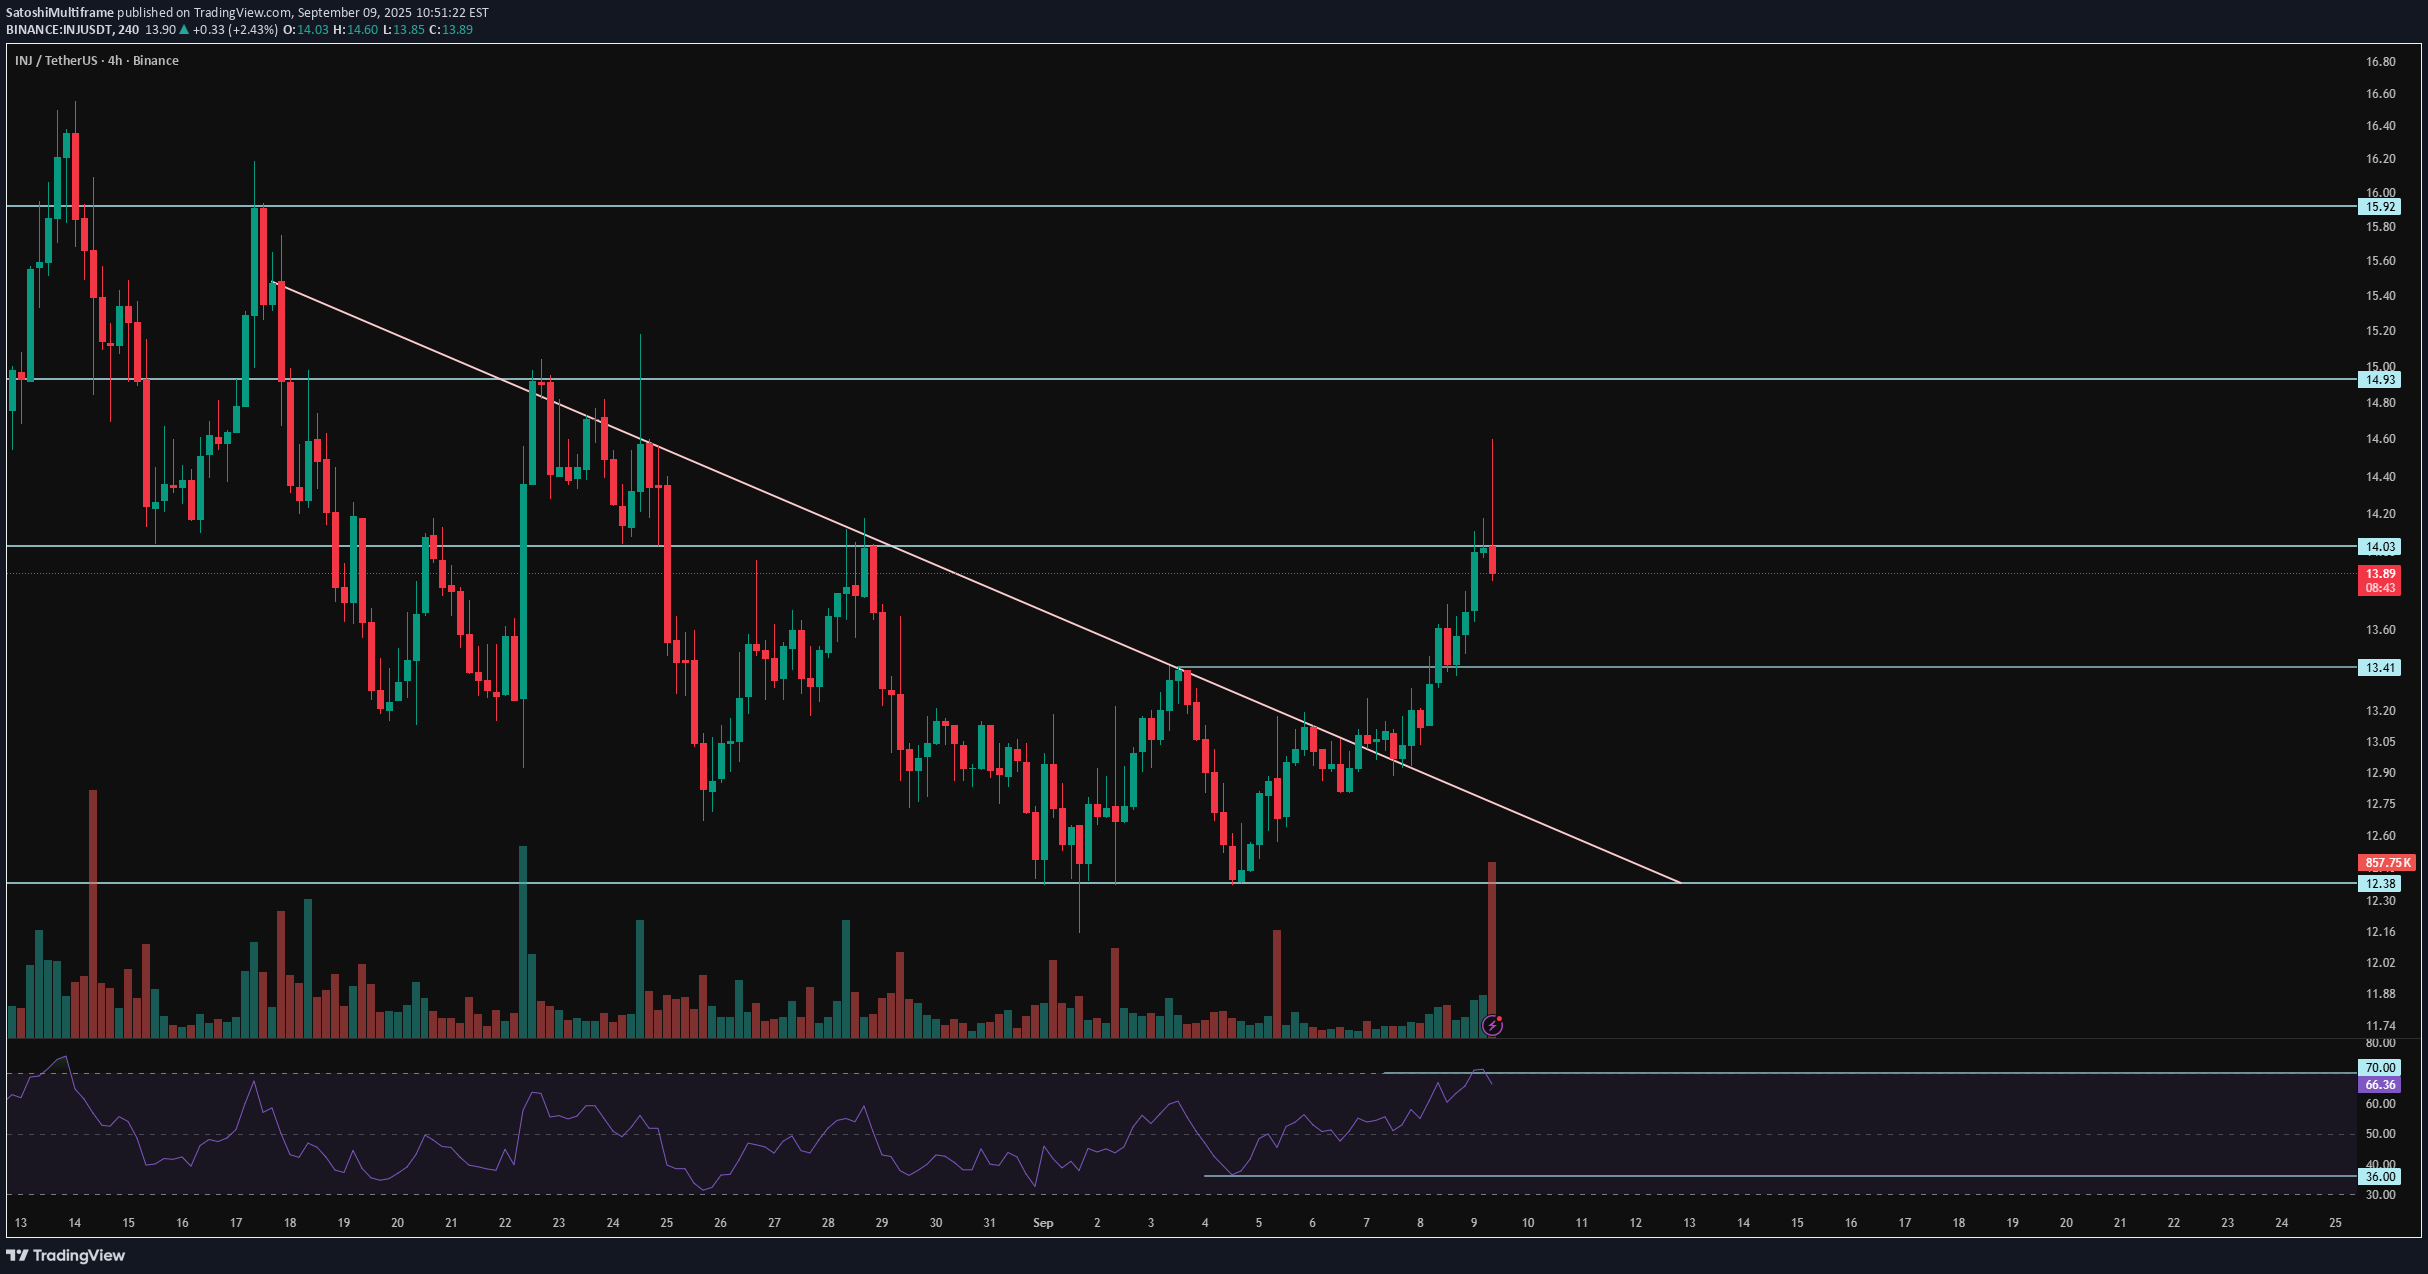
💀 Hey , how's it going ? Come over here — Satoshi got something for you ! ⏰ We’re analyzing MKR on the 1-Day timeframe timeframe . 👀 4H timeframe on Injective (INJ) – After breaking its downtrend line, INJ moved toward the $13.41 resistance, broke through it successfully, and is now sitting just below the $14 resistance zone. A clean breakout and confirmation above $14 could open the way toward the next resistance at $16, which also acts as a strong trigger level. ⚙️ On the RSI, the key zones to watch are 50 and 70. If momentum pushes above these levels, INJ could start a new upward leg. 🕯 Green candles are showing increased size and volume. At $14, we’ve seen a cluster of sell orders triggered – profit-taking, shorts, and spot sells. Once this selling pressure is absorbed and order books clear out, INJ has a good chance to stabilize above $14, which is a very critical level to monitor. 💰 On the INJ/BTC 4H chart, the pair also broke its trendline and resistance, now waiting for confirmation above that level. Buying volume has been strong – whales are showing preference for INJ over BTC. RSI is currently around 72+, reflecting heavy trading activity and strong momentum. 📊 Looking at the Bitcoin dominance 4H chart, after losing its support at 58.36%, dominance is moving lower toward the next support at 57.81%. 🔔 In short: $14 is the key resistance for Injective. Wait for a confirmed breakout, stabilization above it, and ideally a pullback retest before entering with a reasonable risk-to-reward setup. ❤️ Disclaimer : This analysis is purely based on my personal opinion and I only trade if the stated triggers are activated .
SatoshiMultiframe
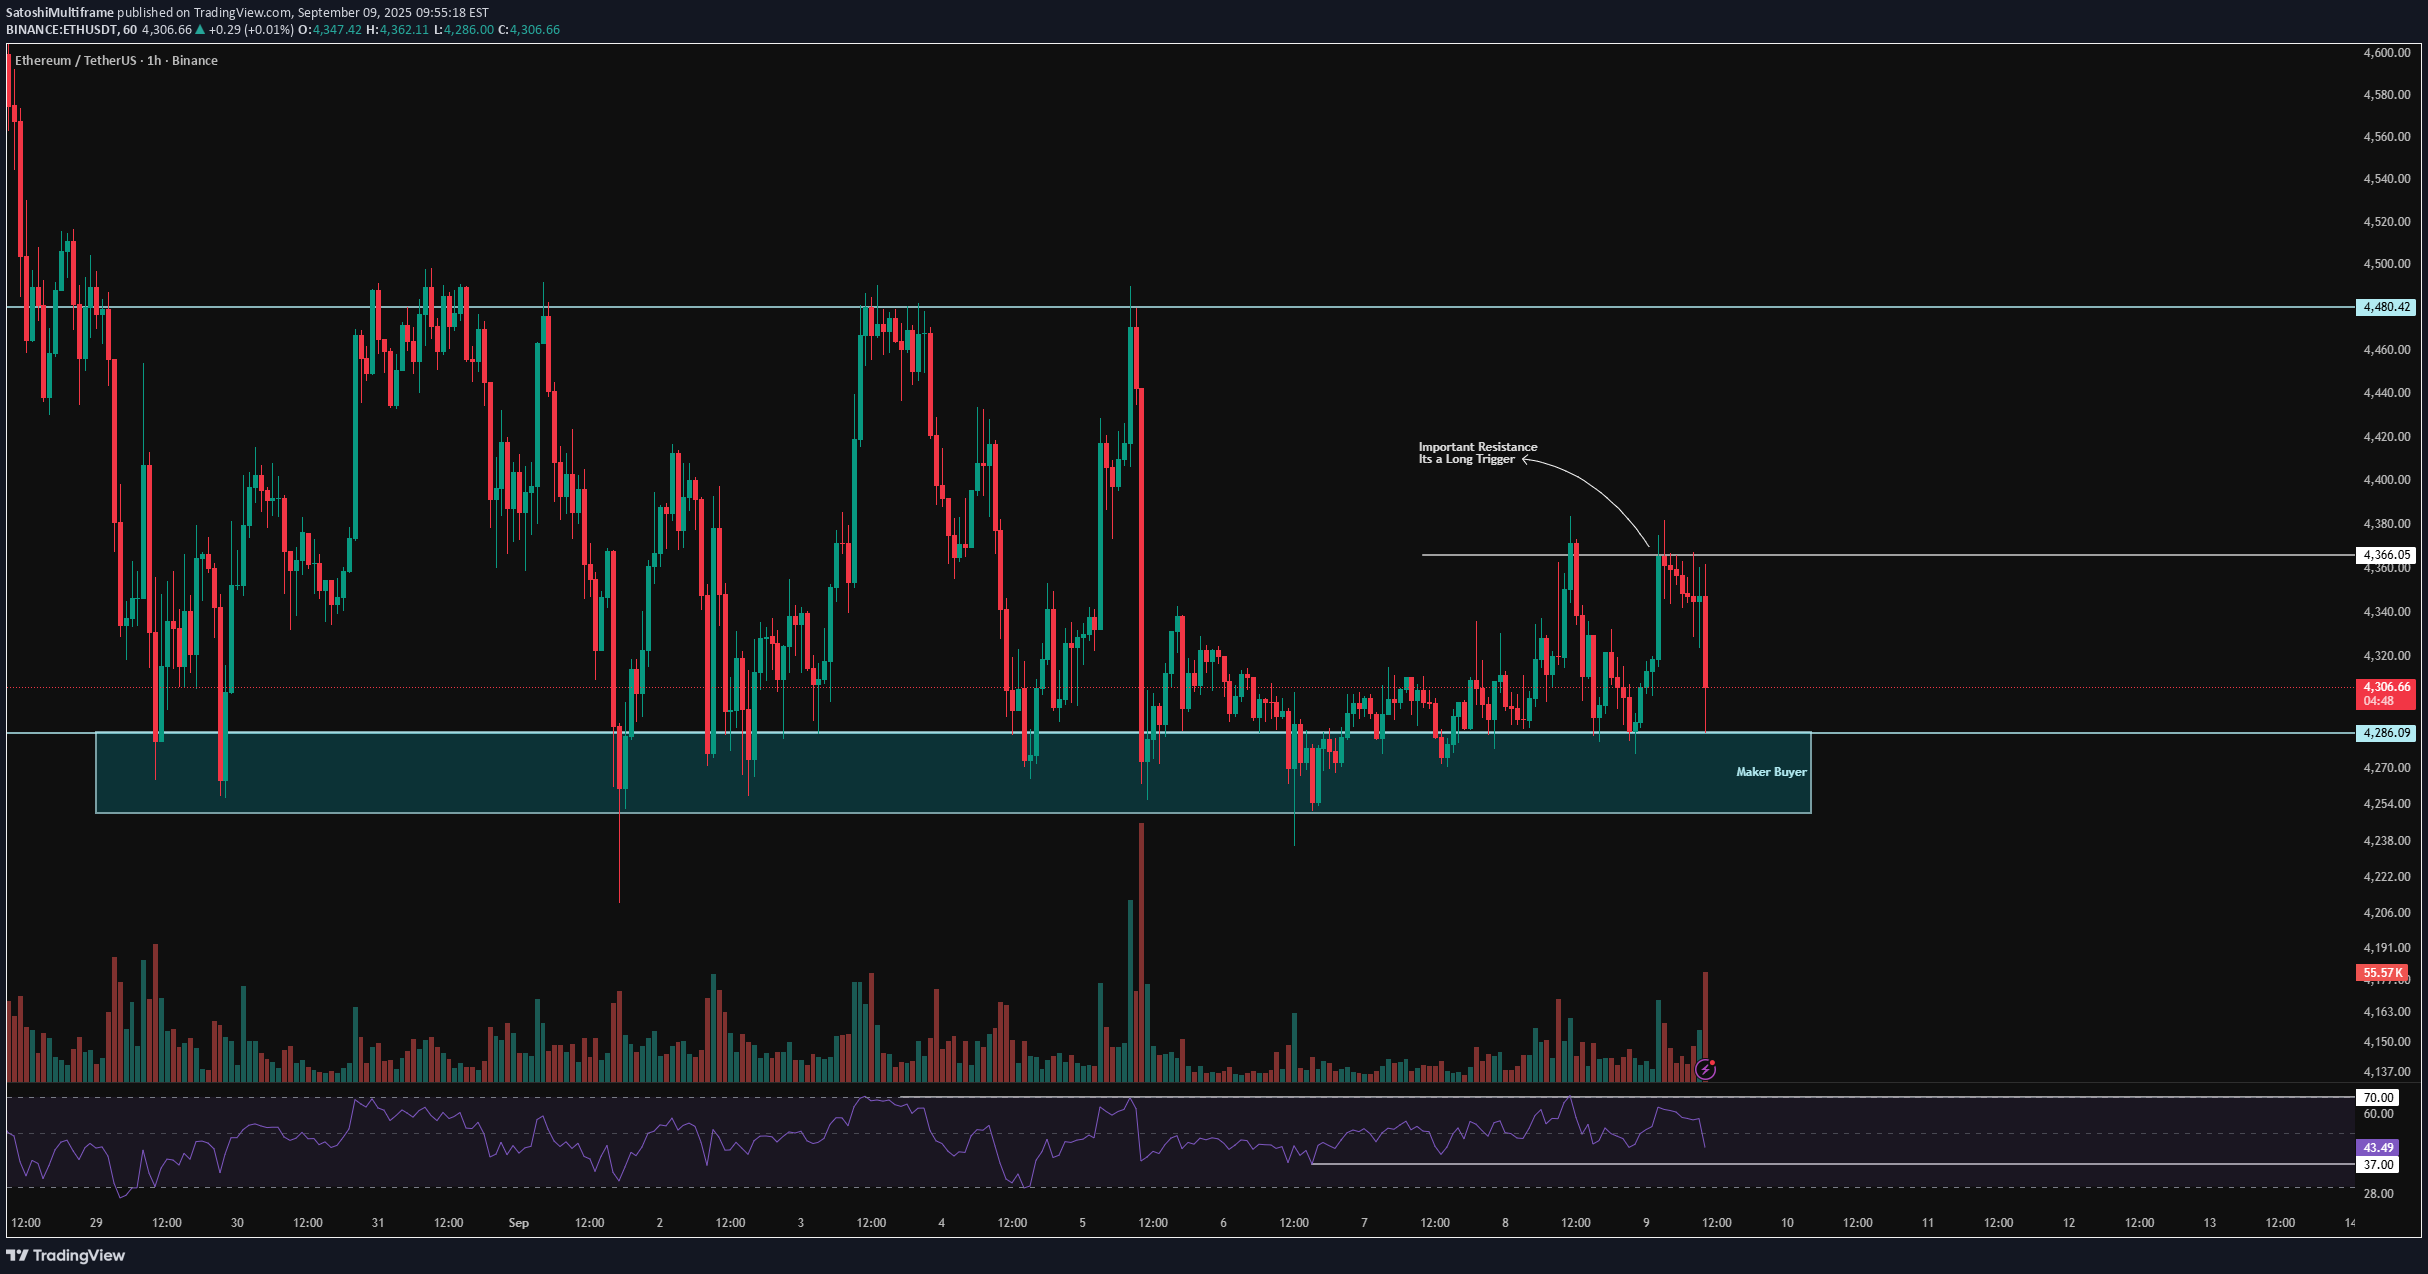
💀 Hey , how's it going ? Come over here — Satoshi got something for you! ⏰ We’re analyzing BTC on the 1-Hour timeframe. 🔭 On the 1H timeframe for Ethereum (ETH), price rejected strongly from the 4336$ resistance and started moving lower. ETH is now trading close to its support zone at 4286$, having recently broken out of a consolidation range. ⛏ On the RSI, the key levels are 70 and 37. A move beyond these zones could trigger momentum toward either overbought or oversold conditions. Keep in mind that volatility is still closely tied to macroeconomic news. 💰 Candle structure shows increasing red candle size and volume, signaling stronger selling pressure. With ETH being heavily involved in both futures contracts and DeFi markets, much of this move reflects profit-taking and sell pressure at higher levels. 🪙 Looking at the ETHBTC pair on the 1H, the chart shows a steady downtrend within a compression zone. If ETH loses its current support, the pair could extend further down. The volatility index for this pair is sitting at 45.52, below the 50 zone, and with short positions picking up, ETH could face additional sell pressure. 💡 The current zone ETH is trading in looks like a maker-buy area, but likely to be broken by whale candles. For short positions : The better setup would be to wait for a whale candle break, then enter on the pullback for higher win rate. For long positions : A clean breakout above 4336$ would allow for an order stop-buy entry or a pullback + candlestick confirmation setup to get in long. ⚠️ Note: Today looks like a high-impact day with global shifts in play—trade with reduced risk. ❤️ Disclaimer : This analysis is purely based on my personal opinion and I only trade if the stated triggers are activated.
SatoshiMultiframe
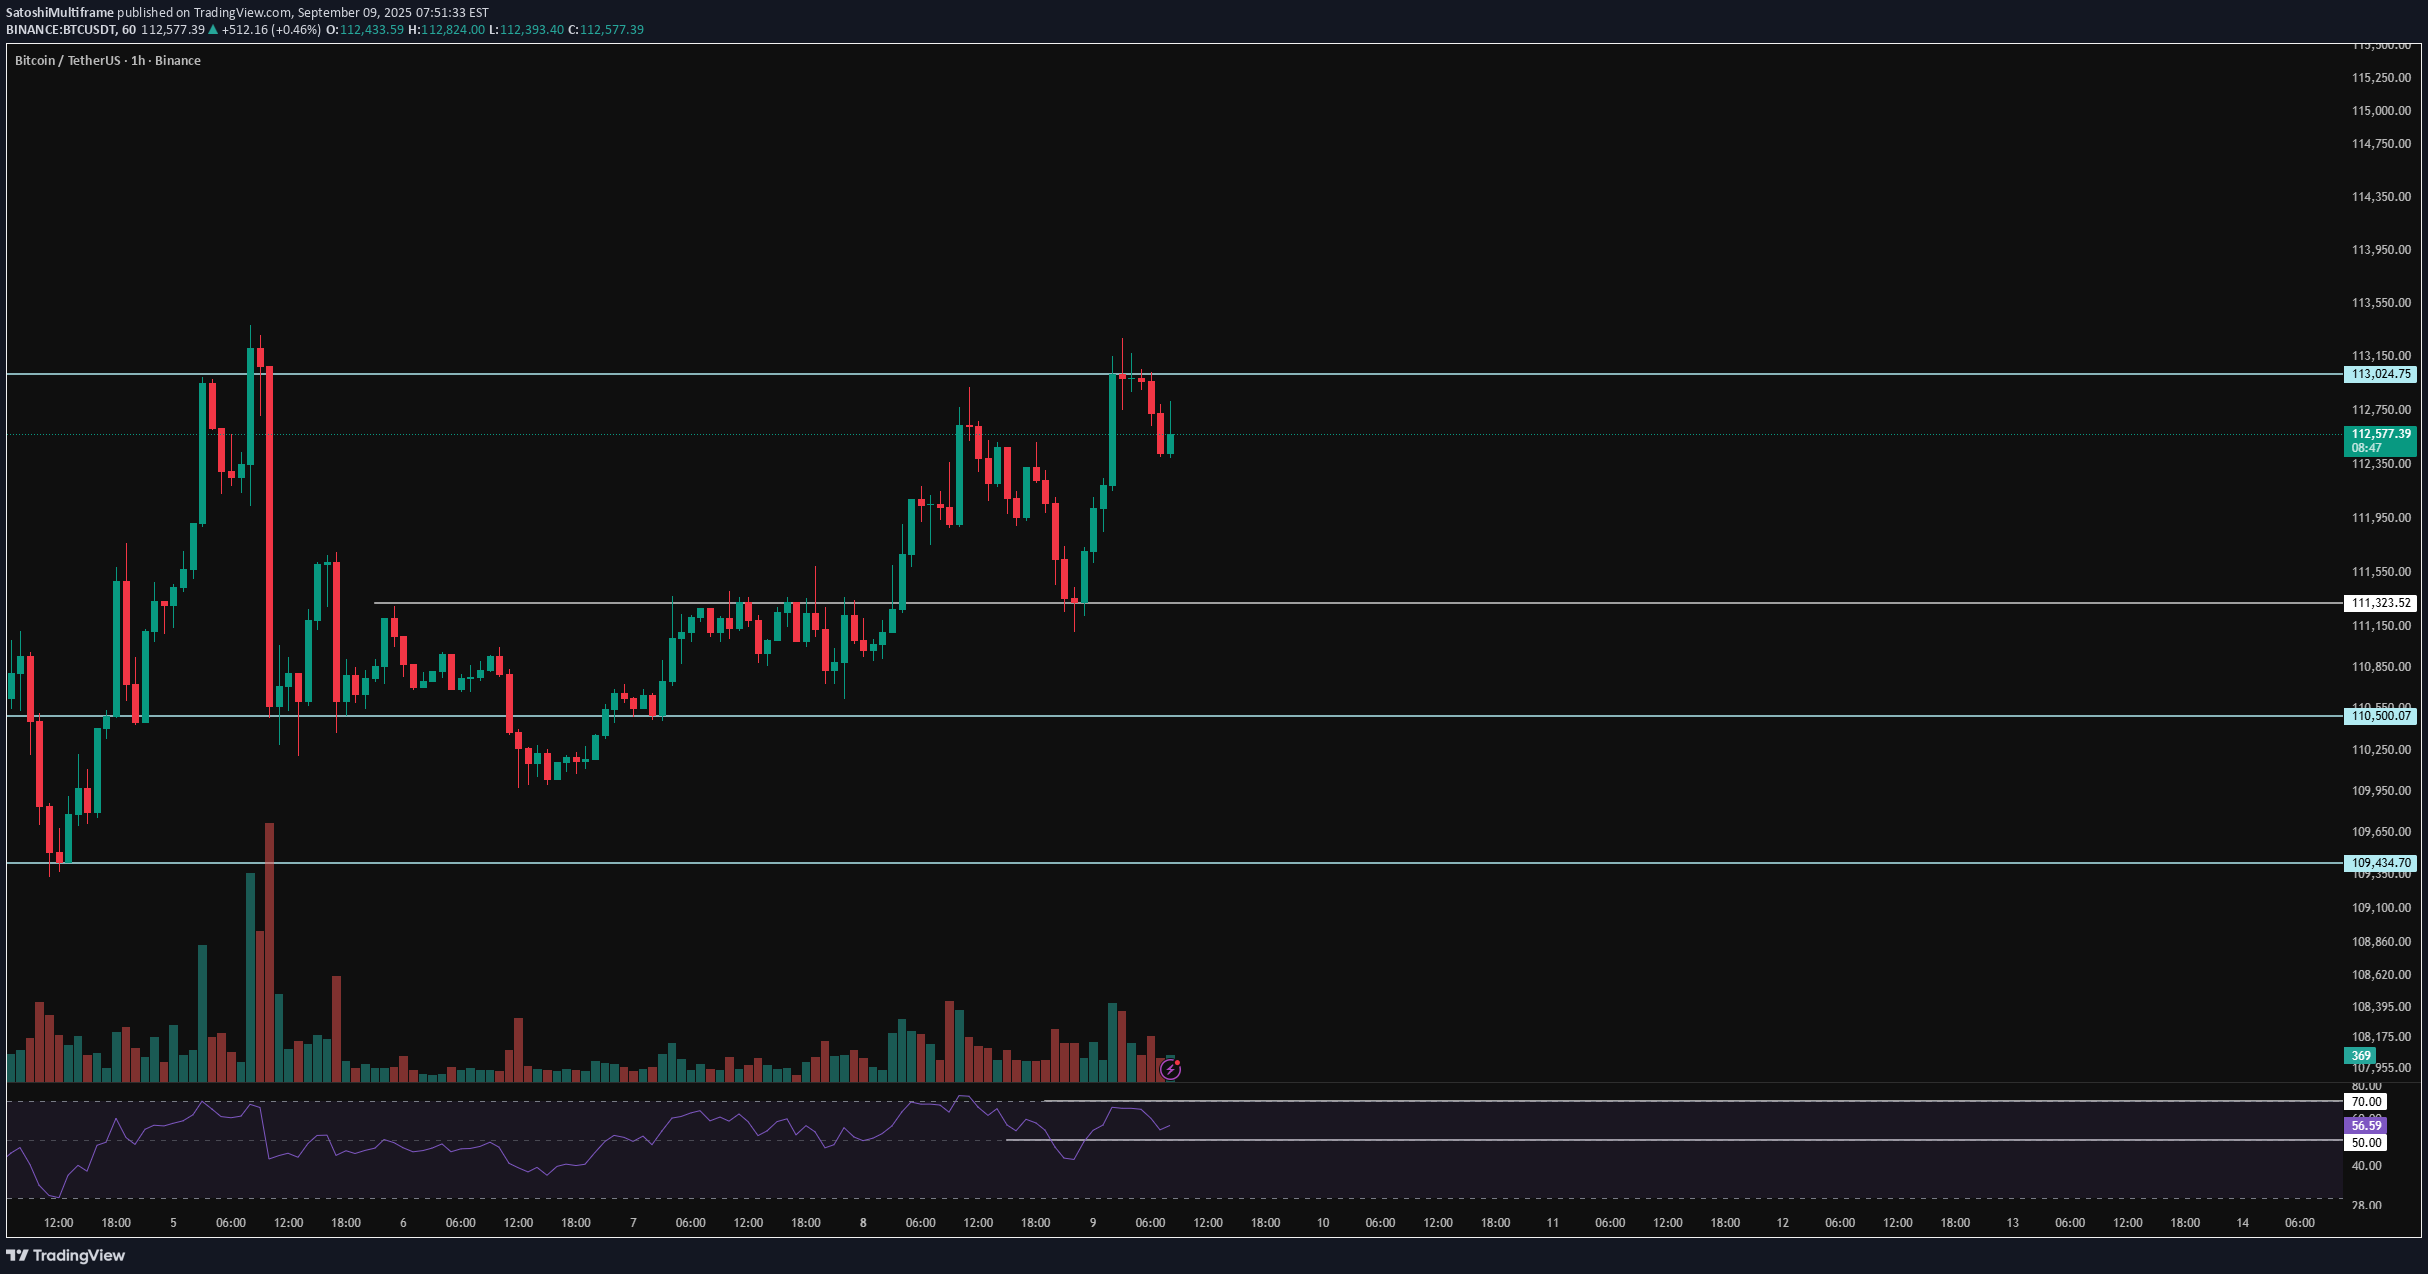
💀 Hey , how's it going ? Come over here — Satoshi got something for you! ⏰ We’re analyzing BTC on the 1-Hour timeframe. 👀 On the 1H timeframe for Bitcoin, we can see that after breaking the 111,330$ resistance, BTC managed to push higher and is now approaching its next key resistance at 113,000$. This level overlaps with the multi-timeframe range high, making it a critical zone. A clean breakout above this area could drive BTC toward higher price targets. ⚙️ On the RSI, the key zones are around 70 and 50. If momentum pushes past these levels—especially with positive news flow—BTC could enter an overbought phase, fueling further upside. 🕯 Candle structure is showing strength: green candles are getting larger with more volume. At the range high, we’ve seen some red candles forming, reflecting seller absorption. However, each test shows weaker selling pressure compared to the last time BTC hit this level—back then, price dumped sharply within just 2 red candles. 📊 Looking at Tether Dominance (USDT.D) on the 1H, after reacting to 4.45%, it broke lower toward 4.39% and even closed below that level. Right now, it’s retesting 4.39%. If this new support fails, dominance could extend lower toward the next support. A breakdown below 4.37% would be strong confirmation for BTC breaking its range high. 🔔 Trading plan : Bitcoin is currently sitting just below the 113,000$ resistance. Don’t rush into a position here. Ideally, wait for : Another test of this resistance. A confirmed breakout with a pullback/retest of 113,000$. Enter long after the retest for a safer entry. ❤️ Disclaimer : This analysis is purely based on my personal opinion and I only trade if the stated triggers are activated .
SatoshiMultiframe
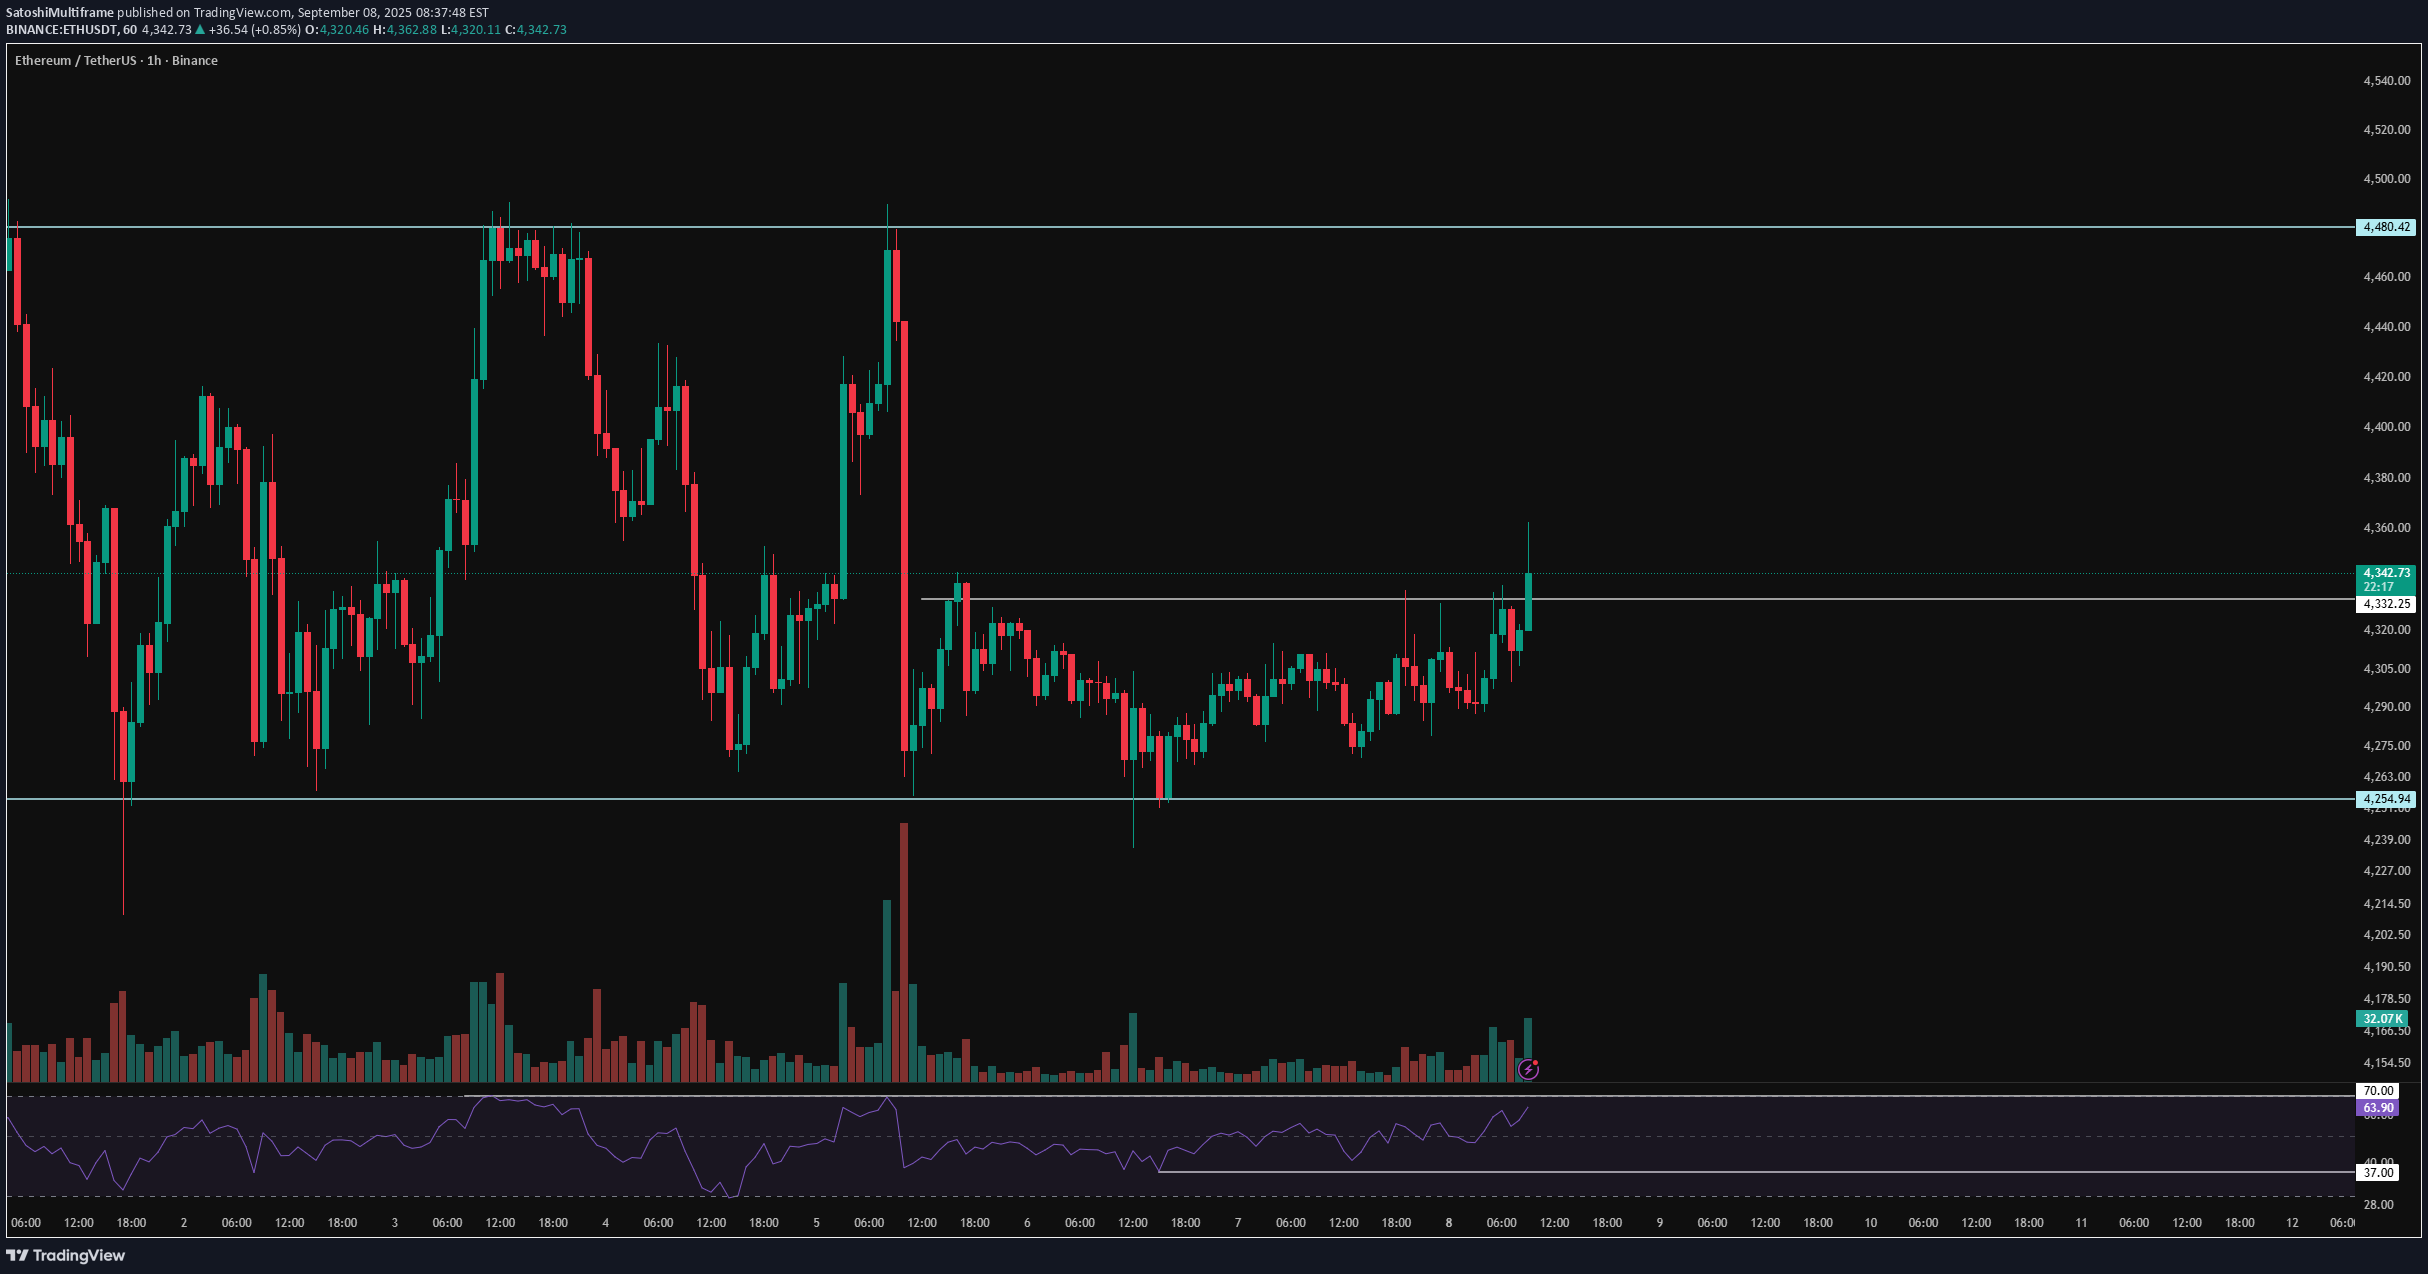
💀 Hey , how's it going ? Come over here — Satoshi got something for you! ⏰ We’re analyzing ETH on the 1-Hour timeframe. 🔭 On the 1H timeframe for Ethereum, we can see that ETH has broken through its resistance zone at $4332. A pullback and consolidation above this level could give us strong trading opportunities. From a multi-timeframe pattern perspective, ETH is still trading inside a larger box, with significant distance remaining to the box’s upper boundary. If ETH confirms this breakout, the next resistance level sits around $4480, and a break above that could push ETH outside of its current range. ⛏ The key RSI zones are 70 and 37. If momentum crosses above 70 into Overbought territory, ETH could continue its current bullish trend. 💰 The size and volume of recent green candles on ETH have been increasing, supported by strong buying. The compressed range structure built during the weekend has now been broken with higher buying volume and the clearing of sell orders. As long as open interest remains strong, ETH has room to move higher. 🪙 Looking at the ETH/BTC pair on the 1H timeframe, it faked out below the marked support level and is now pushing upward. The key resistance here is at 0.03883, and a confirmed breakout above this level could fuel further upside for ETH against USDT. 💡 Currently, Ethereum is sitting in a crucial zone. Multi-timeframe confirmation above this level could give us a clean long setup. The immediate resistance zone is $4332, while further resistance levels can be mapped out with a Fibonacci retracement. ❤️ Disclaimer : This analysis is purely based on my personal opinion and I only trade if the stated triggers are activated .
SatoshiMultiframe
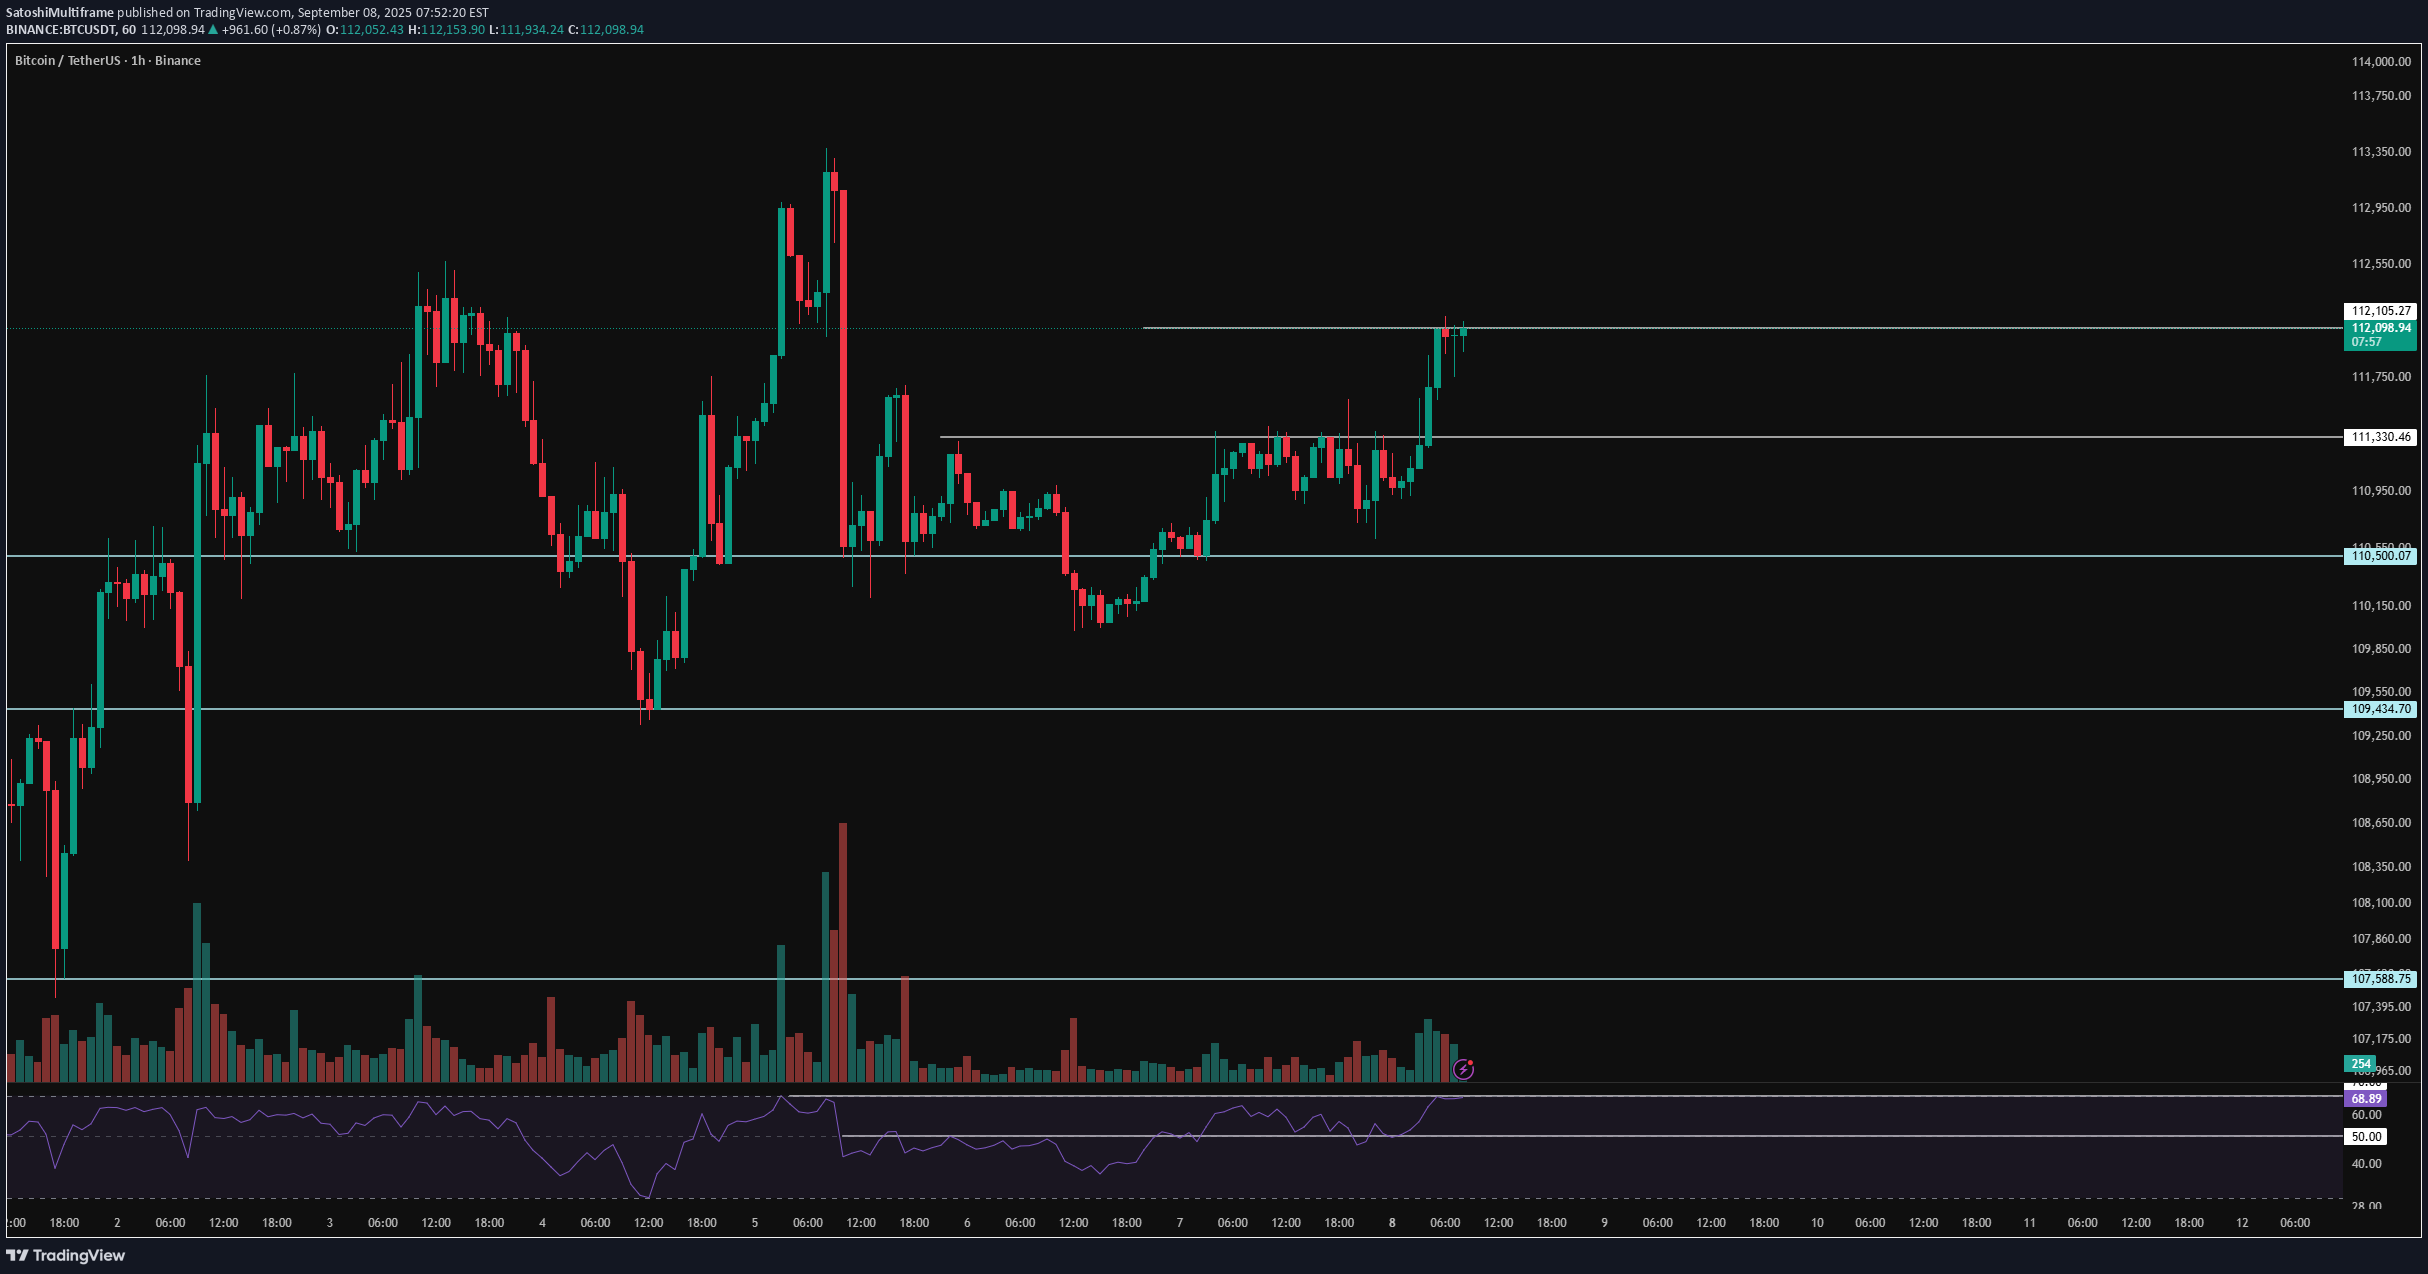
💀 Hey , how's it going ? Come over here — Satoshi got something for you! ⏰ We’re analyzing BTC on the 1-Hour timeframe. 👀 On the 1-hour timeframe for Bitcoin, we can see that BTC has successfully stabilized above the alarm zone at $111,300 and is now sitting right below the resistance at $112,105. With stronger volume and volatility, this setup could give us a long trade opportunity. ⚙️ Key RSI oscillator levels are at 70 and 50. If price action pushes RSI beyond these levels, Bitcoin can continue its current bullish move and sustain the trend. At the moment, RSI is sitting just below the Overbought threshold, and once it enters this zone, the identified resistance could be broken more easily. 🕯 With the start of the new week, buying volume has increased, and the weekly candle closed fairly strong. On the 1-hour chart, the size, volume, and number of green candles are all rising. 📊 Looking at the 15-minute timeframe of Tether dominance (USDT.D), after breaking and stabilizing below 4.45%, dominance continues to move lower. The next support lies at 4.41%, and if this is broken and confirmed, Bitcoin could see even stronger upside momentum early in the week. 🔔 Currently, Bitcoin is sitting just below its resistance. The best approach is to wait for a pullback, either below or above this level, and then open a position with a setup candle confirmation or a multi-timeframe breakout. Two possible scenarios exist here, where a pullback could also give us a tighter stop-loss opportunity. ❤️ Disclaimer : This analysis is purely based on my personal opinion and I only trade if the stated triggers are activated .
Disclaimer
Any content and materials included in Sahmeto's website and official communication channels are a compilation of personal opinions and analyses and are not binding. They do not constitute any recommendation for buying, selling, entering or exiting the stock market and cryptocurrency market. Also, all news and analyses included in the website and channels are merely republished information from official and unofficial domestic and foreign sources, and it is obvious that users of the said content are responsible for following up and ensuring the authenticity and accuracy of the materials. Therefore, while disclaiming responsibility, it is declared that the responsibility for any decision-making, action, and potential profit and loss in the capital market and cryptocurrency market lies with the trader.