Technical analysis by trade1638 about Symbol DOT on 9/7/2025

trade1638
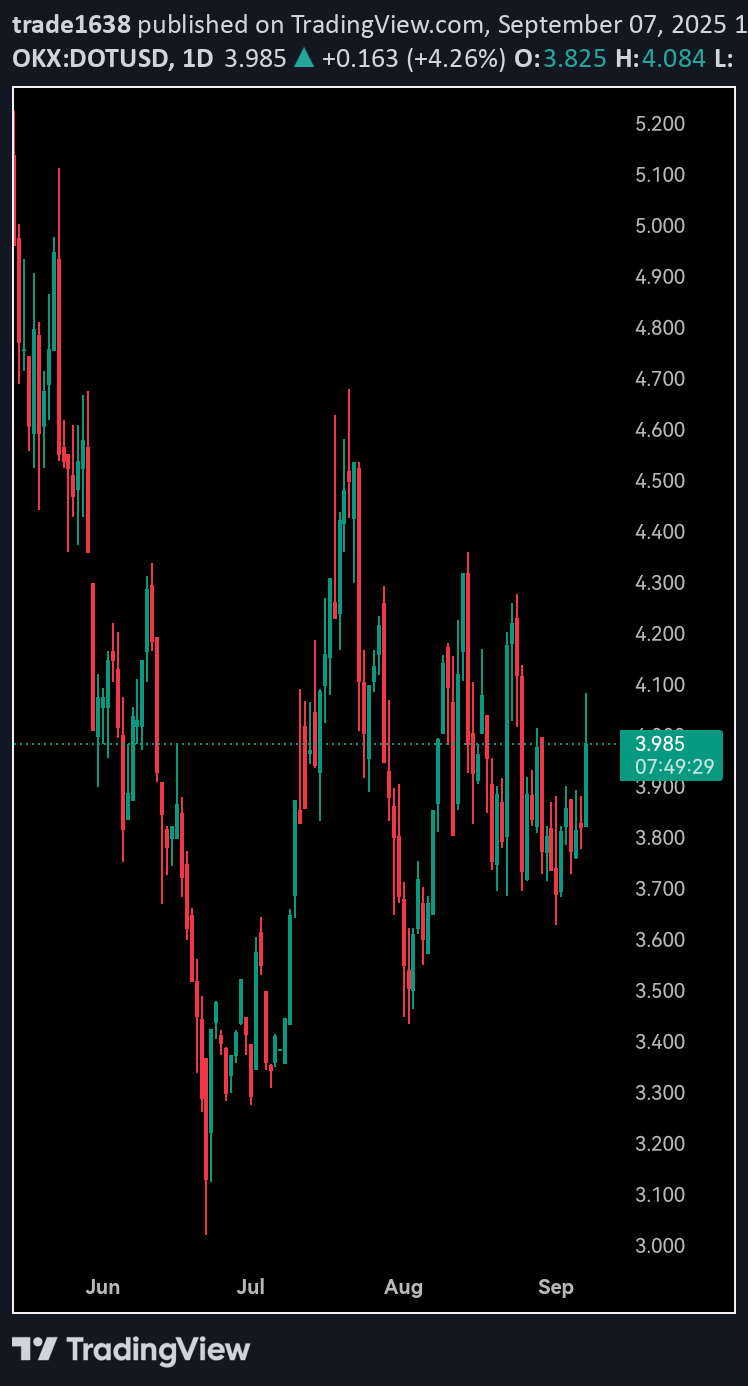
Polkadot (DOTUSD) is currently consolidating around the critical **$5.20** support level, which has served as a key psychological and technical baseline since February 2024. The asset faces persistent bearish pressure, trading below both the 50-day moving average (**$5.80**) and the 200-day moving average (**$6.40**). Volume has remained subdued during recent declines, indicating a lack of strong selling momentum but also absence of substantial buying interest. The daily RSI reads **36**, hovering near oversold conditions yet without clear bullish divergence. The MACD remains below its signal line, though the histogram shows signs of convergence, suggesting weakening downward momentum. Immediate resistance is seen at **$5.80** (50-day MA), with more significant resistance at the **$6.20** Fibonacci retracement level. Fundamentally, Polkadot continues to demonstrate robust ecosystem development with increasing parachain activity and cross-chain integrations. However, these strengths are being offset by prevailing bearish market sentiment. A breakdown below **$5.20** could trigger accelerated selling toward the next major support at **$4.80**. Conversely, a sustained move above **$5.80** with expanding volume could indicate near-term stabilization and potential retest of higher resistance zones. Traders should monitor Bitcoin's trajectory for broader market cues, given DOT's high correlation with major crypto movements.
