
trade1638
@t_trade1638

What symbols does the trader recommend buying?
Purchase History
پیام های تریدر
Filter
trade1638
تحلیل فنی بیتکوین بایننس (BNB): آیا $550 نگهبان صعود است؟

Of course. Here is a technical analysis of Binance Coin (BNB): Binance Coin (BNB) is currently displaying a cautiously optimistic technical picture, having established a solid foundation above a key historical support level. After a significant rally earlier in the year, the coin has entered a phase of consolidation, which appears healthy for its long-term trend. The price is currently navigating within a defined range, with immediate and crucial support found at the $550** level, which coincides with the 50-day Exponential Moving Average (EMA). This dynamic support has held firm on several recent tests, reinforcing its importance. The primary overhead resistance sits near the **$635 - $640 zone, a level that has capped upward movements multiple times, forming a local double top pattern. The Moving Average Convergence Divergence (MACD) is hovering just above its zero line, indicating a slight bullish bias but lacking strong momentum. The Relative Strength Index (RSI) is in a neutral territory around 55, suggesting there is room for movement in either direction before becoming overbought or oversold. The overall structure remains bullish as long as the price holds above the $550** support. A decisive breakout above **$640, accompanied by a surge in volume, could open the path for a retest of the yearly highs near $720**. Conversely, a breakdown below **$550 would signal a shift in sentiment and could trigger a deeper pullback towards the $500 psychological support.
trade1638
تحلیل تکنیکال لایت کوین (LTC): آیا حمایت 70 دلاری حفظ میشود یا ریزش آغاز میشود؟

Of course. Here is a technical analysis of Litecoin (LTC): Litecoin (LTC) is currently exhibiting a cautious and range-bound technical structure, largely mirroring the broader market's indecision. The price action on the daily chart shows LTC trapped between a key support zone around $70 - $72 and a significant resistance level near $82 - $85. The moving average configuration presents a challenge for bulls. The 50-day EMA (around $78) is acting as a dynamic resistance level, while the 200-day EMA (further below) highlights the overall neutral-to-bearish longer-term trend. The price has struggled to sustain momentum above the 50-day EMA, indicating a lack of buyer conviction. The MACD is hovering around its zero line, displaying weak momentum and a series of failed crossover attempts. The RSI is neutral, typically ranging between 40 and 60, which confirms the absence of strong directional bias. The $70** level is the critical support to watch; a decisive break and close below this could trigger a steeper decline towards the **$65 level. Conversely, for a bullish scenario to gain credibility, LTC must convincingly reclaim the $85** resistance. Such a move would likely target the next psychological hurdle at **$90. Volume has been consistently low, reflecting a lack of interest and participation. Until either the $70** support or the **$85 resistance is broken with significant volume, LTC is likely to continue its sideways consolidation. Patience for a confirmed breakout is key.
trade1638
تحلیل تکنیکال اتریوم (ETH): در آستانه انفجار قیمتی! مقاومت و حمایت حیاتی کجاست؟

Of course. Here is a technical analysis of Ethereum (ETH) in English: Ethereum is currently consolidating at a critical technical juncture. On the daily chart, the price has been contained within a $3,400 to $3,750 range, forming a tightening pattern that often precedes a significant volatility expansion. Key moving averages are clustered tightly. The 30-day EMA (around $3,550**) and the 60-day EMA (around **$3,520) are providing a dynamic equilibrium point, but their convergence indicates a lack of strong directional momentum. The MACD histogram is flatlining near zero, with its lines intertwined, reflecting a market in perfect balance. The RSI is neutral, oscillating in the mid-40s to mid-50s, showing neither overbought nor oversold conditions. The immediate and crucial resistance is the range high at $3,750**; a decisive break above this level could trigger a rally towards the key psychological barrier of **$4,000. On the downside, the $3,400** level is paramount, acting as both a psychological and a technical support, closely aligned with the 100-day moving average. A breakdown below this support could open a path toward **$3,200. Volume has been conspicuously low during this consolidation, underscoring market indecision. The current setup is a classic springboard, coiled for a directional move. Traders should wait for a confirmed breakout with increasing volume before committing to a significant position.
trade1638
تحلیل تکنیکال بیت کوین: زنگ خطر انفجار قیمتی در محدوده ۶۰ تا ۶۸ هزار دلار!

Of course. Here is the technical analysis of Bitcoin translated into English: Bitcoin is currently at a critical technical juncture. On the daily chart, the price has been consolidating within a large range between $60,000** and **$68,500, forming a typical converging triangle pattern. The decreasing volatility suggests an impending decisive directional breakout. The moving average system is highly converged, with the 30-day MA (around $64,000)** and the **60-day MA (around $63,200) intertwined, indicating a lack of clear short-term trend direction. The MACD indicator is hovering around the zero line with weak momentum bars, showing a fragile balance between bullish and bearish forces. The RSI is lingering near the neutral 50 level, reflecting market indecision. The key resistance is clearly at $68,500**, which aligns with the previous high and the upper trendline of the triangle. The crucial support level rests at the psychological **$60,000 mark, coinciding with the 100-day moving average. Recent trading volume has continued to shrink, highlighting the market's cautious stance ahead of a potential major move. In summary, Bitcoin's consolidation phase is nearing its end. A decisive break above $68,500** with strong volume would confirm the start of a new upward trend, targeting **$72,000 and beyond. Conversely, a sustained break below $60,000** could trigger a deeper correction towards key support levels like **$56,000. At this pivotal point, patience and waiting for the market to commit to a direction is the more prudent strategy.
trade1638
Of course. Here is the English translation of the analysis for t
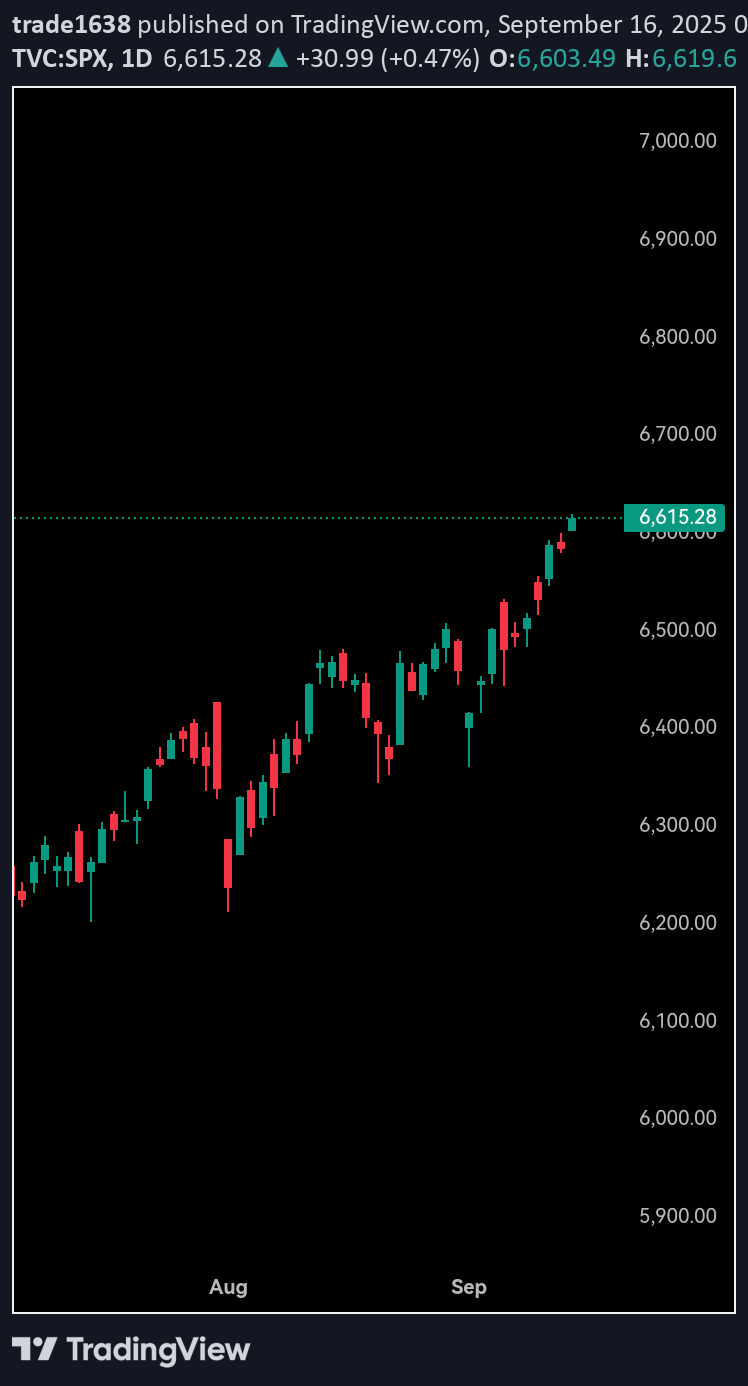
Of course. Here is the English translation of the analysis for the US500 (S&P 500 index): The US500 (S&P 500 Index) is the most authoritative benchmark for gauging the overall health of large-cap U.S. stocks. Covering 11 major sectors, its diversified nature makes it a "barometer" of the U.S. economy. The index is currently trading at all-time highs, driven by a combination of market expectations for Fed rate cuts and the resilience of corporate earnings. It is extremely sensitive to monetary policy; any surprises in inflation (CPI/PCE) or employment data can reshape the interest rate path and trigger a market repricing. Sector rotation within the index is a key focal point. While the leadership of tech giants remains the main engine for gains, the performance of cyclical sectors like energy, financials, and industrials is crucial for market breadth and sustainability, signaling confidence in an economic "soft landing." From a technical standpoint, the 5,300 area has become a new battleground for bulls and bears. If constituent earnings continue to exceed expectations, the index could consolidate its upward momentum; conversely, it faces pullback pressure in a high-valuation environment. Looking ahead, the direction of the US500 will be a tug-of-war between "AI-driven earnings growth" and "higher-for-longer interest rates." Investors should pay balanced attention to mega-cap earnings and broad economic data to assess whether the momentum can broaden. Short-term volatility is inevitable, while the long-term trend remains anchored on whether the U.S. economy can avoid a recession.
trade1638
**BNB Analysis** BNB demonstrates relative strength, consistent
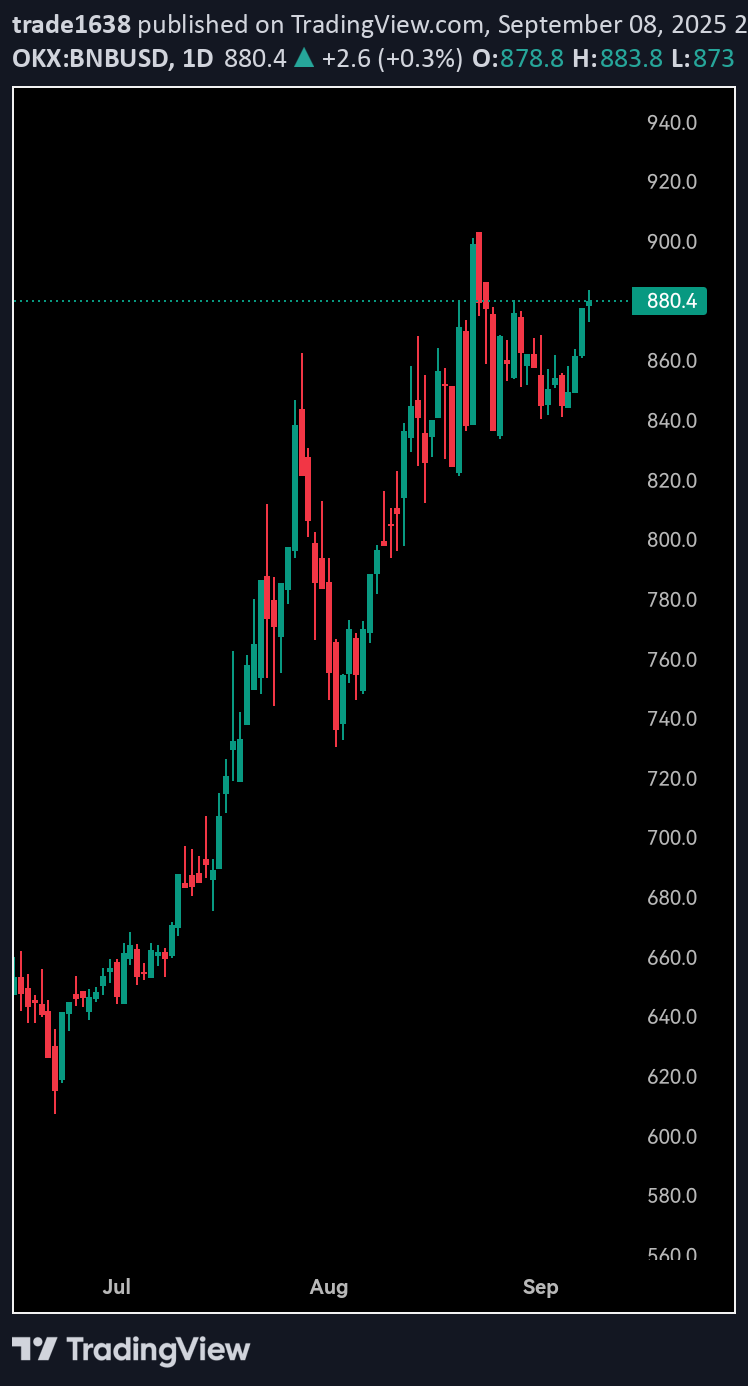
**BNB Analysis** BNB demonstrates relative strength, consistently holding above key support at **$580**. This level is critical for maintaining its bullish structure. Immediate resistance is encountered near **$620**, with a more significant barrier at the **$650** level. Its price is heavily influenced by the performance of the broader Binance ecosystem, including exchange activity, launchpool events, and BNB Chain adoption. Recent developments have provided underlying support. Trading volume remains robust, indicating sustained interest. For upward momentum to continue, BNB needs to break and hold above $650 with conviction. A fall below $580 could signal a deeper correction toward the next support near $550. The overall trend remains cautiously bullish within the current range.
trade1638
**DOGE Analysis** DOGE is currently in a consolidation phase, t
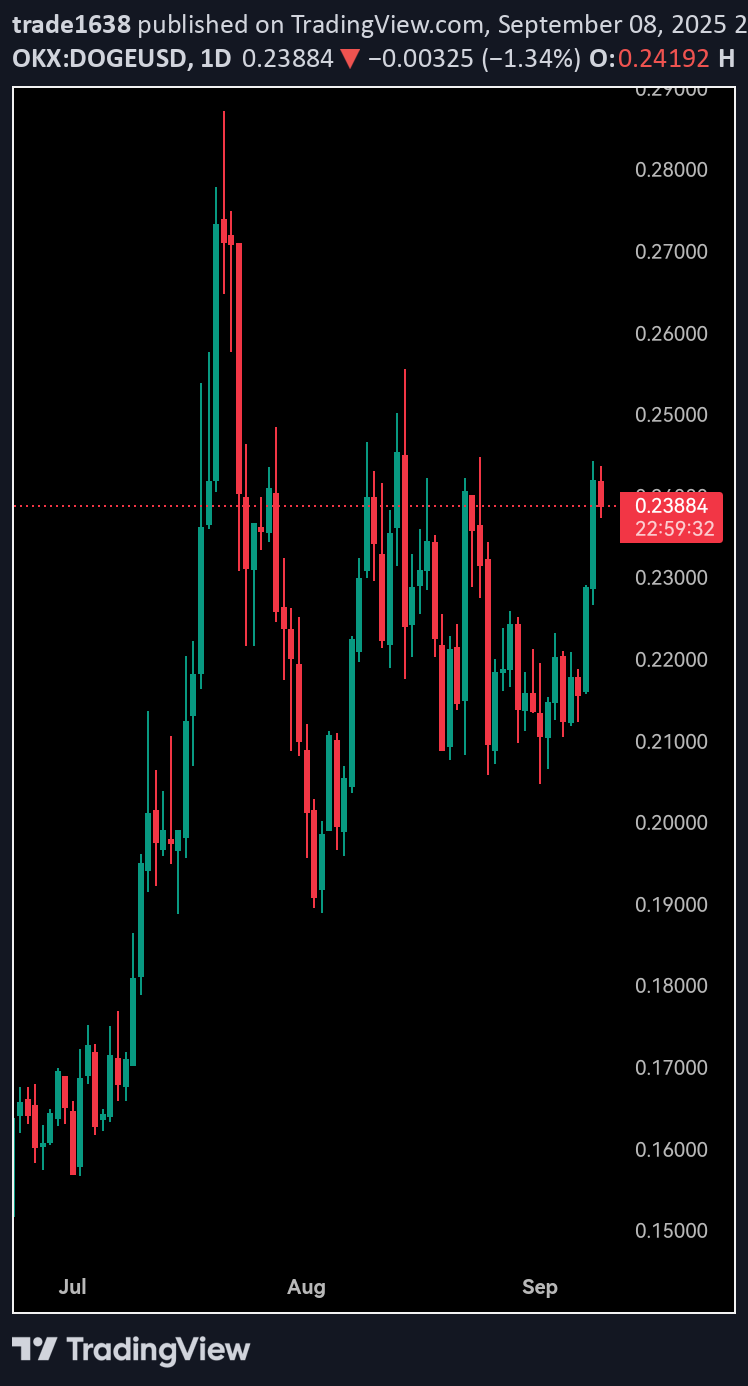
**DOGE Analysis** DOGE is currently in a consolidation phase, trading within a tight range. Key support rests at **$0.12**, a level crucial for maintaining short-term bullish structure. A break below could see a test of **$0.115**. Immediate resistance lies near **$0.135**, with stronger selling pressure expected around **$0.145**. As a meme coin, DOGE's price remains highly sensitive to social media sentiment, particularly Elon Musk's endorsements, rather than fundamental utility. Recent trading volume has been subdued, indicating a lack of strong directional conviction. Overall, DOGE remains dependent on broader crypto market momentum and retail investor interest. A break above $0.145 with high volume could signal a move toward $0.16, while loss of $0.12 support may trigger a deeper pullback.
trade1638
**CHZ Analysis** CHZ is currently consolidating after a volatil
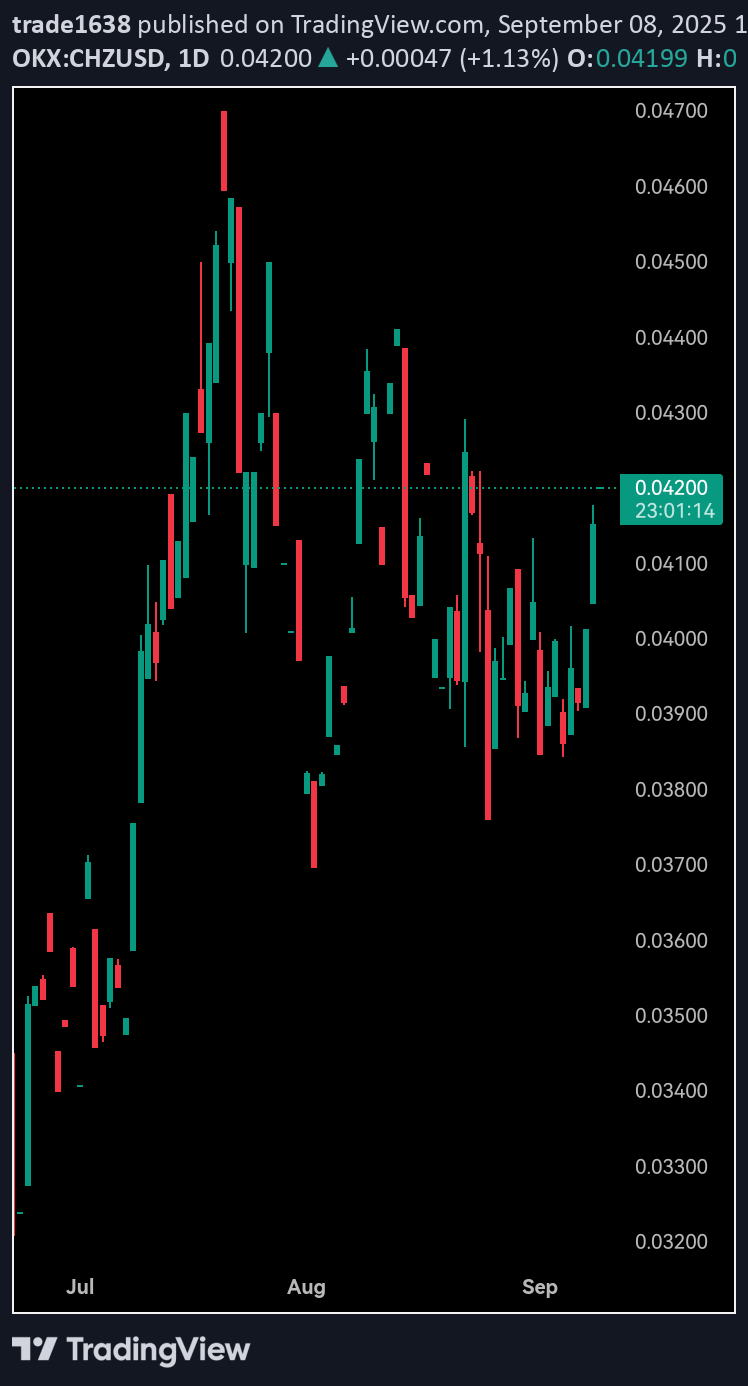
**CHZ Analysis** CHZ is currently consolidating after a volatile period, with its price action largely dictated by broader market sentiment and specific sports event catalysts. Key support sits at the **$0.10** level, a zone that has proven critical in preventing further declines. A sustained break below this could trigger a swift move toward **$0.085**. On the upside, immediate resistance is found near **$0.115**, followed by a more significant barrier around **$0.13**. As the native token of the Chiliz fan engagement platform, its utility is directly tied to sports and entertainment partnerships. Short-term price spikes often align with major sporting events, team token launches, or platform announcements, but these gains have historically been difficult to sustain. Trading volume has been moderate, reflecting a wait-and-see approach from traders. For a bullish reversal, CHZ would need a combination of positive market momentum and sport-specific catalysts to break above $0.13 convincingly. Until then, range-bound trading between $0.10 and $0.13 is the most likely outcome.
trade1638
**XLM Analysis** Stellar (XLM) is currently exhibiting classi
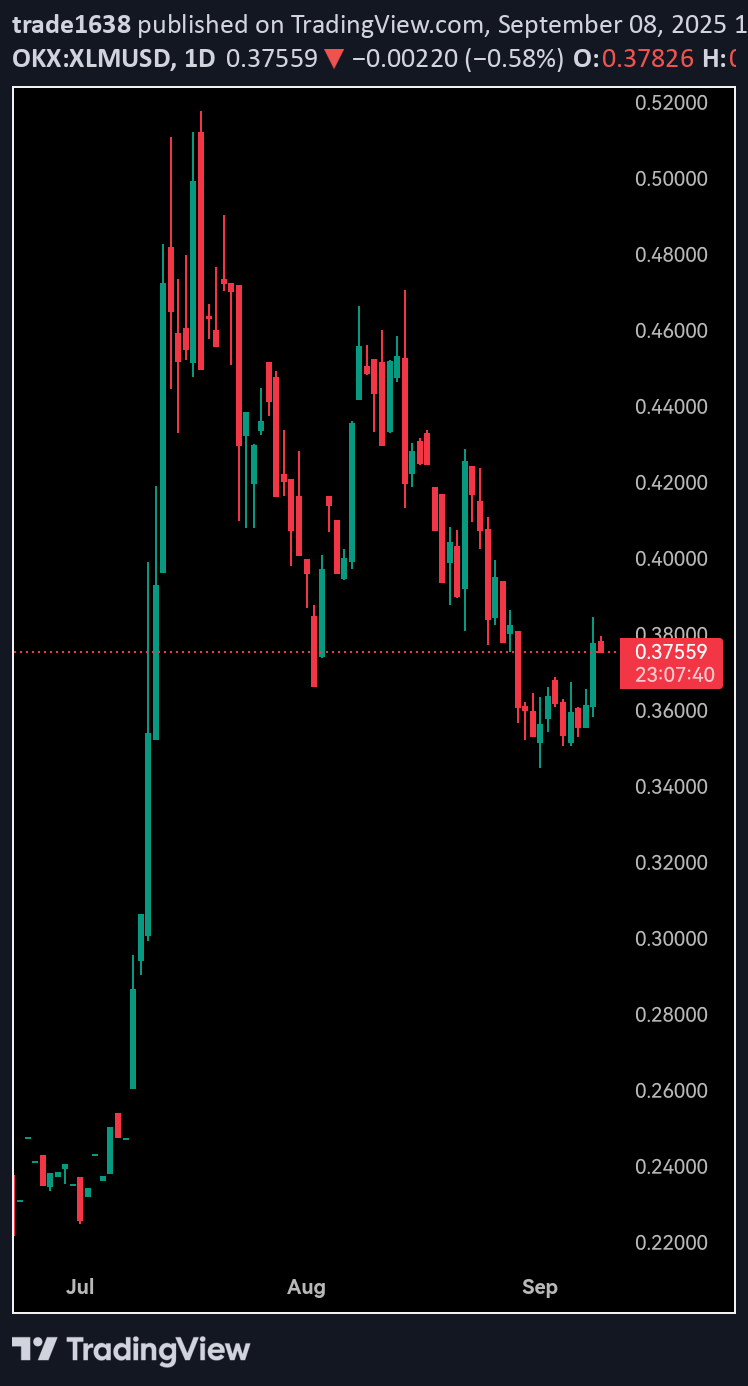
**XLM Analysis** Stellar (XLM) is currently exhibiting classic range-bound behavior, consolidating after its recent price movements. The key psychological and technical support level to watch is **$0.105**. A sustained break below this could trigger a sell-off towards the next significant support near **$0.095**. Conversely, the immediate resistance sits around **$0.115**, with a more formidable barrier at **$0.125**. A decisive daily close above $0.125, accompanied by high trading volume, could be the catalyst for a stronger upward move, potentially targeting the **$0.14** region. Fundamentally, the Stellar network continues to focus on its core strengths: cross-border payments and asset tokenization. Recent developments around its Soroban smart contracts platform aim to enhance its utility and attract developers. However, like many altcoins, XLM's price is heavily influenced by broader market sentiment and Bitcoin's trajectory. The trading volume has been average, suggesting a period of accumulation or distribution before the next significant price swing. The Relative Strength Index (RSI) is hovering around neutral territory, indicating a balance between buying and selling pressure. In the short term, expect continued consolidation between $0.105 and $0.125. Traders should monitor Bitcoin's momentum and overall crypto market cap flows, as these will be primary drivers. A break from this range with expanding volume will likely dictate the next directional trend.
trade1638
**ADA Analysis** ADA's price action remains within a defined co
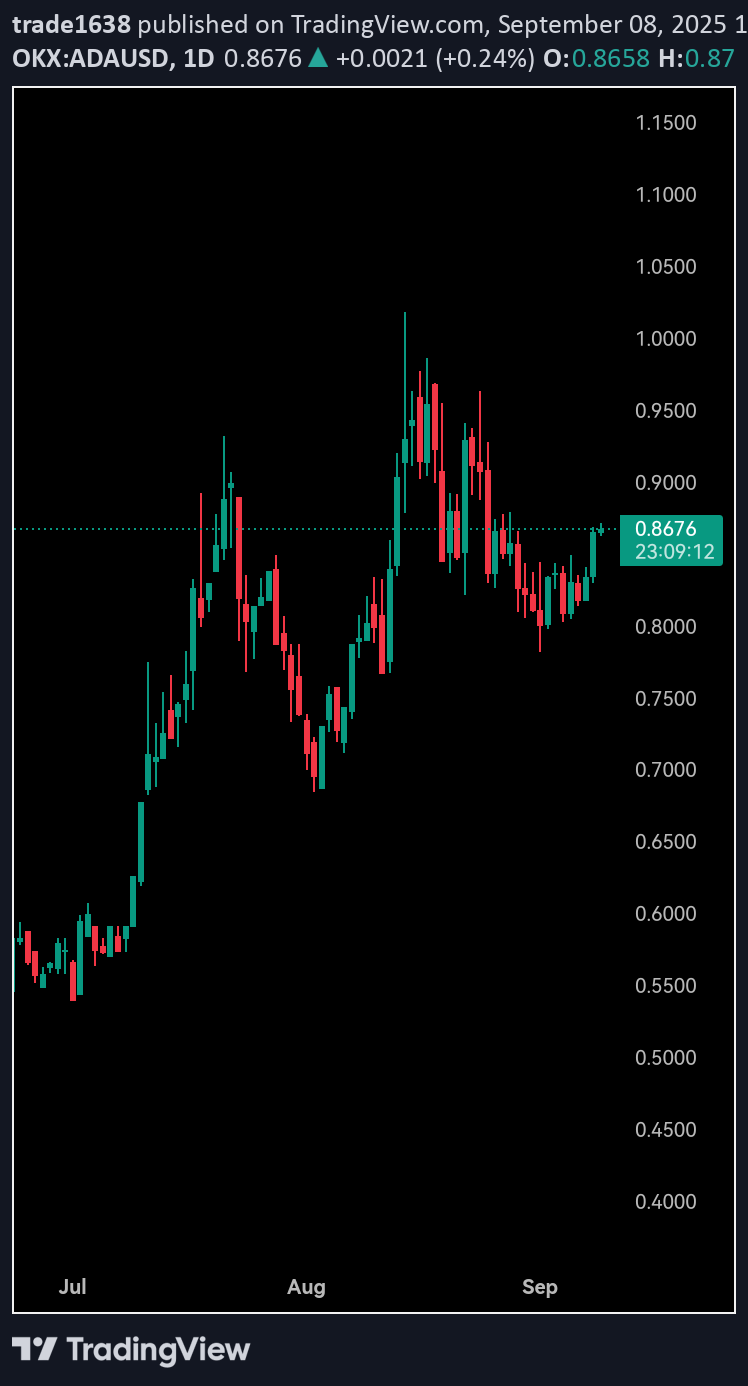
**ADA Analysis** ADA's price action remains within a defined consolidation range, struggling for a decisive directional breakout. Key support rests at the $0.45 level, a zone critical for maintaining bullish structure. On the upside, resistance is firm around $0.55-$0.58. A sustained move above this is needed to signal strength and target higher levels. Trading volume has been relatively subdued, indicating a lack of strong conviction from either bulls or bears. Fundamentally, development activity within the Cardano ecosystem continues, but the market awaits major catalysts to drive significant momentum. The current trend is neutral to slightly bearish in the short term. Watch for a volume-backed break above $0.55 or a drop below $0.45 for the next major move. Broader market sentiment will also be a key factor.
Disclaimer
Any content and materials included in Sahmeto's website and official communication channels are a compilation of personal opinions and analyses and are not binding. They do not constitute any recommendation for buying, selling, entering or exiting the stock market and cryptocurrency market. Also, all news and analyses included in the website and channels are merely republished information from official and unofficial domestic and foreign sources, and it is obvious that users of the said content are responsible for following up and ensuring the authenticity and accuracy of the materials. Therefore, while disclaiming responsibility, it is declared that the responsibility for any decision-making, action, and potential profit and loss in the capital market and cryptocurrency market lies with the trader.