Technical analysis by EA_GOLD_MAN_COPY_TRADE about Symbol BTC: Buy recommendation (9/5/2025)

EA_GOLD_MAN_COPY_TRADE
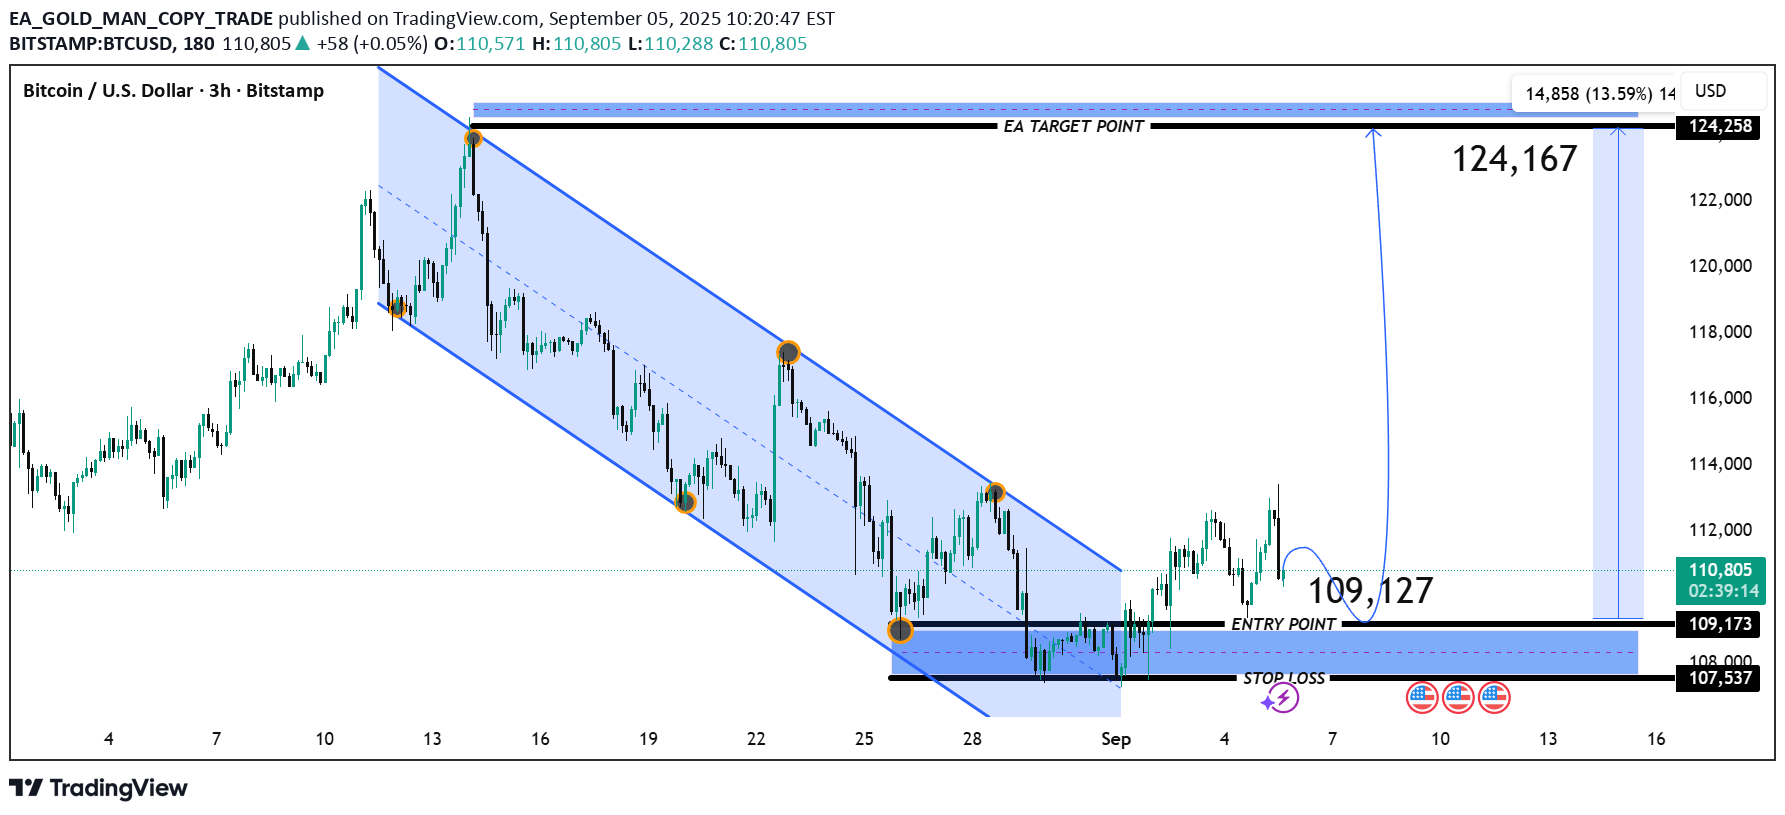
1. Trend Context The chart shows BTC in a descending channel (highlighted in blue) from mid-August to early September. Recently, price broke out of this channel to the upside, signaling a potential trend reversal. 2. Key Levels Entry Point: Around 109,127 – 109,173 USD (highlighted zone). Stop Loss: Around 107,537 USD, just below recent support. Target Point (EA Target): 124,167 – 124,258 USD. 3. Risk–Reward Setup Entry vs Stop Loss: Risk ≈ 1,600 points. Entry vs Target: Reward ≈ 15,000 points. Risk-to-Reward ratio ≈ 1:9.3, which is very favorable. 4. Technical Signals Breakout of Downtrend: Price exited the descending channel, which often suggests the end of bearish momentum. Support Zone Retest: The entry level aligns with a strong support zone (black box), previously resistance during the channel breakdowns. Upside Projection: Target around 124K corresponds to previous strong resistance and Fibonacci extension. 📈 Trading Idea (based on chart) Buy Entry: ~109,127 – 109,173 Stop Loss: ~107,537 Take Profit: ~124,167 – 124,258 Expected Gain: +13.5% (approx.) Expected Loss: -1.5% (approx.) ⚠️ Notes This is a high risk–reward setup favoring bulls, but BTC is very volatile. If price falls below 107,500, the bullish setup invalidates. Confirmation with higher timeframes (Daily/Weekly) would strengthen the trade signal. ✅ In summary: The chart suggests a bullish breakout trade, with entry around 109K, stop below 107.5K, and a large target near 124K. The setup favors buyers if support holds.
