Technical analysis by Orriginal about Symbol BTC on 9/5/2025

Orriginal
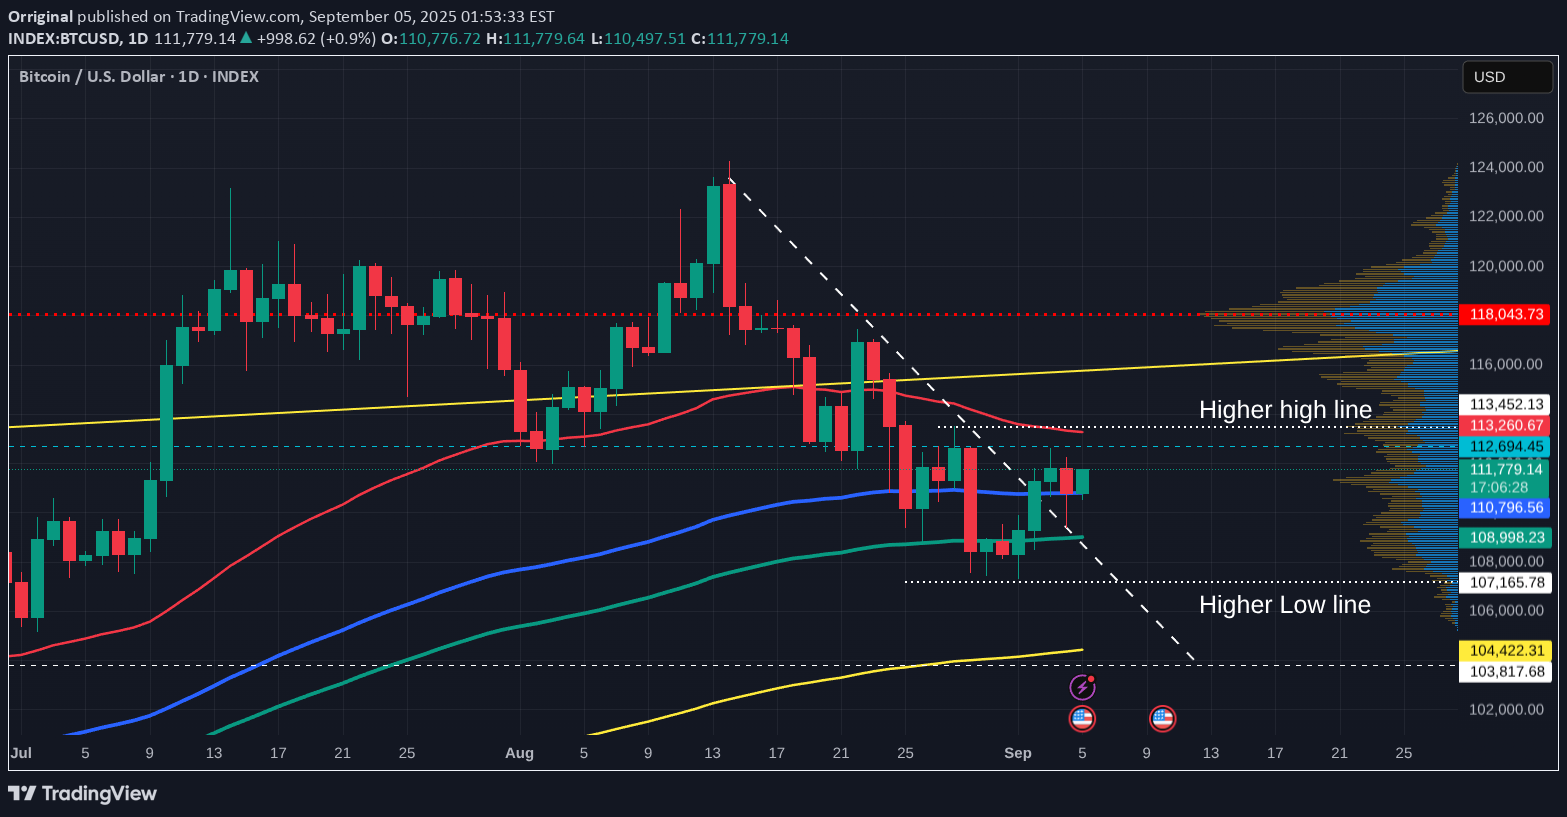
This chart uses the SMA, Simple Moving Average Red = 50, Blue = 100, Green = 128, Yellow = 200 As expected, PA came down and tested the trend line that has rejected PA since 13 August and has since bounced back up. We will have to wait and see but this may have created a Higher Low as PA rose and now sits on the 100 as support. Should PA continue to rise from here, the 50 SMA at 113254 is the line of resistance we Need to cross and test. This would then give is a Higher High. After that, the next Higher High will be at a price after 119 Should PA get rejected, the 128 SMA is at 108995 and then the previous Low is at 107165 The Daily MACD seems to have Crossed above its signal line This is "only Just " and so we wait to see where it goes form here but we are certainly looking Bullish in a longer term as Bulls show us they can respond. The 4 hour BTC PA chart This chart makes me a little cautious for now, waiting for confirmation of this move higher, See how that 2nd Green candle after the bounce, came up and got rejected off the 100 SMA and the current candle is having the same problem. We do seem to have support on the 50 SMA PA is currently in a tight range above, with the SMA's very tight. It is easier for PA to Drop from here so today could be a battle. The 4 hour MACD is also at a point of crossing The MACD here has NOT yet crossed the signal line and so we wait, watching to see what happens. The Histogram shows positive momentum. It should be remembered that we have the USA calling the possibility of Rate cuts this month. If the FED goes against the grain, this could be damaging and should the FED decide to cut rates, we are off to the races. This month is Pivotal. Long term still Bullish, short term undecided..remaining Bullish CAUTIOUS
