Technical analysis by lubosi about Symbol BTC: Buy recommendation (9/4/2025)

lubosi
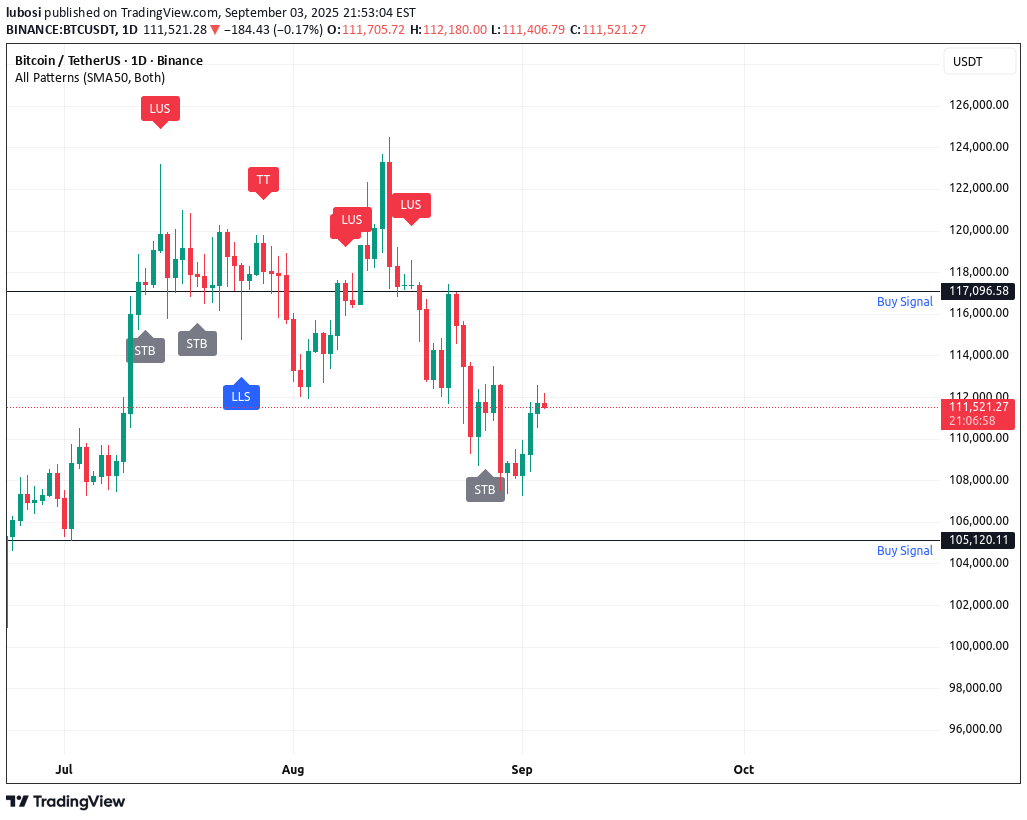
Bitcoin (BTC/USD) Buy Signal – Trend Resumes After Pullback ₿🚀 Bitcoin is also flashing a buy signal when viewed with the same 3-step system, showing strong confluence across timeframes. Step 1 – Daily Candlestick: Bullish Reversal On the daily chart, Bitcoin has printed a bullish engulfing/rejection candle, suggesting buyers have stepped in aggressively after a recent pullback. This is a strong reversal signal. Step 2 – Weekly Oscillators: Sell / Strong Sell The weekly oscillator rating is showing Sell / Strong Sell. This may appear bearish at first glance, but in the context of Bitcoin’s structural uptrend, it signals a short-term dip that may provide an attractive entry zone before momentum turns bullish again. Step 3 – Monthly Moving Averages: Strong Buy / Buy On the monthly chart, Bitcoin remains firmly in a Strong Buy / Buy rating above its key moving averages. This confirms that the long-term uptrend remains strong, and pullbacks should be treated as buying opportunities. ✅ Daily Candlestick → Bullish reversal ✅ Weekly Oscillator → Temporary weakness offering entry ✅ Monthly MAs → Long-term bullish structure Trade Idea: Traders may look for long entries on confirmation candles, with stops below the daily reversal low. Profit targets could be staged toward recent highs and key psychological levels like $75,000 and beyond. Disney (DIS) Buy Signal – Pullback Creates Opportunity 🎬📈 Disney (DIS) is flashing a fresh buy opportunity backed by multi-timeframe alignment in the 3-step trading system. Step 1 – Daily Candlestick: Bullish Pattern On the daily chart, Disney has printed bullish candlestick signals, including rejection wicks showing buyers defending support levels. This confirms demand is stepping in at lower prices. Step 2 – Weekly Oscillators: Sell / Strong Sell The weekly oscillator rating is in Sell / Strong Sell territory. This reflects short-term momentum weakness, but in the context of a bullish backdrop, this pullback is often the perfect setup for positioning early before momentum swings back upward. Step 3 – Monthly Moving Averages: Strong Buy / Buy On the monthly timeframe, moving averages are firmly in Strong Buy / Buy mode. This confirms that the long-term trend is bullish and the bigger picture supports higher prices ahead. ✅ Daily Candlestick → Bullish trigger ✅ Weekly Oscillator → Short-term weakness = buy-the-dip setup ✅ Monthly MAs → Long-term trend intact and rising Trade Idea: Traders may consider entering on dips with stops below recent daily lows. Potential upside targets include previous resistance zones and long-term highs. ⚠️ Disclaimer: These analyses are for educational purposes only and not financial advice. Trading stocks, forex, or crypto carries risks. Always test strategies on a demo account first , and make sure to use proper risk management and profit-taking strategies to protect your capital.
