Technical analysis by Orriginal about Symbol BTC on 9/3/2025

Orriginal
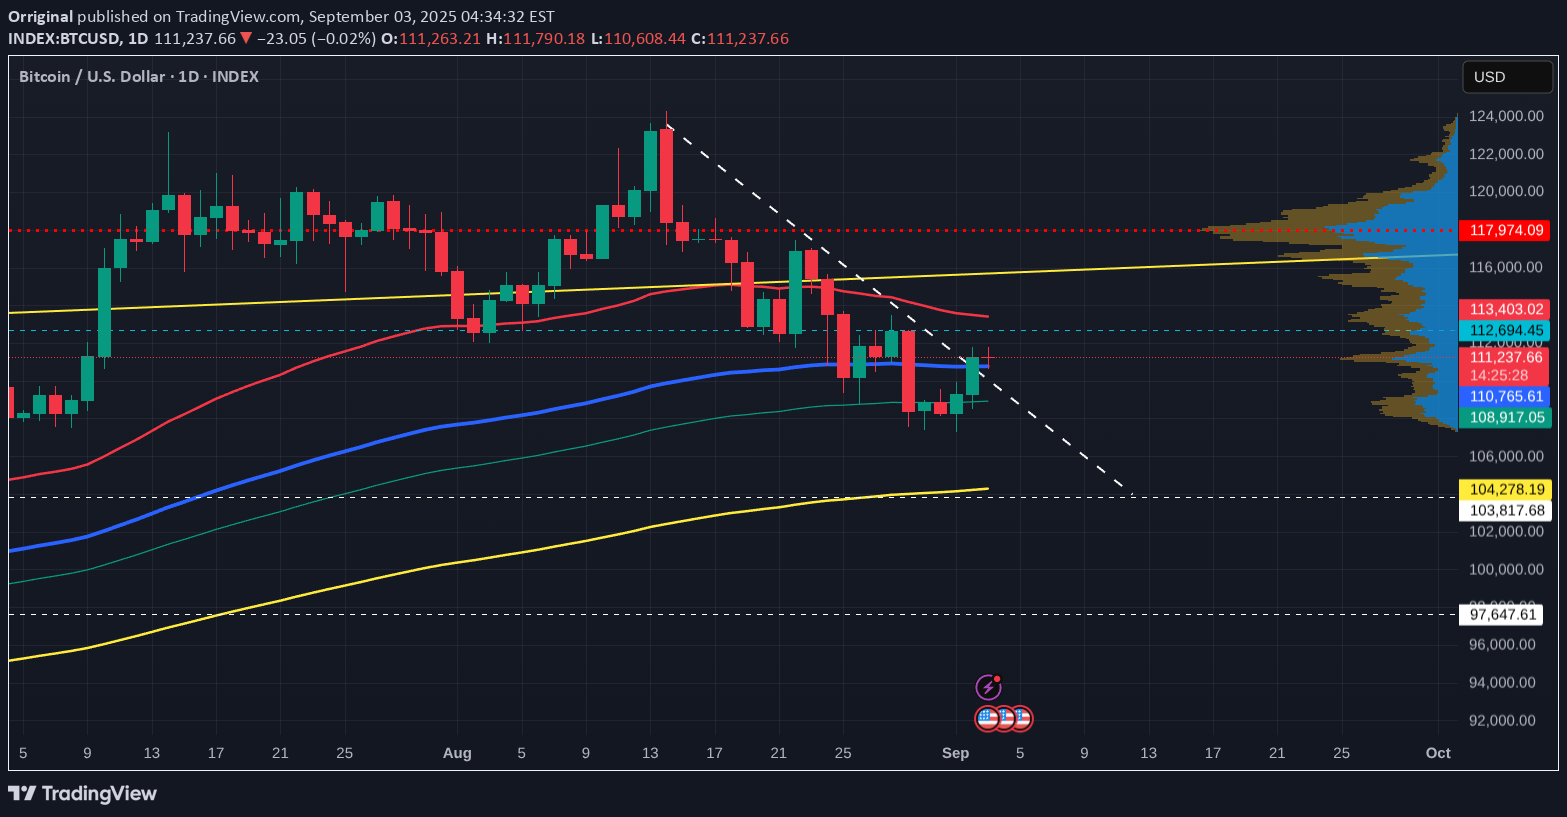
This daily chart uses the SMA, Simple Moving Average Red = 50, Blue = 100, Green = 128, Yellow = 200 Yesterday, PA broke through the descending line of resistance it had been under since 13 August. As yet, this does not mean PA will now rise, though on a daily chart, the MACD certainly has the room to move higher, as seen below However, given where we are in a traditionaly quiet month, I do still see PA sliding down this line in the bear future...testing it as support This maybe supported by the fact that the shorter term 4 Hour MACD has Crossed Neutral but the Hitogram is showing White bars and not Green. This shows a weakening and the MACD line moving closer to the red signal line. The Daily RSI is also turning over but remains above its MA for now So for now, we see PA has broken over the Daily 100 SMA and is testing as support. Above, we have the 50 at 113300 This could be the next line of resistance if PA rises now. Should PA turn down now, we have the 100 SMA at 110762. Below that , the 128 sits at 108194 To remain above that descending trend line, we need to Range in the area we currently are in and stay above that 100SMA at 110K for at least the next 24 hours If we look at the Bitcoin 4 hour chart, we see this maybe possible PA sits in a very tight range between the 50 and the 100 4 hour SMA and is currently sitting on the VRVP Point of control ( red dotted line ) This is all support but we have to wait and see if it remains so. There is Very little action trading right now...we just waiting.
