Technical analysis by MyTradingJournal6th about Symbol BTC: Sell recommendation (8/26/2025)

MyTradingJournal6th
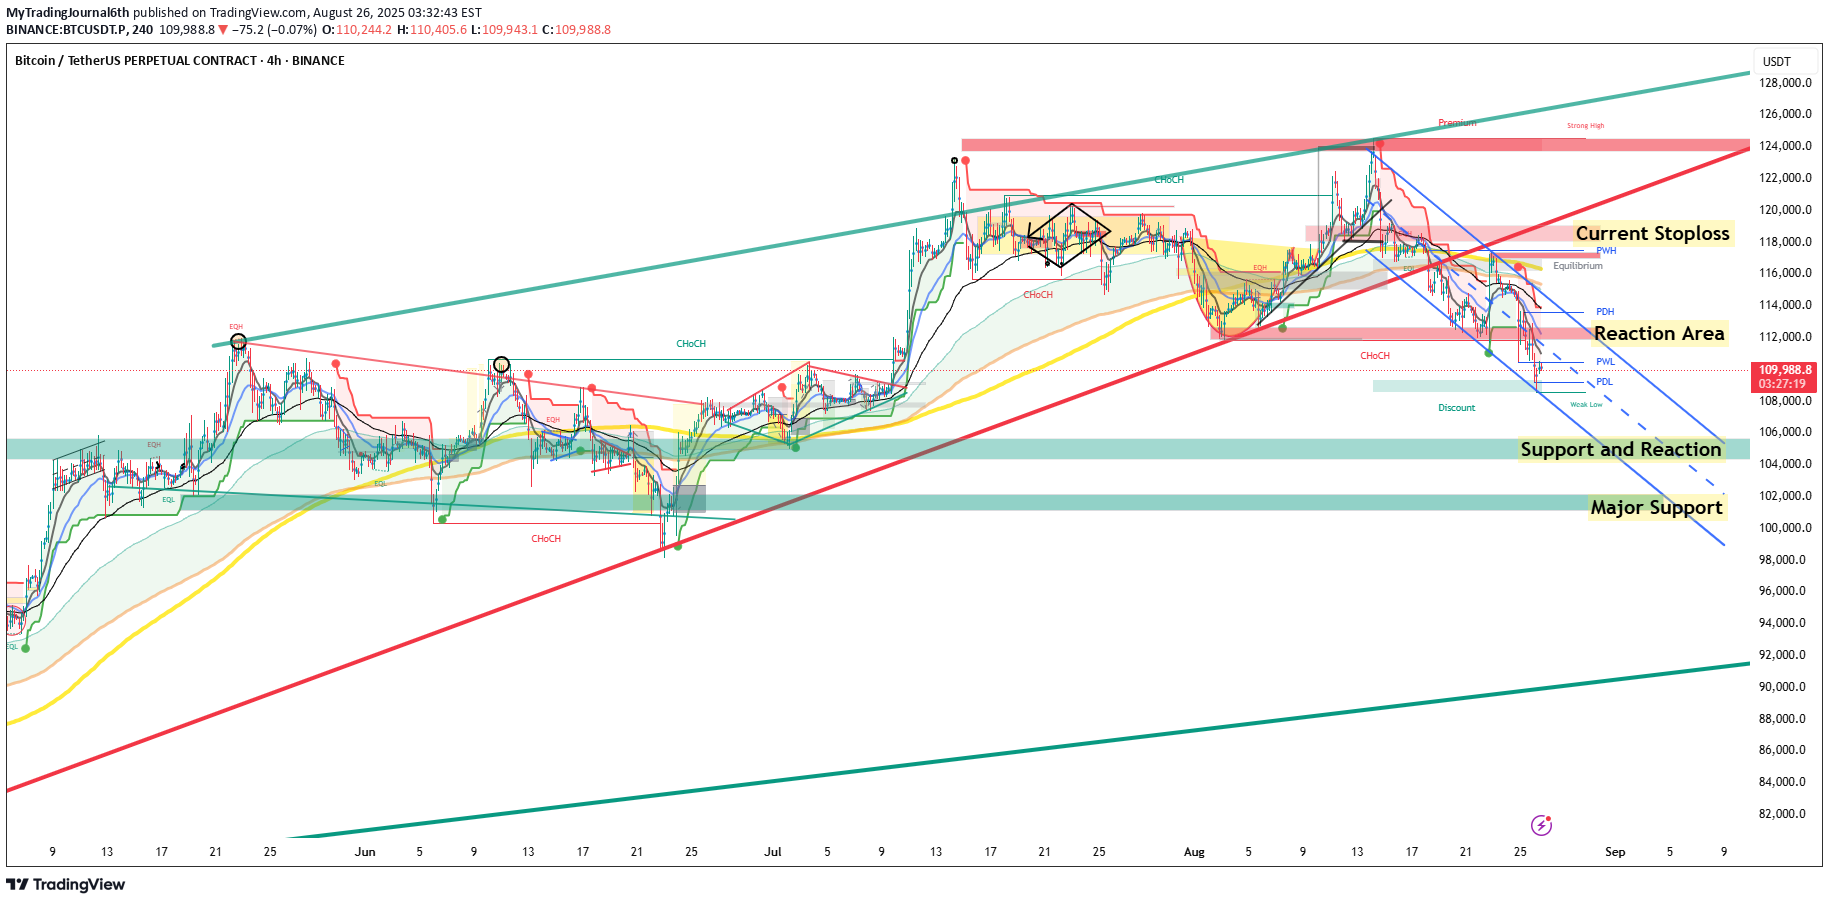
Snapshot (26 Aug 2025, 13:16 IST) BTC hovers near $110k after a volatile flush from last week’s $123k high. The 24‑h range spans $108.67k–$112.93k, and the pivot sits around $110–112k. Technical View – Price is inside a descending channel from the mid‑August all‑time high. – Immediate support lies at $108k, with a major demand block at $105k. – Resistance sits at $112k (channel top/20‑day EMA) then $118k. – Daily RSI is near neutral (≈48) and MACD remains negative. – 4H structure hints at a falling wedge; a break could spur fast expansion. Trade Plan – Long above $112,000 → T1 $114,500, T2 $118,000; SL $109,500; timeframe swing. – Short below $108,000 → T1 $105,000, T2 $101,000; SL $112,000; timeframe swing. Intraday: bullish if 1H closes > $111k (target 112.8k); bearish if < $109k (target 107.5k). Invalidation Bearish view invalid if daily close > $114,500 with convincing volume. Big Picture Medium‑sized whales are distributing while smaller holders accumulate; ETF flows are mixed and macro data (GDP & PCE) loom this week. Engage Will BTC reclaim $112k or revisit $105k first? Share your view below.
